Market Overview
| Study Period | 2020 - 2031 |
|---|---|
| Forecast Data Period | 2026 - 2031 |
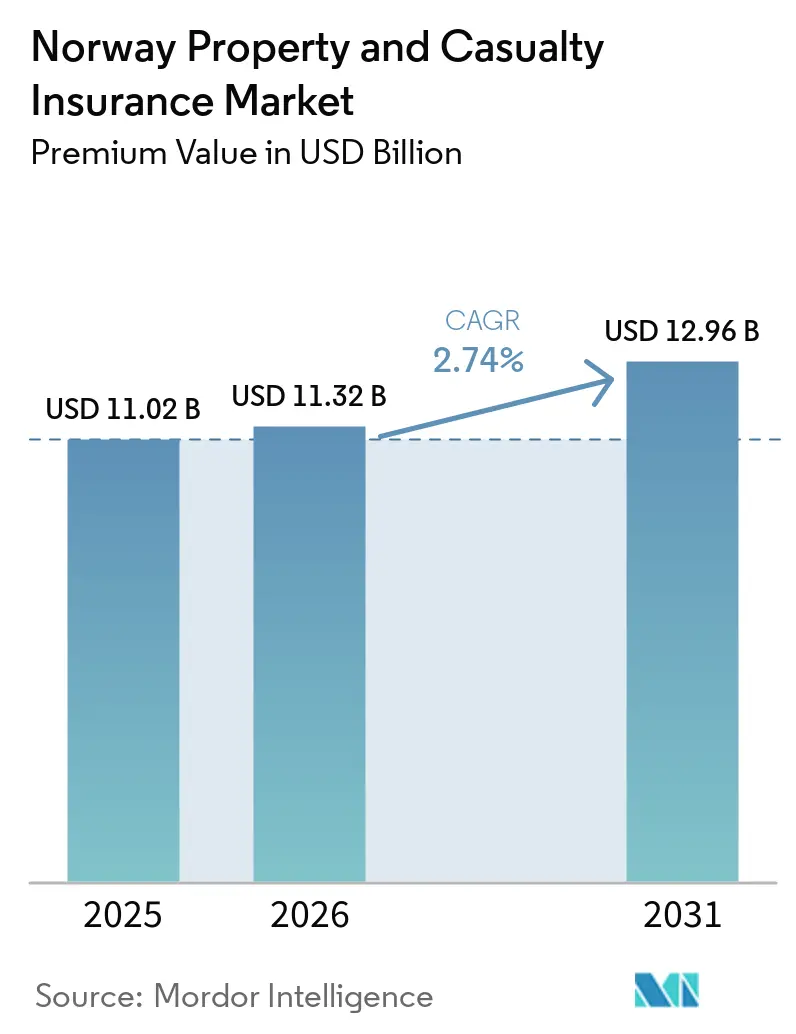
| Base Year Market Size (2025) | USD 11.02 Billion |
| Market Size (2026) | USD 11.32 Billion |
| Market Size (2031) | USD 12.96 Billion |
| Growth Rate (2026 - 2031) | 2.74% CAGR |
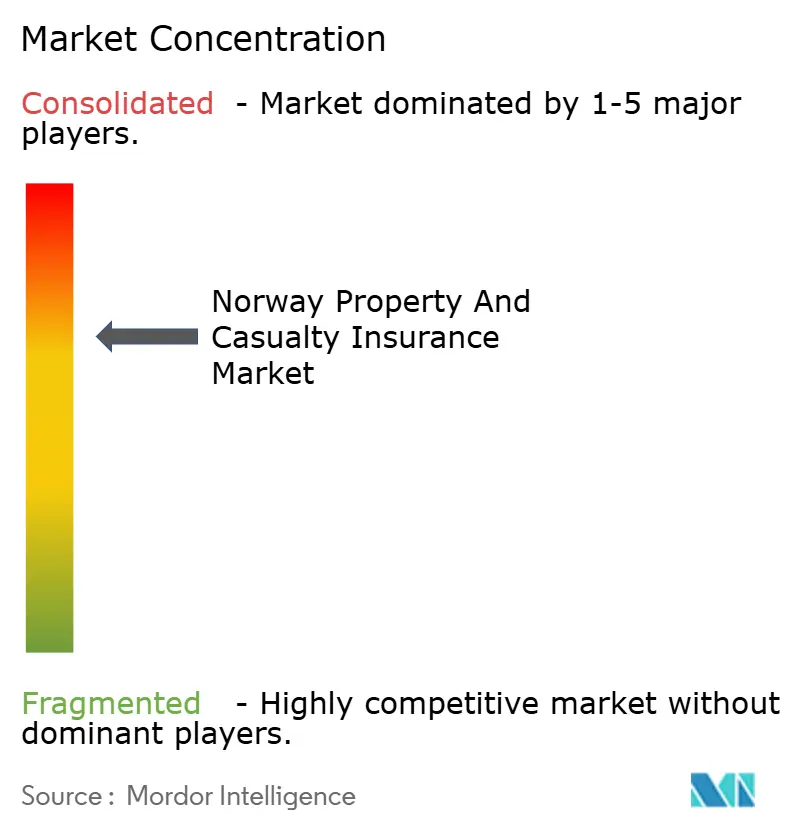
| Market Concentration | Medium |
Major Players *Disclaimer: Major Players sorted in no particular order Image © Mordor Intelligence. Reuse requires attribution under CC BY 4.0. | |
Norway Property and Casualty Insurance Market Analysis by Mordor Intelligence
The Norway Property And Casualty Insurance Market size in terms of premium value is expected to increase from USD 11.02 billion in 2025 to USD 11.32 billion in 2026 and reach USD 12.96 billion by 2031, growing at a CAGR of 2.74% over 2026-2031.
Moderate growth hides sharp shifts in underwriting practice as climate-linked water and wind losses climb, natural-peril pooling rules tighten, and insurers chase operational savings through straight-through processing. Demand for broad property covers rises as municipalities map flood exposure, while statutory motor liability preserves stable premium flow even as EV-specific risks emerge. Meanwhile, digital aggregators compress acquisition costs and expand price transparency, fuelling customer switching that squeezes margins. The oligopolistic structure of the Norway property and casualty insurance market encourages scale-driven efficiency projects, yet it also intensifies price competition that threatens profitability when loss ratios spike after severe storms.
Key Report Takeaways
- By product type, motor insurance led with 37.15% of Norway property and casualty insurance market share in 2025, while property insurance is forecast to register the fastest 4.28% CAGR by 2031.
- By distribution channel, direct sales held 53.75% of revenue in 2025, but digital aggregators are expanding at a 6.12% CAGR through 2031.
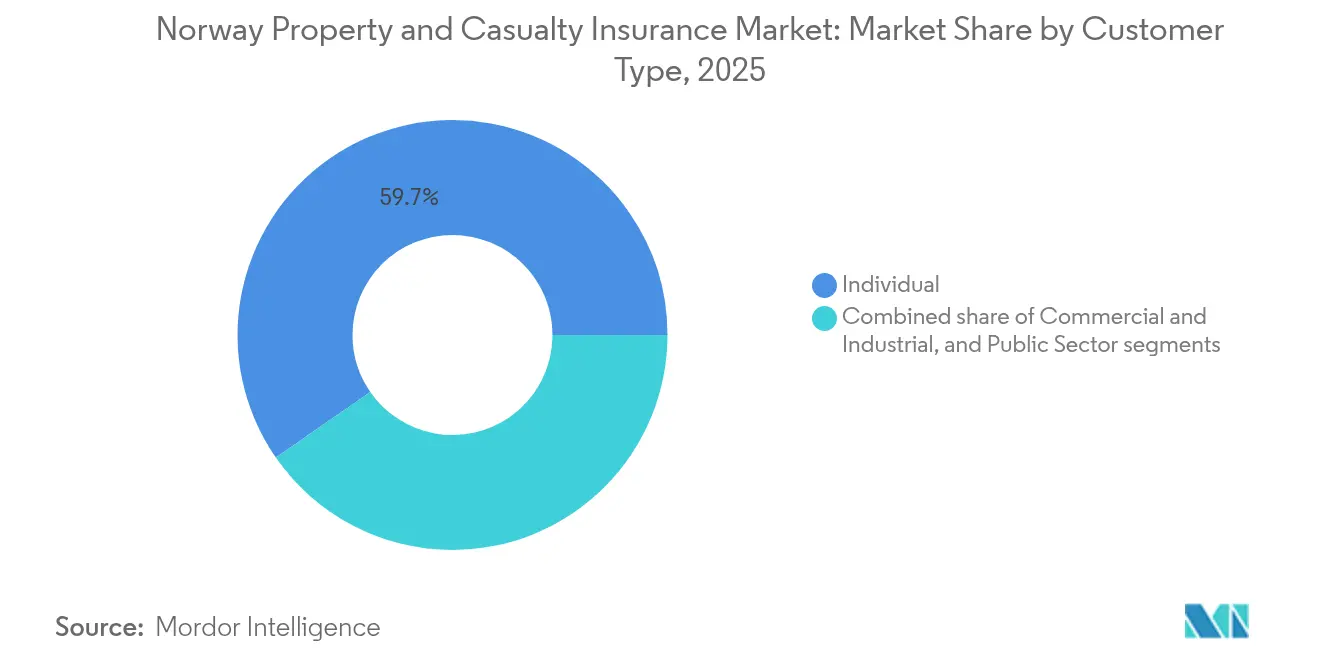
- By customer type, individual buyers accounted for 59.65% of written premiums in 2025; the commercial and industrial segment is advancing at a 4.52% CAGR as cyber add-ons gain traction.
- By region, Eastern Norway captured 42.85% revenue in 2025, whereas Western Norway delivered the fastest 4.33% CAGR on the back of coastal infrastructure build-out.
Note: Market size and forecast figures in this report are generated using Mordor Intelligence’s proprietary estimation framework, updated with the latest available data and insights as of 2026.
Norway Property and Casualty Insurance Market Trends and Insights
Drivers Impact Analysis*
| Driver | ( ~ ) % Impact on CAGR Forecast | Geographic Relevance | Impact Timeline |
|---|---|---|---|
| Climate-linked catastrophe frequency boosts property demand | +1.2% | National; highest in Western & Southern Norway | Long term (≥ 4 years) |
| Statutory motor liability & expanding vehicle fleet | +0.8% | National; strongest in Eastern urban areas | Medium term (2-4 years) |
| Rising real-estate values and household wealth | +0.6% | National; premium growth in Eastern & Western Norway | Medium term (2-4 years) |
| Digital-first distribution lowering acquisition cost | +0.4% | National; early adoption in cities | Short term (≤ 2 years) |
| Naturskadeordningen pool stabilises reinsurance cost | +0.3% | National coverage with regional risk pooling | Long term (≥ 4 years) |
| SMB demand for cyber add-ons to property cover | +0.2% | National, with concentration in business hubs | Medium term (2-4 years) |
| Source: Mordor Intelligence | |||
Climate-Linked Catastrophe Frequency Boosts Property Demand
Extreme rain, storm surges, and landslides triggered USD 389 million in pool-covered claims during 2023, pushing the Natural Perils Pool into a USD 218.4 million deficit and spotlighting the limits of historic pricing models[1]Norwegian Natural Perils Pool, “Årsrapport 2024,” naturskade.no. Sea-level projections warn of heightened flooding if global warming exceeds 2 °C, prompting coastal municipalities to embed adaptation costs into zoning rules. Around 200,000 buildings need preventive investments worth USD 7.7 billion, stimulating demand for higher property sums insured. Policyholders increasingly request risk-mitigation advice; surveys show more than 50% of homeowners want guidance on drainage and overland water controls. Insurers in the Norway property and casualty insurance market, therefore, deploy granular climate analytics to keep underwriting profitable despite rising capital charges.
Statutory Motor Liability & Expanding Vehicle Fleet
Norway's motor liability regime ensures steady demand, while varied traffic-fee tariffs maintain risk-based pricing[2]Skatteetaten, “Trafikkforsikringsavgift 2025,” skatteetaten.no. As the vehicle parc grew and EV penetration hit record levels, exposure widened significantly. However, harsher winters in 2024 led to an increase in collision frequency, putting pressure on profit margins. In response, Gjensidige raised rates after experiencing a deterioration in its motor loss ratio. The adoption of usage-based telematics has enabled insurers to implement more precise pricing models, tailoring premiums to individual driving behaviors. Additionally, the introduction of new battery-fire endorsements addresses the emerging risks associated with electric vehicles, providing enhanced coverage for policyholders. Despite the market's maturity, Norway's property and casualty insurance sector continues to experience modest growth in motor premiums, supported by ongoing urbanization trends and the rising average value of vehicles.
Digital-First Distribution: Lowering Acquisition Cost
Digital aggregators grow at 6.54% CAGR by offering side-by-side quotes that channel price-sensitive shoppers into low-touch journeys. SpareBank 1 reached nearly 40% straight-through issuance on mass-market policies after installing rule-based underwriting that shortens cycle times. Annual savings harvested through global delivery models at leading carriers are reinvested in mobile claims apps, elevating retention for younger demographics who demand frictionless service. Lower acquisition cost supports profitability even as average premiums fall in a price war environment across the Norway property and casualty insurance market.
Naturskadeordningen Pool Stabilizes Reinsurance Cost
Amendments to the Natural Perils Insurance Act that take effect in January 2025 set up a dedicated capital fund inside the Norwegian Natural Perils Pool. All 93 fire insurers must belong to the pool, which now spreads risk across policies carrying a combined fire sum insured of roughly USD 2.34 trillion. The new equalization rules and pooled reinsurance give each carrier clearer visibility on its catastrophe costs, supporting steadier profit planning and capital allocation. By sharing losses, the scheme keeps property cover affordable even in high-risk coastal and valley areas. Better disaster-response coordination and faster data sharing among pool members are also expected to shorten claims processing and lift customer satisfaction[3]Norwegian Natural Perils Pool, “Årsrapport 2024,” naturskade.no.
Restraints Impact Analysis*
| Restraint | ( ~ ) % Impact on CAGR Forecast | Geographic Relevance | Impact Timeline |
|---|---|---|---|
| Price war in a saturated market | -0.7% | Nationwide; fiercest in Eastern Norway | Short term (≤ 2 years) |
| Prolonged low investment returns pressure profitability | -0.5% | Nationwide | Medium term (2-4 years) |
| Solvency-II climate stress raises capital needs | -0.4% | Nationwide; bigger impact on cross-border groups | Long term (≥ 4 years) |
| Shift to “green” underwriting raises loss-cost uncertainty | -0.3% | Nationwide; varied by region | Medium term (2-4 years) |
| Source: Mordor Intelligence | |||
Price War in a Saturated Market
In Norway's property and casualty insurance market, four leading players command two-thirds of the premiums. However, the rise of digital tools has led to relentless price shopping, squeezing profit margins, and intensifying competition. A notable 25% customer-switching rate in 2024 highlights a lack of brand loyalty and increasing price sensitivity among consumers, making it challenging for insurers to retain customers. Gjensidige adopted aggressive pricing strategies, leading to a 2.7-point uptick in its combined ratio in Q2 2024. This move underscores the fierce competition that can diminish the advantages of scale as insurers are forced to balance pricing strategies with profitability. Furthermore, with aggregators amplifying the trend of commoditization, insurers face mounting pressure to differentiate themselves. As a result, there is an urgent need for service innovation and enhanced customer experiences to stand out in the crowded and highly competitive market.
Solvency-II Climate Stress Raises Capital Needs
In its 2024 assessment, EIOPA reduced the industry's solvency ratio from 221.8% to a mere 123.3%, underscoring the potential of severe climate events to significantly deplete capital reserves. It highlights the vulnerability of the insurance market to extreme climate scenarios and the need for enhanced risk management strategies. Norwegian institutions, under the watchful eye of Finanstilsynet, grapple with heightened disclosure mandates, leading to increased modeling and reporting expenditures. These additional requirements strain operational budgets and demand significant investments in technology and expertise to meet compliance standards. These liquidity shortfalls could compel asset divestitures during market downturns, hampering growth investments for smaller mutuals. In contrast, larger entities buoyed by robust balance sheets may capitalize on these challenges, exacerbating the divide within Norway's property and casualty insurance sector. This growing disparity could reshape competitive dynamics, with larger players potentially consolidating their market position at the expense of smaller competitors.
*Our forecasts treat driver/restraint impacts as directional, not additive. The impact forecasts reflect baseline growth, mix effects, and variable interactions.
Segment Analysis
By Product Type: Property Cover Gains Momentum Over Motor Dominance
Motor generated 37.15% of the Norway property and casualty insurance market in 2025, but its mature status caps expansion even as the vehicle fleet grows. Property lines grow at 4.28% CAGR, fuelled by flood and wind peril losses that push homeowners toward higher sums insured. The motor category’s heavy weighting still anchors premium volume, yet frequent winter collisions drove Gjensidige to revise tariffs after a spike in the loss ratio. Climate analytics now underpin property pricing, raising technical rates but also encouraging preventive services bundling. Liability, accident, and marine covers contribute steady but smaller revenue, while cyber endorsements are the fastest-rising niche as SMEs ensure intangible exposures.
In the realm of reinsurance spending, property treaties are now absorbing larger retentions, while motor portfolios are leaning on heightened deductibles to mitigate ceded costs. By redistributing risk capital, insurers are optimizing their financial resilience and operational efficiency. Additionally, these changes are intensifying the actuarial focus on catastrophe aggregates, ensuring a more precise evaluation of potential risks and exposures.


By Distribution Channel: Direct Scale Meets Aggregator Disruption
Direct channels held a 53.75% share of the Norway property and casualty insurance market in 2025, leveraging brand equity and integrated banking ties. Yet aggregators’ 6.12% CAGR signals accelerating digital substitution, especially among urban millennials. Brokers remain critical for complex corporate accounts, delivering advisory value that digital tools cannot replace. Banks cross-sell bundled covers alongside mortgages, though new open-insurance APIs reduce lock-in. Affinity groups and gig-platform tie-ups offer micro-duration covers that appeal to flexible workers, broadening reach at minimal marginal expense.
Insurers now orchestrate omnichannel journeys: chatbots triage service claims while human advisers intervene on high-severity losses. The blending of touchpoints lets carriers defend customer lifetime value even when initial quotations originate on third-party aggregator sites, sustaining relevance across the evolving Norway property and casualty insurance market.
By Customer Type: Commercial Demand Outpaces Individual Volume
Individual policyholders still supply 59.65% of premiums, cementing the scale for mandatory motor and household lines. Nonetheless, commercial and industrial accounts grow 4.52% a year as firms buy flood-resilient property covers and cyber extensions. SMEs seek packaged solutions that wrap liability, property, and data-breach protections, easing compliance with nascent digital-risk directives. Public entities anchor stable long-tail liability portfolios, but budgetary constraints limit premium gain.
As consumers switch providers, churn rates rise, prompting insurers to introduce usage-based offers and loyalty rebates to retain customers and maintain market share. Meanwhile, corporate buyers advocate for uniform wording in multinational programs, urging domestic markets to align with global standards to ensure consistency and compliance. This evolving segmentation fuels product innovation in Norway's property and casualty insurance market and also necessitates stricter exposure management to mitigate risks and adapt to changing demands.
Geography Analysis
Eastern Norway’s lead stems from concentrated wealth and infrastructure, but intensified stormwater events lifted 2024 building claims to USD 46.4 million, denting profitability despite scale advantages. Average house prices climbed to USD 386,295 raising sums insured and cushioning premium erosion from discounting. Digital adoption is highest here, enabling insurers to roll out AI-driven customer journeys that shorten quote time to minutes, yet also exposing them to relentless price comparison in the Norway property and casualty insurance market.
Western Norway’s 4.33% CAGR mirrors its economic diversification into renewables and maritime technology. Bergen anchors a cluster of engineering firms that purchase wrap-around project covers, while coastal municipalities finance elevation defenses that heighten property values and require protection levels. Frequent Atlantic storms sharpen demand for loss-prevention audits, allowing carriers to upsell risk-engineering services.
Northern Norway faces a sparse population but outsized catastrophe severity from polar lows and icing. Specialized hull and cargo covers for Arctic shipping generate modest premiums yet large tail-risk loads. Government grants for climate-resilient infrastructure spur contractors to source builders' insurance locally, widening the regional footprint of the Norway property and casualty insurance market. Central tech corridors around Trondheim draw liability and cyber demand, whereas Southern counties see stable agriculture lines tied to cooperative processing facilities.
Competitive Landscape
The top five insurers indicate moderate concentration. As digital challengers ramp up rate competition, 2024 sees one-quarter of customers either re-quoted or switching, diminishing the renewal uplift for incumbents. This shift highlights the growing influence of digital players in reshaping customer behavior and market dynamics. In response to this pressure, industry leaders are automating straightforward policies and channeling those savings into innovative claims solutions, like using aerial imagery for flood assessments. These advancements improve operational efficiency and also enhance the accuracy and speed of claims processing.
Strategic partnerships proliferate: Gjensidige’s global delivery model unlocked recurrent savings channeled into mobile self-service upgrades, while SpareBank 1 integrates risk-prevention content into banking apps to drive cross-selling. Mid-tier specialist Protector Forsikring scales in the municipal property, while niche mutuals focus on the marine hull, where local expertise trumps volume. Foreign entrants eye liberalized ownership rules pending EFTA appeal outcomes, signaling prospective M&A that could alter the fabric of the Norway property and casualty insurance market.
White-space opportunities reside in green-building insurance, parametric storm covers, and data-driven SME bundles. Carriers that master climate scenario modeling and embed real-time data into pricing engines are positioned to defend profitability even as statutory and supervisory demands rise. In this setting, brand trust, fast claims, and risk-reduction services emerge as decisive retention levers.
Norway Property and Casualty Insurance Industry Leaders
Gjensidige Forsikring ASA
If Skadeforsikring
Tryg Forsikring
Fremtind Forsikring AS
SpareBank 1 Forsikring AS
- *Disclaimer: Major Players sorted in no particular order

Recent Industry Developments
- December 2024: EIOPA stress-test results showed Norwegian solvency ratios falling to 123.3% under severe climate scenarios, underscoring higher capital needs.
- November 2024: Gjensidige agreed with PA Consulting on a global delivery model to fund customer-centric digital upgrades.
- April 2024: New sustainability reporting rules took effect, mandating detailed climate-risk disclosure for insurers.
- March 2024: Statistics Norway cut mandatory mortgage down-payments to 10% effective 2025, potentially boosting first-time home-buyer insurance uptake.


Research Methodology Framework and Report Scope
Market Definitions and Key Coverage
Our study views Norway's property and casualty insurance market as the aggregate annual gross written premiums generated by licensed insurers for motor, property, liability, accident, and niche marine or transport covers written within Norway's borders and retained onshore after re-insurance cessions. Claims run-off reserves, investment income, and life or health contracts are outside this scope.
Scope exclusion: credit life, health top-ups, and all captive re-insurance flows remain out of scope.
Segmentation Overview
- By Product Type
- Property
- Motor
- Liability
- Accident & Health
- Marine, Aviation & Transport
- Other Niche Covers
- By Distribution Channel
- Direct
- Agency / Broker
- Banks
- Digital Aggregators
- Affinity Partnerships
- Others
- By Customer Type
- Individual
- Commercial & Industrial
- Public Sector
- By Region
- Eastern Norway
- Western Norway
- Southern Norway
- Central Norway
- Northern Norway
Detailed Research Methodology and Data Validation
Primary Research
Mordor analysts interview underwriting managers, finance chiefs at regional carriers, leading broker principals, and motor dealer finance heads across Oslo, Bergen, Trondheim, and rural districts. Conversations probe new-business volumes, average sum insured, and expected catastrophe loadings, allowing us to cross-check desk findings and refine retention, commission, and expense assumptions.
Desk Research
We first review public filings from the Norwegian FSA, Statistics Norway's quarterly non-life accounts, and Finans Norge's premium dashboards, which show segment splits and loss ratios. Industry papers from Insurance Europe, Nordic Natural Perils Pool circulars, and the European Environment Agency illuminate regulatory shifts and climate loss patterns. Company 10-Ks, investor decks, and Oslo Stock Exchange disclosures enrich pricing and expense assumptions. Licensed databases such as D&B Hoovers and Dow Jones Factiva supply historical premium trends and news on tariff moves. This list is illustrative; many additional open data portals and academic journals are also interrogated for validation and context.
Market-Sizing & Forecasting
A top-down reconstruction converts regulator-reported earned premiums into 2024 market value, then adjusts for ceded re-insurance, policy cancellations, and premium rebates. Results are stress-tested with selective bottom-up views that multiply sampled average premium per motor policy, household count, commercial property stock, and liability take-up rates. Key variables include new vehicle registrations, house price index, storm-loss frequency, consumer disposable income, and central-bank policy rate, each carrying a documented coefficient. Forecasts employ multivariate regression with ARIMA overlays to capture cyclical motor renewal patterns and weather-driven property spikes, while scenario analysis gauges electric-vehicle penetration and climate adaptation spending. Any residual gaps in bottom-up estimates are filled using weighted averages from expert interviews.
Data Validation & Update Cycle
Before sign-off, our model output is reconciled against aggregate solvency returns, broker channel checks, and natural peril pool exposure totals. Variances exceeding preset thresholds trigger iterative review by a second analyst and a sector lead. Reports refresh on an annual calendar; mid-cycle updates are issued when regulation, macro shocks, or catastrophe losses move premiums materially. A fresh data sweep is completed just before delivery so clients receive the most current view.
Why Mordor's Norway Property And Casualty Insurance Baseline Commands Reliability
Published estimates often diverge because firms differ on policy classes, currency translation points, and how they annualize short-tail covers.
Key gap drivers include narrow motor-only scopes used by some publishers, aggressive straight-line premium growth assumptions that ignore Norway's tightening natural peril deductibles, and static average-selling-price models that overlook electric-vehicle discounts. Mordor's numbers rest on full-class coverage, quarterly refresh cadence, and variable-level forecasting, which together reduce bias from one-off catastrophe years and tariff cycles.
Benchmark comparison
| Market Size | Anonymized source | Primary gap driver |
|---|---|---|
| USD 11.02 B (2025) | Mordor Intelligence | - |
| USD 9.5 B (2024) | Regional Consultancy A | Excludes liability pools and converts NOK using prior-year FX rate |
| USD 8.1 B (2022) | Trade Journal B | Relies on five-year straight-line CAGR without catastrophe adjustments |
| USD 6.1 B (2023) | Global Consultancy A | Motor and property only, omits smaller niche covers and broker fees |
The comparison shows that scope breadth, refresh rhythm, and variable selection materially shape reported values. By anchoring estimates to regulator data, on-ground interviews, and transparent gap checks, Mordor delivers a balanced, reproducible baseline that decision-makers can trust.


Key Questions Answered in the Report
What is the current size of the Norway property and casualty insurance market?
The Norway property and casualty insurance market size is USD 11.32 billion in 2026 and is forecast to reach USD 12.96 billion by 2031.
Which product line dominates the Norway property and casualty insurance market?
Motor insurance leads with 37.15% of market revenue, supported by mandatory liability coverage.
Why is property insurance the fastest-growing segment?
Intensifying climate events and rising real-estate values are driving a 4.28% CAGR for property lines as owners seek higher sums insured and resilience services.
How are digital aggregators changing distribution dynamics?
Aggregators deliver price transparency and low-touch sales journeys, growing at 6.12% CAGR and pressuring traditional direct channels to enhance digital experiences.
What regulatory trends will shape the market through 2031?
Solvency-II climate stress testing, stricter disclosure rules, and Natural Perils Pool reforms will raise capital needs and shift the pricing of catastrophe exposures.
What is driving commercial segment growth?
Businesses are purchasing cyber add-ons and climate-adaptation covers, propelling a 4.52% CAGR in commercial and industrial premiums.
Page last updated on:


