Market Overview
| Study Period | 2020 - 2030 |
|---|---|
| Forecast Data Period | 2025 - 2030 |
| Historical Data Period | 2020 - 2023 |
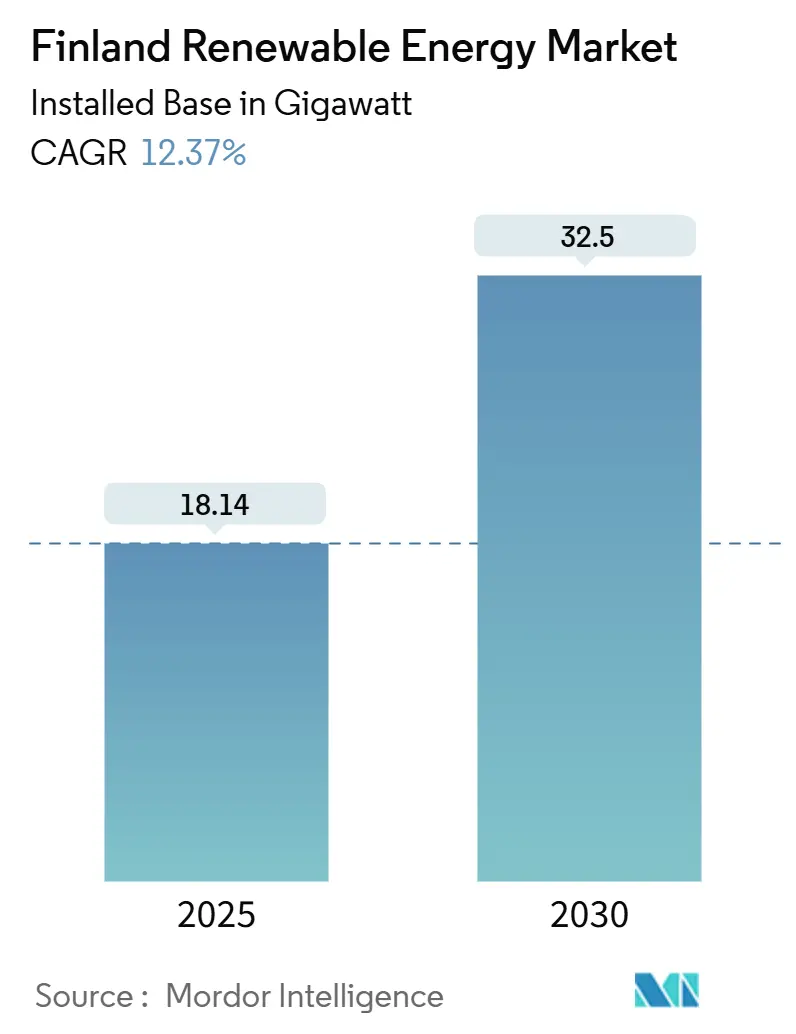
| Market Volume (2025) | 18.14 gigawatt |
| Market Volume (2030) | 32.5 gigawatt |
| Growth Rate (2025 - 2030) | 12.37% CAGR |
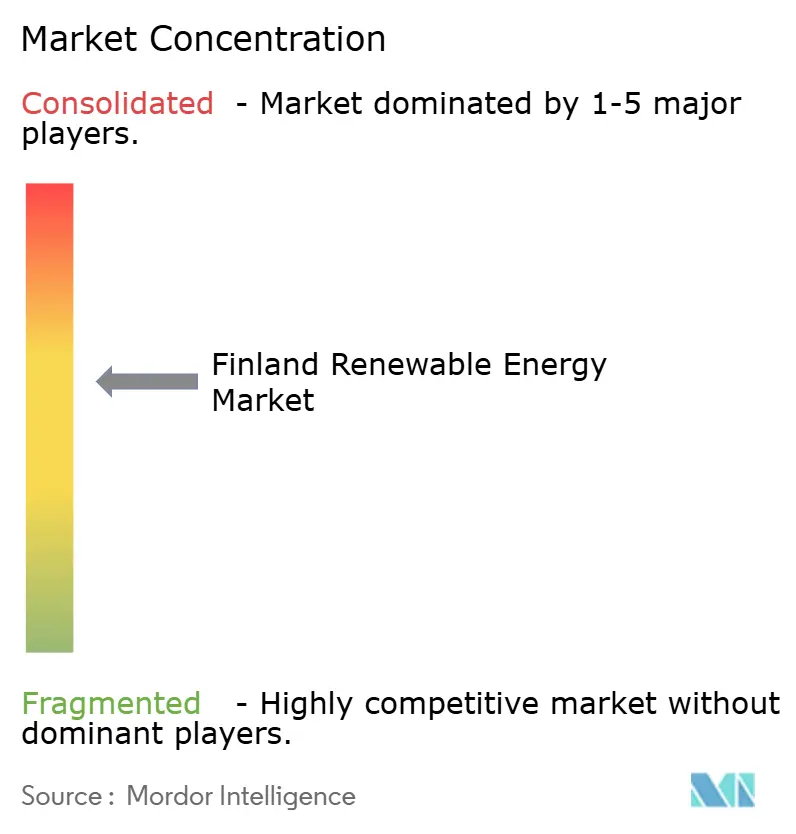
| Market Concentration | Medium |
Major Players*Disclaimer: Major Players sorted in no particular order Image © Mordor Intelligence. Reuse requires attribution under CC BY 4.0. | |
Finland Renewable Energy Market Analysis by Mordor Intelligence
The Finland Renewable Energy Market size in terms of installed base is expected to grow from 18.14 gigawatt in 2025 to 32.5 gigawatt by 2030, at a CAGR of 12.37% during the forecast period (2025-2030).
Wind's dominance continues, yet the structural rise of vertical bifacial photovoltaics, battery-coupled wind farms, and hydrogen-linked offtake agreements is accelerating diversification. Finland's 2035 carbon-neutrality statute, tighter EU Fit-for-55 milestones, and the updated 62% renewable-electricity target for 2030 are catalyzing investment, while industrial electrification is pushing national demand toward 126 TWh by 2030. Corporate power-purchase agreements (PPAs) signed by hyperscale data centers and battery-chemicals manufacturers are compressing merchant margins, encouraging developers to co-locate storage for price arbitrage. Transmission upgrades worth EUR 4 billion will alleviate north-to-south congestion; however, short-term curtailment risk remains high in Ostrobothnia and Lapland. Offshore wind's slow permitting cycle and growing scrutiny of forest biomass are steering capital toward onshore wind, solar, and hybrid configurations, reinforcing the near-term expansion path of Finland's renewable energy market.
Key Report Takeaways
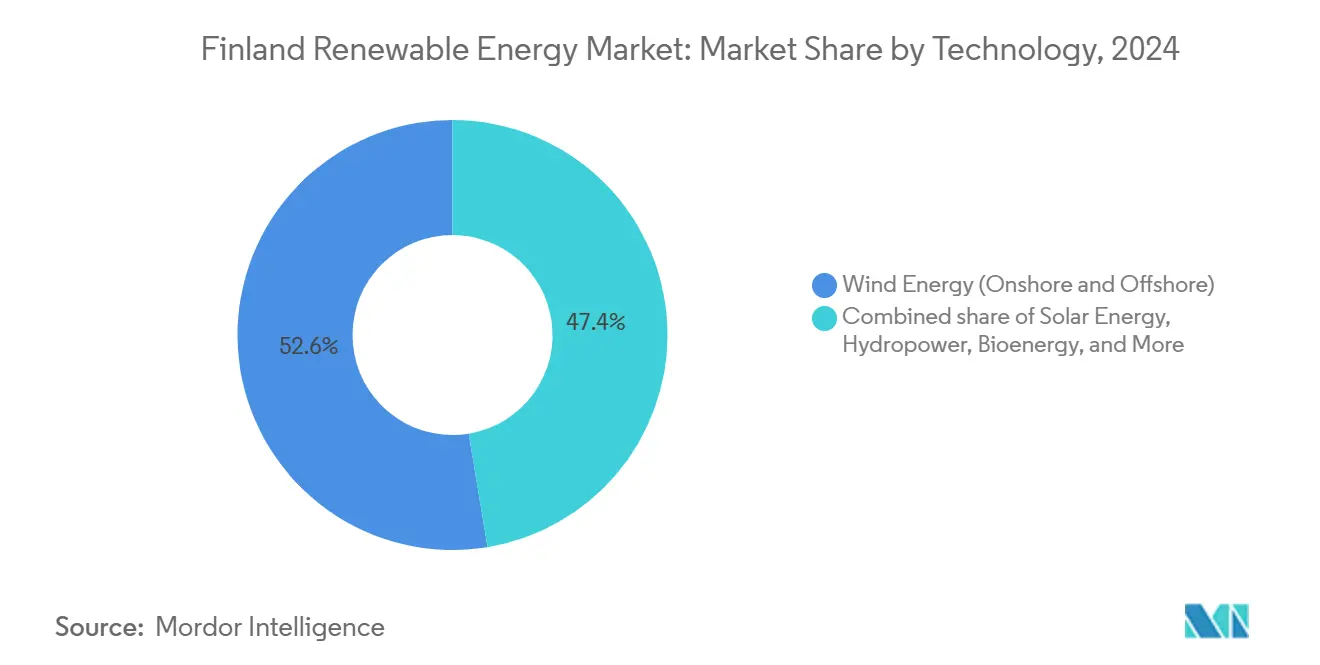
- By technology, wind energy led the Finnish renewable energy market with a 52.6% share in 2024, and solar energy is projected to expand at a 33.8% CAGR through 2030.
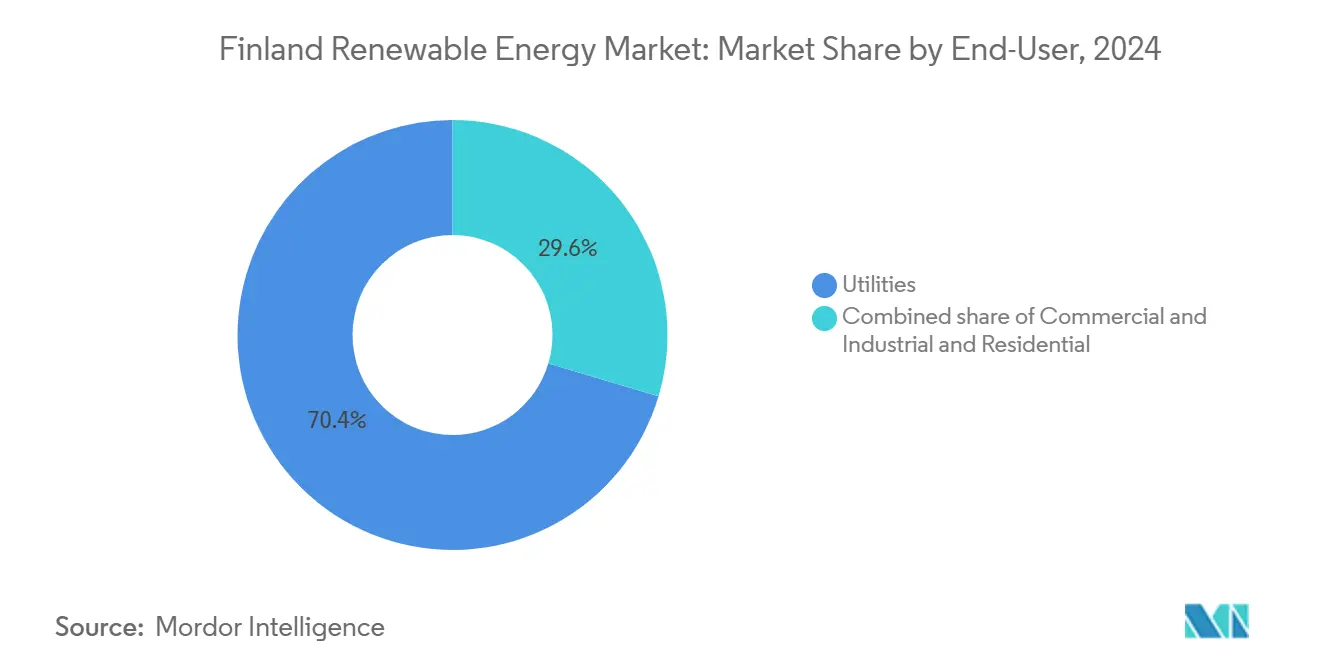
- By end-user, utilities controlled 70.4% of capacity in 2024, while the commercial and industrial segment is projected to advance at a 15.3% CAGR through 2030.
Finland Renewable Energy Market Trends and Insights
Drivers Impact Analysis*
| Driver | (~) % Impact on CAGR Forecast | Geographic Relevance | Impact Timeline |
|---|---|---|---|
| Grid-balancing demand from Finland's fast-growing wind fleet | +2.50% | National, concentrated in Ostrobothnia and Lapland wind zones | Medium term (2-4 years) |
| Corporate PPA boom led by data-center and battery-chemicals projects | +3.00% | National, with clusters in Southern Finland (data centers) and cross-border links to Northern Sweden | Short term (≤ 2 years) |
| EU Fit-for-55 funding channeled to Finnish hydrogen valleys | +2.00% | National, early gains in Kokkola and Raahe industrial hubs | Long term (≥ 4 years) |
| Hybrid wind-plus-BESS projects cutting curtailment losses | +1.50% | National, highest impact in Ostrobothnia and Lapland high-wind regions | Medium term (2-4 years) |
| Rapid uptake of vertical bifacial PV in high-latitude buildings | +1.00% | National, urban concentration in Helsinki, Turku, Tampere metropolitan areas | Medium term (2-4 years) |
| Source: Mordor Intelligence | |||
Grid-balancing demand from Finland's fast-growing wind fleet
Finland connected 491 MW of wind power in Q1 2024, increasing its total wind capacity to 9.5 GW and amplifying its frequency-control needs. Fingrid expanded reserve procurement volumes 40% over 2023, creating a monetizable revenue stream for fast-ramping assets. Curtailment pressure is greatest where the wind resource is strongest; Ostrobothnia and Lapland host 65% of active inquiries yet face curtailment clauses that exceed 10% of their annual output. Developers now routinely pair 100 MW to 300 MW wind farms with 20 MW to 50 MW batteries to self-balance and gain priority in grid-connection queues. The energy regulator has confirmed that connection permits will increasingly favor projects with built-in grid-support functionality.[1]Energy Authority, “Renewables Deployment Report 2024,” energiateollisuus.fi
Corporate PPA boom led by data-center & battery-chemicals projects
Microsoft and Google have PPA commitments exceeding 500 MW of Finnish wind since 2024, locking in long-tenor fixed-price contracts that bypass wholesale volatility. These 10- to 15-year deals trim equity return hurdles by up to 300 basis points. Northvolt’s Skellefteå facility sources 1.2 TWh per year of Finnish-Swedish wind energy, equivalent to approximately 7% of Finland’s 2024 renewable energy output, underscoring industrial demand. Mid-tier manufacturers such as Faerch are following suit with solar PPAs, widening the offtaker pool. Competition for utility-scale renewable supply is squeezing merchant windows and rewarding developers who secure off-balance-sheet corporate offtake early in the project cycle.
EU Fit-for-55 funding channelled to Finnish hydrogen valleys
The Innovation Fund awarded EUR 600 million to hydrogen consortia in 2024, earmarking Kokkola and Raahe as flagship valleys. National targets of 200 MW of electrolyzer capacity by 2025 and 1 GW by 2030 position Finland to provide 10% of the EU's green hydrogen by 2030. P2X Solutions brought a 20 MW plant online in February 2025, providing up-regulation services during wind surpluses and monetizing potential curtailment. Cross-border studies with Sweden for a 500 km hydrogen corridor to Luleå add optionality for Finnish electrolyzers. Elevated electrolyzer CAPEX still demands sustained subsidy support and high EU carbon prices to preserve investor returns.
Hybrid wind-plus-BESS projects cutting curtailment losses
Curtailment averaged 8% of potential wind output in 2024, translating to 700 GWh and EUR 35 million of lost revenue.[2]Fingrid, “Market Balancing Services,” fingrid.fi Battery-coupled wind has reduced curtailment to below 3% by shifting surplus energy to evening peaks when prices rise by 40%-60%. Ilmatar and Taaleri target an internal rate of return of at least 10% on hybrids combining 150 MW-200 MW of wind with 30 MW-40 MW of two-hour batteries. In November 2024, grid-fee reforms imposed time-of-use penalties on low-priced injections, intensifying the economic case for storage. Falling LFP battery costs, now EUR 150-180 per kWh, strengthen this trend.
Restraints Impact Analysis*
| Restraint | (~) % Impact on CAGR Forecast | Geographic Relevance | Impact Timeline |
|---|---|---|---|
| Grid-connection queue bottlenecks in Ostrobothnia and Lapland | -1.50% | Regional, concentrated in Ostrobothnia and Lapland wind zones | Short term (≤ 2 years) |
| Lengthy offshore wind seabed leasing tender cycles | -1.00% | National, Gulf of Bothnia and Baltic Sea coastal zones | Long term (≥ 4 years) |
| Rising opposition to forest biomass use amid biodiversity goals | -0.80% | National, strongest in Southern and Central Finland forestry regions | Medium term (2-4 years) |
| Source: Mordor Intelligence | |||
Grid-connection queue bottlenecks in Ostrobothnia & Lapland
Fingrid logged 367 GW of production inquiries in Q1 2024, dwarfing Finland’s installed base. Waiting times can exceed five years because 400 kV corridors and substations need environmental reviews, land acquisition, and a limited engineering workforce. The Lowlands Line will not be partially ready until 2027-2028, leaving 3 GW of consented wind in limbo. Developers with early queue positions enjoy valuation premiums, while late entrants face connection terms that are heavily curtailed or must migrate to lower-resource regions.
Lengthy offshore wind seabed leasing tender cycles
The Exclusive Economic Zone Act took effect in January 2025; however, the first leasing rounds will not open until late 2025, which will delay commissioning until 2029 or later.[3]Finnish Government, “Exclusive Economic Zone Act 2025,” valtioneuvosto.fi Initial tenders cover shallow water within 30 km of shore, capping near-term capacity at 2-3 GW and relegating floating concepts to the post-2030 window. Supply-chain gaps in turbine vessels and subsea cable production add further drag, keeping offshore outside the 2030 renewables mix.
*Our forecasts treat driver/restraint impacts as directional, not additive. The impact forecasts reflect baseline growth, mix effects, and variable interactions.
Segment Analysis
By Technology: Wind Dominates While Solar Surges On Bifacial Gains
Wind provided 52.6% of capacity in 2024, underscoring decades of favorable policy and onshore levelized costs below EUR 30 per MWh. Onshore remains the sole operating wind segment, as offshore awaits the commencement of leasing. The Finnish renewable energy market size for wind will expand steadily, albeit at a moderated pace, as grid queues lengthen. Solar, starting from around 1 GW, is set for a 33.8% CAGR, the fastest among technologies, propelled by vertical bifacial modules that exploit snow albedo and falling module prices.
Modernization of the 3.3 GW hydropower fleet will add marginal gains through turbine upgrades and digital optimization. Bioenergy’s 25% share faces growth stagnation as revised EU directives question carbon neutrality, keeping its CAGR near 2%. Geothermal and ocean energy remain negligible, limited to pilot projects, and are unlikely to materially influence the Finnish renewable energy market before 2030. Hence, more than 90% of incremental gigawatts will stem from wind and solar additions, with co-located storage smoothing dispatch profiles.


By End-User: Utilities Dominate, C&I Capacity Accelerates On PPA Appetite
Utilities held 70.4% of renewable capacity in 2024, primarily through ownership of legacy hydro and nuclear baseload facilities, as well as most gigawatt-scale wind farms. Their strong balance sheets support multiyear development pipelines and long-dated PPAs. Nevertheless, the commercial and industrial segment is expanding at a 15.3% CAGR as data centers, battery-chemical plants, and mid-tier manufacturers secure renewable supply to meet their Science-Based Targets.
Data centers alone consumed 8% of Finland’s power in 2024, and hyperscalers have contracted over 500 MW of wind output. Battery-materials producers, led by Northvolt, secure multi-TWh offtake for Scope 2 compliance. Residential uptake remains below 5% of capacity because the dispersed housing stock and the absence of net-metering extend paybacks past eight years. Virtual power plant pilots in Helsinki demonstrate technical feasibility, but await regulatory incentives. Consequently, utilities and large industrial offtakers will continue to dominate the Finnish renewable energy market, while residential growth remains subdued.
Geography Analysis
Northern and western coastal zones dominate generation. Ostrobothnia hosts 45% of operational wind capacity, leveraging steady maritime wind and access to Swedish interconnectors. Lapland contributes 25% but endures five-year connection waits until the corridor upgrades are finished. Southern Finland, including Helsinki, Turku, and Tampere, consumes over 50% of the electricity yet produces less than 20% of its own renewable energy, relying on north-south power flows backed by EUR 4 billion in grid expansion.
The Gulf of Bothnia and Baltic Sea will open for offshore wind only after leasing starts in late 2025, pushing first output past 2029. Kokkola and Raahe hydrogen valleys will anchor 1 GW of co-located wind and solar by 2030, decoupling local industries from spot markets and enabling new long-term offtake structures.[4]European Commission, “REPowerEU Hydrogen Valleys,” europa.eu The geography of the Finland renewable energy market is bifurcating into resource-rich export zones in the north-west and demand-heavy urban centers in the south, reinforcing the criticality of transmission investments and storage deployments.
Competitive Landscape
Market concentration is moderate. Incumbents Fortum, Helen, and Vattenfall still control about 60% of installed capacity, but independent power producers such as OX2, Ilmatar, and Taaleri have dominated new wind additions since 2020. Competitive edge hinges on securing early grid queue positions and integrating storage. OX2’s 455 MW Pjelax-Böle site reduced turbine count 30% by employing 5.6-6.2 MW machines, trimming balance-of-plant costs, and boosting project returns. Smaller entrants, such as Neoen and VSB, pursue sub-100 MW projects in uncongested zones to bypass long waits, accepting slightly lower capacity factors.
Patent activity is rising in bifacial PV mounting systems, with 12 Finnish filings in 2024 alone.[5]European Patent Office, “Bifacial PV Mounting Patents 2024,” epo.org Hybrid wind-BESS is emerging as the principal differentiator as grid-fee reforms reward flexibility. Developers lacking storage or corporate offtake pipelines face margin compression as merchant revenue erodes. Overall, technological integration, offtake origination, and grid-access priority define competitive positioning in the Finland renewable energy market.
Finland Renewable Energy Industry Leaders
Fortum Oyj
Pohjolan Voima Oyj
Vattenfall AB
ABO Wind AG
SGS AG
- *Disclaimer: Major Players sorted in no particular order

Recent Industry Developments
- June 2025: Developer Ilmatar and investor Nuveen Infrastructure have put a 30MW/41MWh BESS in northern Finland into commercial operation. The companies have commissioned the 1.36-hour Ainola battery energy storage system (BESS) project at the Piiparinmäki wind farm in the North Ostrobothnia region.
- May 2025: Sungrow has deployed a 60 MWh battery energy storage system (BESS) in Simo, Finland, located less than 100 kilometers south of the Arctic Circle. This project, one of the northernmost of its kind, aims to validate the performance of their PowerTitan battery system in extreme cold climates and enhance grid stability.
- March 2025: Fortum concluded a nuclear feasibility study and has subsequently signed framework agreements with EDF and GE-Hitachi. The study focused on the potential for new nuclear power projects in Finland and Sweden, exploring both large conventional reactors and small modular reactors (SMRs).
- February 2025: The European Commission has approved a €2.3 billion Finnish scheme to support investments in strategic sectors and help industries decarbonize, with a focus on hydrogen valleys. This scheme is part of a broader effort to boost green industrial development and transition towards a climate-neutral economy.


Finland Renewable Energy Market Report Scope
Renewable energy is derived from natural sources that replenish faster than they are consumed, such as sunlight, wind, water, geothermal heat, and biomass. These resources are considered inexhaustible and are used to generate electricity, heat, and fuel, typically resulting in a lower carbon footprint and reduced environmental impact compared to fossil fuels.
The Finnish Renewable Energy Market is segmented by technology and end-user. By technology, the market is segmented into Solar Energy (PV and CSP), Wind Energy (Onshore and Offshore), Hydropower (Small, Large, and PSH), Bioenergy, Geothermal, and Ocean Energy (Tidal and Wave). By end user, the market is segmented into Utilities, Commercial and Industrial, and Residential. The report also covers the market size and forecasts for Finland.
For each segment, market sizing and forecasts have been conducted based on installed capacity (GW).
By Technology
| Solar Energy (PV and CSP) |
| Wind Energy (Onshore and Offshore) |
| Hydropower (Small, Large, PSH) |
| Bioenergy |
| Geothermal |
| Ocean Energy (Tidal and Wave) |
By End-User
| Utilities |
| Commercial and Industrial |
| Residential |
| By Technology | Solar Energy (PV and CSP) |
| Wind Energy (Onshore and Offshore) | |
| Hydropower (Small, Large, PSH) | |
| Bioenergy | |
| Geothermal | |
| Ocean Energy (Tidal and Wave) | |
| By End-User | Utilities |
| Commercial and Industrial | |
| Residential |


Key Questions Answered in the Report
How large is Finland’s renewable installed base in 2025?
It reached 18.14 GW, and the Finland renewable energy market size is projected to expand to 32.50 GW by 2030.
Which technology adds the most new capacity through 2030?
Onshore wind continues to add the bulk of gigawatts, but solar posts the highest 33.8% CAGR.
Why are battery systems paired with wind projects?
Hybrid wind-plus-storage cuts curtailment from 8% to below 3% and enables projects to earn higher evening peak prices.
When will offshore wind meaningfully contribute?
First seabed leases open in late 2025, meaning operational output is unlikely before 2029.
What drives corporate demand for Finnish renewables?
Data centers and battery-materials plants sign long PPAs to meet Scope 2 decarbonization targets and hedge energy costs.
Page last updated on:


