Ferrosilicon Market Size and Share
Market Overview
| Study Period | 2021 - 2031 |
|---|---|
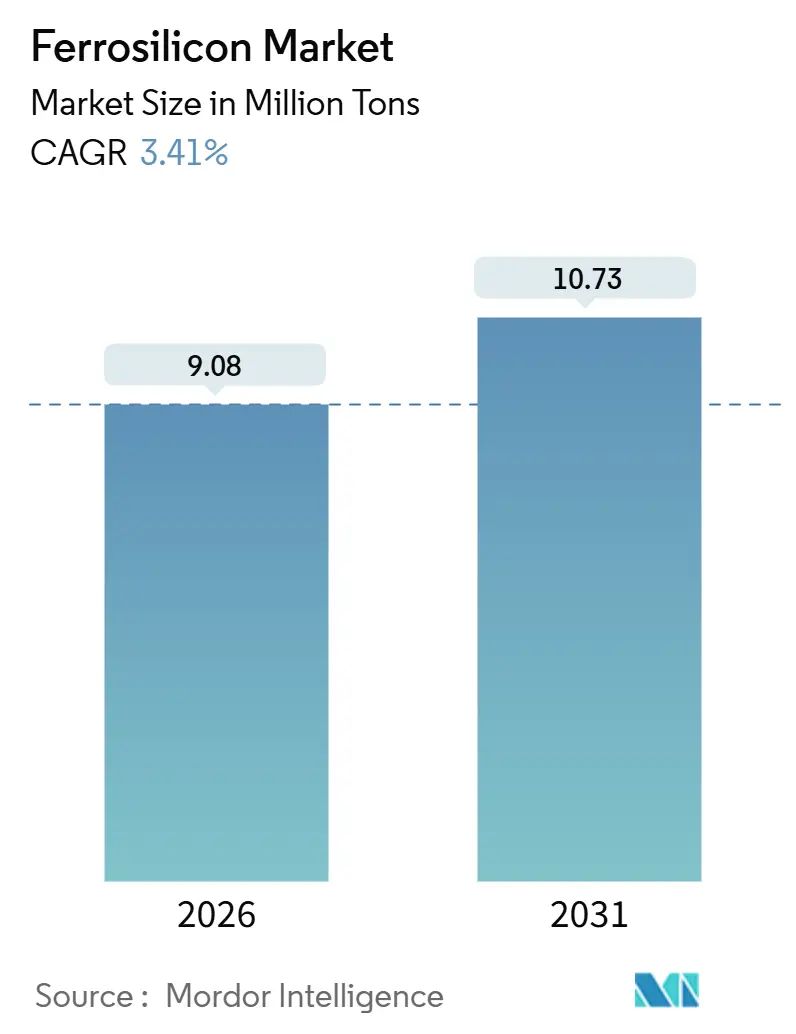
| Market Volume (2026) | 9.08 Million tons |
| Market Volume (2031) | 10.73 Million tons |
| Growth Rate (2026 - 2031) | 3.41% CAGR |
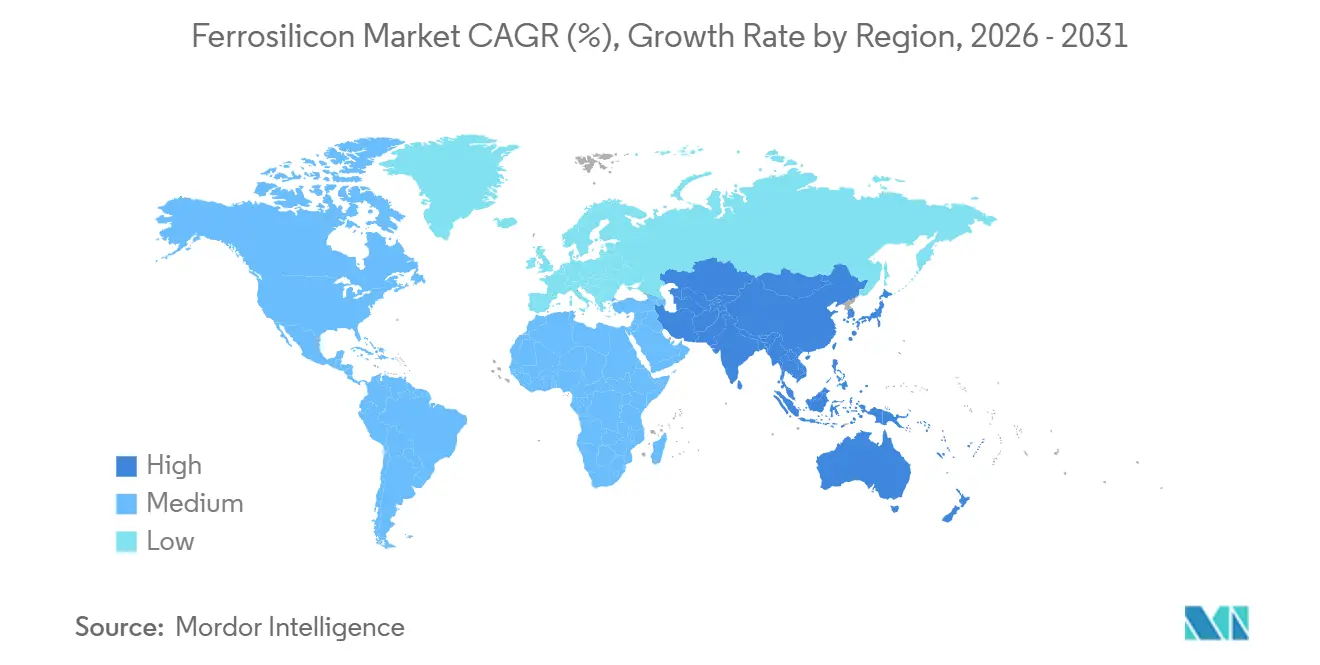
| Fastest Growing Market | Asia Pacific |
| Largest Market | Asia Pacific |
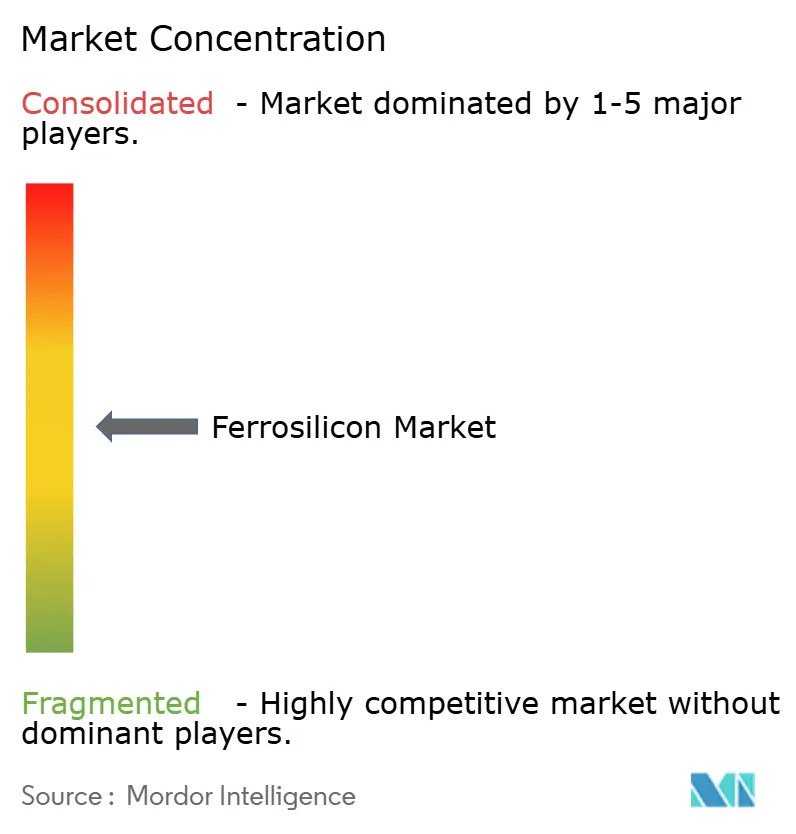
| Market Concentration | Medium |
Major Players *Disclaimer: Major Players sorted in no particular order Image © Mordor Intelligence. Reuse requires attribution under CC BY 4.0. | |
Ferrosilicon Market Analysis by Mordor Intelligence
The Ferrosilicon Market size is estimated at 9.08 million tons in 2026 and is expected to reach 10.73 million tons by 2031, at a CAGR of 3.41% during the forecast period (2026-2031). This steady expansion rests on four interlocking forces. First, steelmakers are retrofitting basic-oxygen and electric-arc furnaces to run higher-silicon blends that improve ladle metallurgy yields. Second, photovoltaic manufacturers increasingly divert submerged-arc-furnace capacity toward metallurgical-grade silicon, intensifying raw-material pull at times of buoyant solar demand. Third, atomized powders made from ferrosilicon are gaining favor in lithium-spodumene and iron-ore dense-media-separation circuits because lower viscosity cuts media losses, streamlining mining costs. Finally, policy-driven infrastructure outlays in the United States and India, combined with hydrogen-ready direct-reduced-iron projects in the Middle East and Europe, anchor a visible pipeline of alloy offtake for the next decade.
Key Report Takeaways
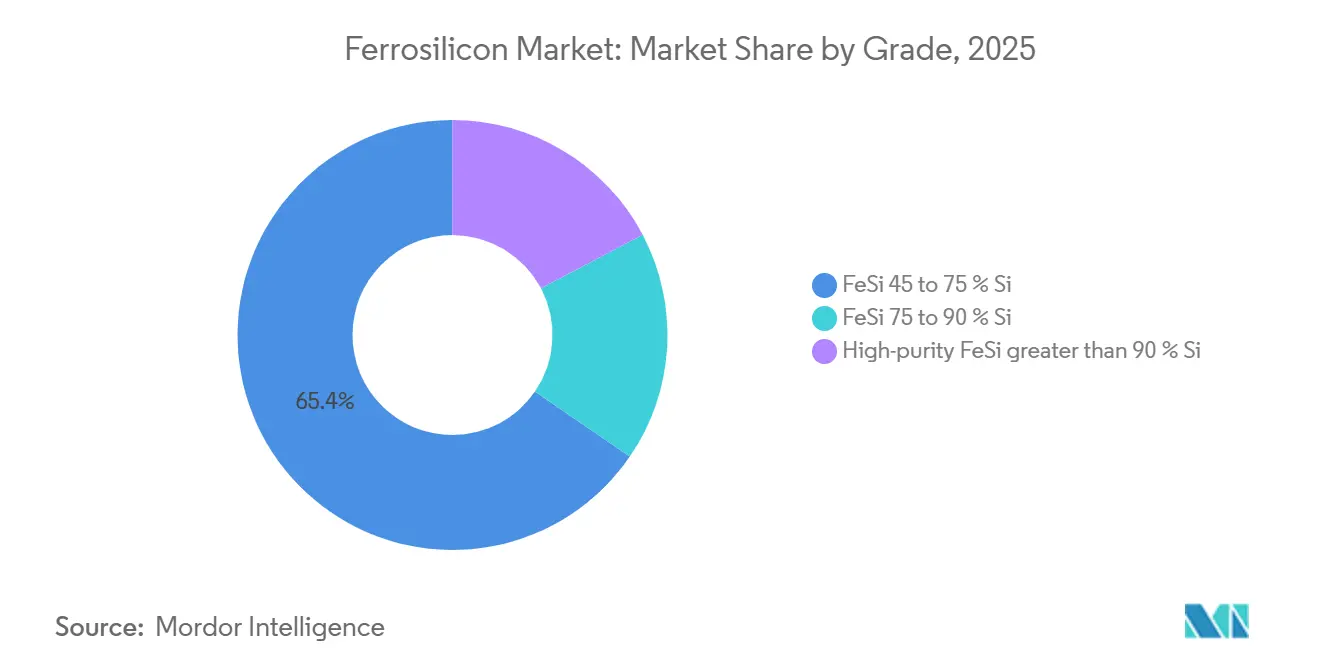
- By grade, the FeSi 45–75% segment held 65.44% of the ferrosilicon market share in 2025 and is projected to grow at a 4.06% CAGR through 2031.
- By form, lump alloys accounted for 36.71% of the ferrosilicon market size in 2025 and are advancing at a 4.17% CAGR during the forecast horizon.
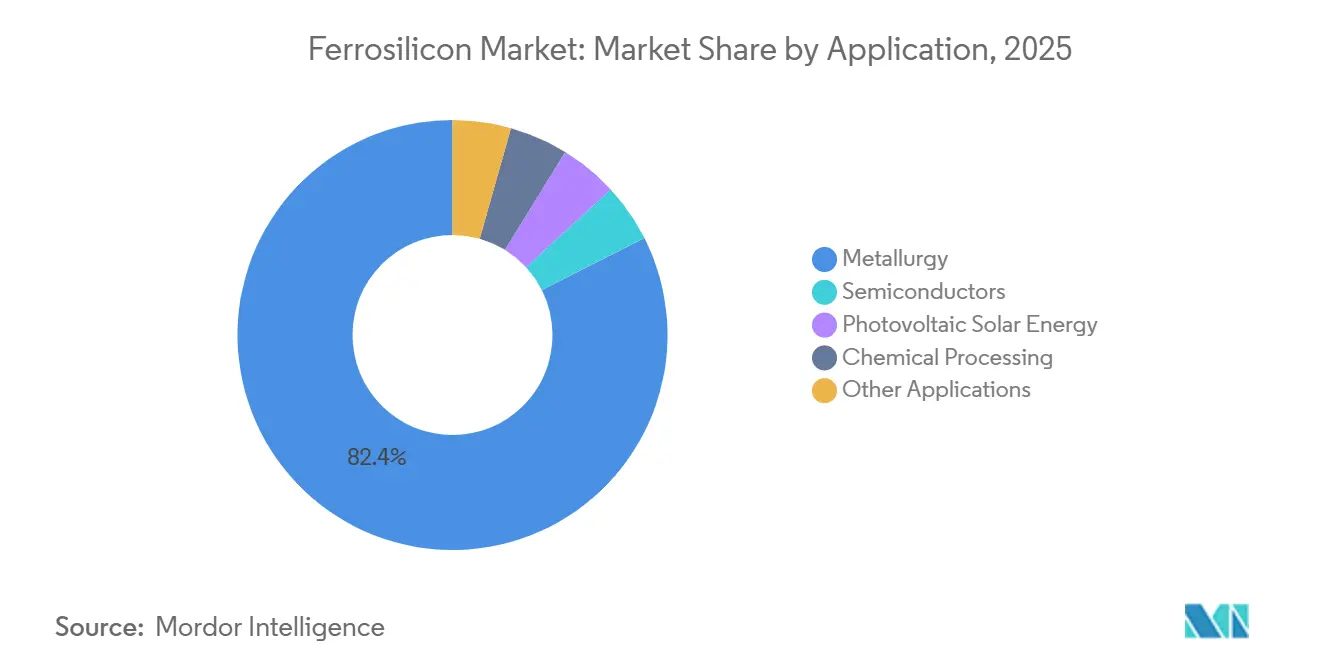
- By application, metallurgy dominated with 82.45% share of the ferrosilicon market size in 2025, while photovoltaic solar energy is expanding at the fastest 5.01% CAGR to 2031.
- By geography, Asia-Pacific led with 58.81% ferrosilicon market share in 2025; the region is forecast to post a 4.53% CAGR through 2031.
Note: Market size and forecast figures in this report are generated using Mordor Intelligence’s proprietary estimation framework, updated with the latest available data and insights as of January 2026.
Global Ferrosilicon Market Trends and Insights
Drivers Impact Analysis*
| Drivers | (~) % Impact on CAGR Forecast | Geographic Relevance | Impact Timeline |
|---|---|---|---|
| Rising steel-capacity additions across the Asia-Pacific | +1.2% | China, India, South Korea, ASEAN | Medium term (2–4 years) |
| Electrification spurring electrical-steel demand for EV motors | +0.8% | Global, with early gains in China, EU, North America | Long term (≥4 years) |
| Infrastructure stimulus in North America and India | +0.6% | United States, Canada, India | Short term (≤2 years) |
| Hydrogen-ready DRI mills adopting higher-Si alloy blends | +0.5% | MENA, Australia, EU (pilot scale); spillover to APAC | Long term (≥4 years) |
| Growth of dense-media recycling using atomised FeSi powders | +0.4% | Australia, South Africa, Chile (lithium/iron ore hubs) | Medium term (2–4 years) |
| Source: Mordor Intelligence | |||
Rising Steel-Capacity Additions Across Asia-Pacific
Between 2025 and 2027, OECD data reveals plans for new steelmaking capacity, with a significant portion concentrated in the Asia-Pacific region. In fiscal 2025, India’s finished-steel capacity surpassed expectations. India's zero-import-duty policy on ferrous scrap, coupled with a Production-Linked Incentive scheme for specialty steel, is driving heightened demand for deoxidizers at its integrated mills. While China aims for annual growth in crude steel through 2026, energy restrictions in Inner Mongolia and Ningxia have led to intermittent shutdowns of older coal-fired furnaces. This has pushed operators to adopt newer, energy-efficient submerged-arc units. Even as hot-rolled coil prices dipped in 2024, steelmakers maintained the use of ferrosilicon per ton of crude steel, stabilizing baseline consumption. Consequently, the region sees an increase in medium-grade alloy demand.
Electrification Spurring Electrical-Steel Demand for EV Motors
Electrical steel, an iron-silicon sheet with silicon content, is deemed critical for traction motors by the U.S. Department of Energy. Each battery electric vehicle (EV) requires laminations made from this material[1]U.S. Department of Energy, “Solar Supply Chain Review 2025,” ENERGY.GOV . In anticipation of the growing EV market, POSCO, Baowu, and JFE Steel have introduced new grain-oriented and non-oriented production lines, set to ramp up by 2026. These mills are also opting for higher-purity ferrosilicon to minimize magnetic-core losses. The International Energy Agency projects a surge in global EV sales in the coming years[2]International Energy Agency, “Global EV Outlook 2025,” IEA.ORG . Additionally, as grid-transformer installations for renewable energy interconnections grow, there's a heightened demand for grain-oriented electrical steel, especially since step-up transformers depend on it. While the supply of electrical steel is concentrated in China, Japan, South Korea, and Germany, these regional hotspots experience less cyclicality compared to bulk carbon-steel uses. This stability in alloy offtake persists even when there's a downturn in construction steel.
Infrastructure Stimulus in North America and India
Through 2028, the United States, under its Bipartisan Infrastructure Law, has allocated significant funding for steel-centric projects, including bridges and rail corridors. Meanwhile, India's National Infrastructure Pipeline is set to invest heavily by 2030, with the Ministry of Steel forecasting that the sector will account for a substantial portion of the nation's steel demand by 2027. In structural grades, ferrosilicon is used as silicon boosts deoxidation efficiency and aids in manganese-silicon co-alloying. Canada, recognizing the significance of silicon metal and classifying it as a critical mineral in 2024, is exploring hydro-powered smelters in Québec and British Columbia. However, environmental approvals are pushing timelines to the early 2030s. As Mexico experiences a surge in near-shoring, driving up demand for automotive and appliance sheets, it's noteworthy that the nation relies on the U.S. and Brazil for most of its ferrosilicon, underscoring the continent's supply interdependencies.
Hydrogen-Ready DRI Mills Adopting Higher-Silicon Blends
OECD data forecasts a DRI capacity increase by 2030, yet currently, only a small percentage harness hydrogen as the reductant. Pilot plants in Sweden, Germany, and the UAE have found that hydrogen DRI yields a porous, low-carbon sponge iron. This requires electric-arc operators to boost ferrosilicon additions to reestablish silicon levels. This presents a significant new opportunity for producers in Brazil, Malaysia, and Norway, who are already marketing a low-carbon supply. While achieving cost parity with natural-gas DRI hinges on carbon prices exceeding certain thresholds, regions rich in renewable power, like the Middle East and Australia, are forging ahead, bolstered by national green-hydrogen strategies. These initiatives create early adoption pathways, sending ripples through the global ferrosilicon supply chain.
Restraints Impact Analysis*
| Restraints | (~) % Impact on CAGR Forecast | Geographic Relevance | Impact Timeline |
|---|---|---|---|
| Volatile quartzite and electricity costs | -0.3% | Global, acute in South Africa, Europe, China | Short term (≤2 years) |
| Tightening CO₂-emission regulations on smelters | -0.2% | EU (CBAM), China (dual-control), emerging in India | Medium term (2–4 years) |
| Shift to Al-Si master-alloys in auto castings | -0.1% | EU (primary impact), limited adoption in North America, Asia | Long term (≥4 years) |
| Source: Mordor Intelligence | |||
Volatile Quartzite and Electricity Costs
Producing a ton of silicon consumes significant electricity, making energy costs account for nearly half of a smelter's expenses. Due to annual Eskom tariff hikes, Glencore adjusted its furnace operations in Mpumalanga. Simultaneously, Ferroglobe had to halt operations in Spain and France, reacting to high European day-ahead electricity prices. For quartzite feedstock, a high SiO₂ content is essential. However, disruptions in the Red Sea and Panama Canal have led to a spike in shipping costs. China's dual-control policy is tightening winter electricity supplies in Inner Mongolia and Ningxia, reducing utilization rates and driving up spot alloy prices. While hydropower-abundant Norway and Paraguay present some cost relief, many smelters in regions with high tariffs find it challenging to break even, especially when ferrosilicon prices remain under pressure.
Tightening CO₂-Emission Regulations on Smelters
Submerged-arc furnaces emit significant amounts of CO₂, with the majority of emissions tied to carbonaceous reductants. Under China's 14th Five-Year Plan, a reduction in intensity is mandated by 2025. This pushes operators to retrofit waste-heat boilers and transition to partial biomass reductants. While the EU’s Carbon Border Adjustment Mechanism, set to be fully operational in 2026, doesn't explicitly mention ferrosilicon, European steelmakers are increasingly seeking low-carbon alloys to reduce embedded emissions. Elkem’s Limpio plant in Paraguay stands out, utilizing eucalyptus charcoal and hydropower, paving the way for a near-zero-scope-1 emissions pathway. Although carbon capture technology is still in its infancy, challenges arise from the low CO₂ concentration in SAF off-gas. Implementing scrubbing could inflate costs, jeopardizing market competitiveness. Meanwhile, electro-reduction in molten salt holds potential, but requires a decade of pilot testing before it can be commercialized.
*Our forecasts treat driver/restraint impacts as directional, not additive. The impact forecasts reflect baseline growth, mix effects, and variable interactions.
Segment Analysis
By Grade: Mid-Silicon Alloys Anchor Steelmaking Deoxidation
The FeSi 45–75% slice held 65.44% of 2025 volume and is forecast to expand faster than any other grade at a 4.06% CAGR. This grade integrates effortlessly into carbon-steel ladles and cast-iron inoculation, delivering high silicon recoveries without excessive heat. Chinese measures aimed at increasing crude steel production underpin incremental offtake, and India’s capacity additions amplify the pull. Standard 75% material serves electric-arc furnaces and foundries but grows more slowly because scrap-heavy melting requires less material compared to blast furnaces. High-purity grades over 90% silicon meet semiconductor and solar wafer standards; producers toggle furnaces between traditional alloy and metallurgical-grade silicon when polysilicon prices justify the switch. Pricing spreads validate that choice, giving agile smelters the margin incentive to chase solar-cycle peaks. Recycled photovoltaic silicon may eventually seed a circular supply, yet industrial-scale collection and refining infrastructure is still embryonic.


By Form: Lump Alloys Dominate Blast-Furnace Additions
Lump material captured a 36.71% share in 2025 and is on track for a 4.17% CAGR through 2031. Operators of blast furnaces and basic oxygen facilities prefer 10–50 mm granules. These granules dissolve predictably in high-temperature slag, reducing dust carry-over. According to OECD forecasts, by 2027, a majority of the world's new steel capacity will still rely on blast-furnace methods, bolstering the demand for lumps. Atomized powders fuel dense-media separation circuits in mining, where media losses can decrease significantly, leading to notable operational savings. Lithium ventures in Pilbara and Atacama, coupled with iron-ore facilities in South Africa and India, are driving increased demand for these powders. Briquettes and specialty granules, used in welding electrodes and pyrotechnics, are seeing growth parallel to industrial GDP. Freight economics play a pivotal role in material adoption: lump ferrosilicon, with high bulk densities, maximizes container load factors. In contrast, powders require anti-caking liners, inflating logistics costs.
By Application: Photovoltaic Solar Emerges as Fastest-Growing End-Use
Metallurgy retained 82.45% of 2025 volume, yet photovoltaic solar outpaces every other segment at a 5.01% CAGR. Submerged-arc furnaces, initially tailored for alloys, can swiftly adapt to produce metallurgical-grade silicon. Notably, a portion of the global MGS is now directed towards polysilicon production. Xinjiang, with its substantial share of this capacity, has drawn the attention of the U.S. and E.U., leading to domestic polysilicon plant incentives under the CHIPS Act and the European Solar Alliance. Though semiconductor applications utilize a smaller volume annually, they fetch high prices, drawing in niche players like Wacker Chemie. Chemical derivatives, notably silicone elastomers and fumed silica, consistently capture a steady market share, driven by demand from the automotive and construction sectors. Meanwhile, other applications like magnesium reduction and welding fluxes see modest growth, aligning with the broader industrial output trends, yet they don't significantly alter the supply-demand balance.
Geography Analysis
Asia-Pacific owned 58.81% of the ferrosilicon market share in 2025 and is projected to clock the highest 4.53% CAGR through 2031. Despite energy policies causing some legacy furnaces in Inner Mongolia and Ningxia to idle, China stands firm as the leading producer. India is channeling increased alloy demand to its domestic suppliers and Bhutan's Tashi Group, thanks to its specialty-steel incentive scheme and zero-duty scrap imports. Meanwhile, Japan and South Korea, collectively importing substantial quantities annually, see an added boost from POSCO’s electrical-steel expansion, potentially increasing demand further.
North America, accounting for a notable portion of global demand, saw the U.S. rely on five smelters, one of which was idled, alongside imports from Brazil, Canada, and Malaysia. Thanks to the Bipartisan Infrastructure Law, an annual uptick is anticipated as steel tonnage flows into bridge and rail projects. While Canada pushes for critical minerals and proposes hydro-powered plants (albeit with permitting delays into the 2030s), Mexico's near-shoring trend is driving up flat-steel demand for appliances and automotive. However, the region's reliance on imports for ferrosilicon underscores a significant interdependence.
Europe, with a substantial annual consumption, grapples with high power prices. While Ferroglobe has curtailed operations in Spanish and French furnaces, Norway capitalizes on hydropower to maintain competitive costs. Furthermore, Norway is channeling significant investment into a solar-grade silicon complex at Herøya. South America, primarily driven by Brazil's hydro-advantaged capacity, finds itself shipping significant quantities to both the U.S. and Europe. In the Middle East and Africa, South Africa takes center stage. However, with Eskom's tariff hikes and load-shedding challenges, capacity utilization remains restricted. Yet, there's a glimmer of hope with Saudi infrastructure projects hinting at modest incremental demand.

Competitive Landscape
The ferrosilicon market is moderately fragmented. In the atomized-powder supply for dense-media separation, opportunities arise as lower media losses lead to significant economic benefits for customers. Additionally, hydrogen-ready DRI mills emerge as a new avenue, requiring higher alloy doses per heat to adjust silicon levels in low-carbon sponge iron. Technology investments span from biocarbon substitution, already in commercial use in Paraguay, to electro-reduction in molten salt. The latter, while aiming to reduce energy consumption, is still in the laboratory phase. Meanwhile, recycling innovators are experimenting with the closed-loop recovery of end-of-life photovoltaic silicon. Their goal is to produce low-grade FeSi for foundries, achieving a targeted reduction in carbon emissions, although commercial volumes remain limited.
Ferrosilicon Industry Leaders
Ferroglobe
Elkem ASA
China Minmetals Corporation
Erdos Group
OM Holdings Ltd.
- *Disclaimer: Major Players sorted in no particular order

Recent Industry Developments
- January 2025: According to the U.S. Geological Survey's annual silicon report, ferrosilicon and silicon metal production in 2024 occurred at five facilities located primarily in the Eastern states of the United States. These facilities played a significant role in meeting domestic demand for silicon-based materials.
- February 2024: Ferroglobe, in its annual report, disclosed that its sales in 2023 amounted to USD 330.95 million. This performance highlights the company's significant role in the ferrosilicon market, potentially influencing market dynamics through its production and supply capabilities.


Research Methodology Framework and Report Scope
Market Definitions and Key Coverage
Our study defines the ferrosilicon market as the yearly output and trade of iron-silicon alloys containing 45%–90% Si that are manufactured for steel deoxidation, cast-iron inoculation, dense-media separation, and emerging photovoltaic or electrical-steel uses.
Within our scope, we exclude pure silicon metal, silicomanganese, and fabricated downstream components that do not retain ferrosilicon's alloy identity.
Segmentation Overview
- By Grade
- FeSi 45–75% Si
- FeSi 75–90% Si
- High-purity FeSi greater than 90% Si
- By Form
- Lumps
- Powder
- Briquettes and Others
- By Application
- Metallurgy
- Semiconductors
- Photovoltaic Solar Energy
- Chemical Processing
- Other Applications
- By Geography
- Asia-Pacific
- China
- India
- Japan
- South Korea
- Rest of Asia-Pacific
- North America
- United States
- Canada
- Mexico
- Europe
- Germany
- United Kingdom
- France
- Italy
- Rest of Europe
- South America
- Brazil
- Argentina
- Rest of South America
- Middle-East and Africa
- Saudi Arabia
- South Africa
- Rest of Middle-East and Africa
- Asia-Pacific
Detailed Research Methodology and Data Validation
Primary Research
We interviewed furnace operators, alloy traders, steel-mill procurement heads, and photovoltaic wafer technologists across Asia-Pacific, Europe, and the Americas. Their insights helped us lock furnace-utilization factors, typical grade splits, and regional price spreads before we finalized assumptions.
Desk Research
Our team drew on tier-1 open datasets such as the United States Geological Survey Minerals Yearbook, UN Comtrade customs codes, Eurostat PRODCOM production tables, and World Steel Association crude-steel statistics. We then layered price curves from Metal Bulletin and CRU. Company 10-Ks, investor decks, and national ferro-alloy association briefs were mined through Dow Jones Factiva, giving us plant-level capacity, contract prices, and trade actions that desk sources alone often overlook. These examples are illustrative; many other references informed data cleaning, validation, and research clarification.
Market-Sizing & Forecasting
Our top-down build starts with global crude-steel output, multiplies it by region-specific ferrosilicon intensity, and adjusts for net imports to anchor the 2025 baseline. Results are cross-checked against selective bottom-up roll-ups of active furnace capacities and sampled contract prices × volumes. Key variables like steel demand trajectories, solar-PV capacity additions, spot Si-Fe alloy prices, furnace energy costs, and the shift toward high-purity FeSi feed a multivariate regression that projects demand through 2030. When bottom-up gaps appear, three-year moving averages of intensity factors bridge them.
Data Validation & Update Cycle
Before sign-off, Mordor analysts run variance screens against independent trade reports, reconcile currency or unit anomalies, and re-contact experts if outliers persist. Reports refresh annually, with interim updates triggered by shocks such as export-duty changes or energy-price spikes, and every client delivery undergoes a last-minute data pass.
Why Mordor's Ferrosilicon Baseline Commands Reliability
Published figures differ widely because some firms quote revenue while others, like us, track physical tons.
External estimates range from USD 11.75 billion to USD 11.91 billion for 2024. Our analysts size current demand at 8.87 million tons in 2025, shielding decisions from price volatility.
Benchmark comparison
| Market Size | Anonymized source | Primary gap driver |
|---|---|---|
| 8.87 million tons (2025) | Mordor Intelligence | |
| USD 11.91 billion (2024) | Global Consultancy A | Converts tonnage to value using a single average price and folds high-purity silicon metal into scope |
| USD 11.75 billion (2024) | Industry Association B | Aggregates ferrosilicon into broader ferro-alloys, inflating the base |
| USD 10.9 billion (2023) | Regional Consultancy C | Uses conservative steel-demand growth and a static price deck |
These contrasts show that when scope, unit of measure, and refresh cadence differ, outputs drift. Mordor's grade-specific tonnage model, reinforced by live pricing inputs and yearly reviews, delivers a transparent, repeatable baseline buyers can trust.


Key Questions Answered in the Report
How large is the ferrosilicon market in 2026?
The ferrosilicon market size reached 9.08 million tons in 2026 and is projected to climb to 10.73 million tons by 2031, registering a CAGR of 3.41%.
Which region leads demand growth?
Asia-Pacific held a 58.81% share in 2025 and is expected to post the fastest 4.53% CAGR through 2031, driven by capacity ramps in China and India.
What is driving ferrosilicon use in electric vehicles?
Each battery electric vehicle needs 40–100 kg of electrical steel, an iron-silicon alloy, so rising EV sales boost demand for higher-purity ferrosilicon.
How do energy costs affect producers?
Electricity can be 50% of smelter cash costs; tariff hikes in South Africa and Europe have forced furnace curtailments and squeezed margins.
What technology trends could reshape supply?
Biocarbon reductants are commercial, while electro-reduction in molten salt aims at zero-carbon silicon but remains in early pilot phases.
Page last updated on:


