
Polymer Microspheres Market Size and Share
Market Overview
| Study Period | 2020 - 2031 |
|---|---|
| Market Size (2026) | USD 2.29 Billion |
| Market Size (2031) | USD 3.51 Billion |
| Growth Rate (2026 - 2031) | 8.92 % |
| Fastest Growing Market | Asia Pacific |
| Largest Market | Asia Pacific |
| Market Concentration | Medium |
Major Players *Disclaimer: Major Players sorted in no particular order Image © Mordor Intelligence. Reuse requires attribution under CC BY 4.0. | |
Polymer Microspheres Market Analysis by Mordor Intelligence
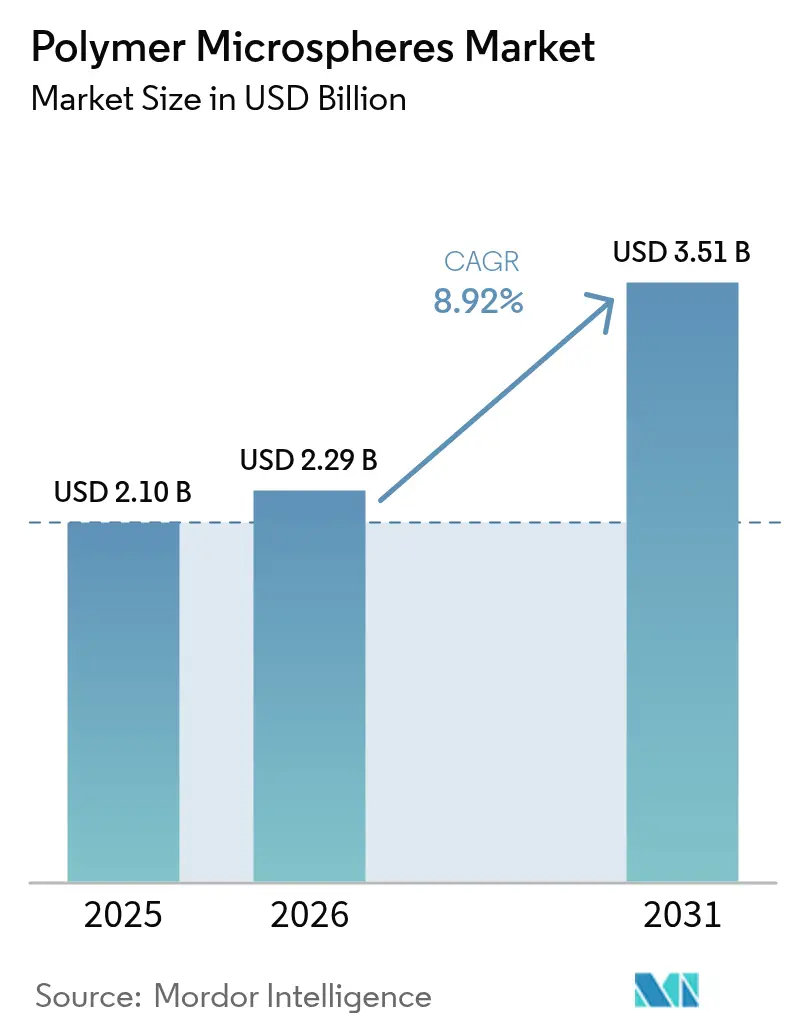
The Polymer Microspheres market size is expected to grow from USD 2.10 billion in 2025 to USD 2.29 billion in 2026 and is forecast to reach USD 3.51 billion by 2031 at 8.92% CAGR over 2026-2031. Demand accelerates as drug developers seek precision delivery systems, automotive producers intensify lightweighting programs, and additive‐manufacturing firms adopt spherical feedstocks for complex parts. Pharmaceutical formulations that exploit poly-lactic-co-glycolic acid (PLGA) and other biodegradable carriers bring price premiums that offset higher production costs. Automakers use hollow and expandable grades to cut part density, which supports emissions and electrification targets. Electronics assemblers specify thermally conductive variants for advanced packaging, while 3-D printing service bureaus purchase narrow-cut powders that ensure consistent layer deposition. On the supply side, bio-based innovations reposition incumbent producers, yet volatile styrene and propylene prices compress margins for firms without upstream integration.
Key Report Takeaways
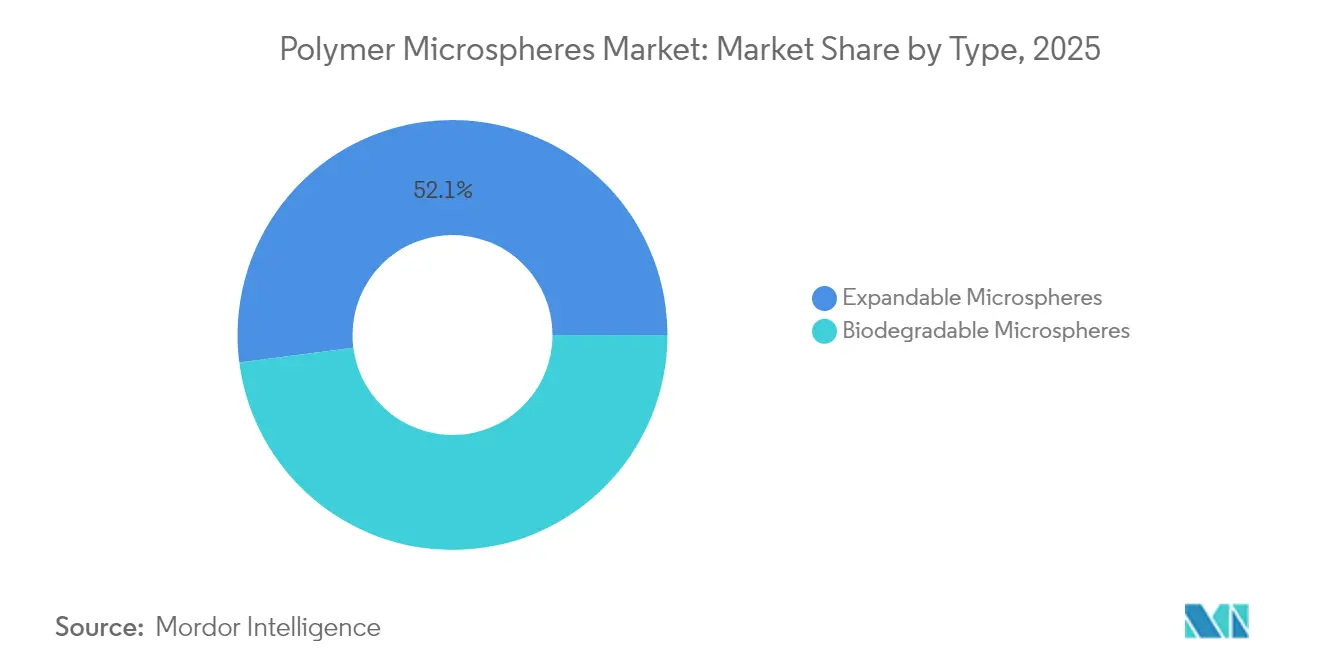
- By type, expandable grades led with 52.05% revenue share in 2025; biodegradable grades are projected to advance at an 10.74% CAGR to 2031, the fastest among all types.
- By material composition, polystyrene accounted for 32.12% of the polymer microspheres market share in 2025, while biodegradable polymers are forecast to grow at an 11.05% CAGR through 2031.
- By end-user industry, life sciences and pharmaceuticals held 42.98% revenue share in 2025, and the same industry is predicted to record an 10.63% CAGR over the outlook period.
- By geography, Asia-Pacific contributed 36.88% of 2025 global revenue and is also the fastest-growing region with a 10.31% CAGR expected to 2031.
Note: Market size and forecast figures in this report are generated using Mordor Intelligence’s proprietary estimation framework, updated with the latest available data and insights as of 2026.
Market Trends and Insights
Drivers Impact Analysis of Polymer Microspheres Market*
| Drivers | (~) % Impact on CAGR Forecast | Geographic Relevance | Impact Timeline |
|---|---|---|---|
| Rising adoption in targeted drug delivery and controlled-release pharmaceuticals | +2.8% | Global, with a concentration in North America and Europe | Long term (≥ 4 years) |
| Demand for lightweight fillers in automotive and transportation components | +1.9% | North America and Europe, expanding to APAC | Medium term (2-4 years) |
| Surge in micro-electronics manufacturing | +1.4% | APAC core, spill-over to North America | Medium term (2-4 years) |
| Growth of 3-D printing feedstocks using polymer microspheres | +1.2% | North America and Europe, early adoption in APAC | Long term (≥ 4 years) |
| Emergence of bio-based expandable microspheres for low-carbon building materials | +0.9% | Europe leading, North America following | Long term (≥ 4 years) |
| Source: Mordor Intelligence | |||
Rising Adoption in Targeted Drug Delivery and Controlled-Release Pharmaceuticals
Precise release profiles achievable with PLGA and other biodegradable carriers have shifted formulators away from traditional tablets toward injectable or implantable microsphere systems. The capability to encapsulate biologics improves stability, which reduces cold-chain losses and enhances therapeutic outcomes. Microfluidic manufacturing now delivers narrow particle-size distributions that overcome historic batch variability. The United States Food and Drug Administration has cleared more than 15 PLGA-based products, providing clear regulatory precedents. Personalized-medicine programs exploit tunable release kinetics, enabling dosing designed around individual pharmacokinetic profiles. Pharmaceutical companies that already own sterile microsphere capacity build high switching costs that reinforce competitive moats.
Demand for Lightweight Fillers in Automotive and Transportation Components
Regulators in Europe require fleetwide weight reductions that support CO₂ intensity targets, encouraging polymers that integrate hollow spheres into interior trim, bumper beams, and under-hood parts. Density can fall by 25% with no loss in mechanical stiffness, a gain that extends electric vehicle driving range. Lower-pressure molding made possible by microspheres also trims cycle times, which improves plant productivity. Suppliers that co-develop grades with compounders lock in multiyear sourcing agreements. As battery-electric models account for a larger share of production, every kilogram removed from the body in white delivers tangible cost and range advantages for original equipment manufacturers.
Surge in Micro-Electronics Manufacturing
Advanced semiconductor packages generate intense heat loads, prompting assemblers to specify filled underfills and thermal adhesives that incorporate conductive polymer microspheres. The ability to tailor dielectric constants while absorbing mechanical stress delivers dual functionality in smartphones, servers, and Internet-of-Things sensors. Asia-Pacific dominates the installed base of assembly and test operations, which concentrates demand in China, South Korea, and Taiwan. As 5 G rollouts expand and artificial intelligence accelerators proliferate, requirements for reliable thermal management widen the addressable market. Long qualification cycles and stringent purity metrics secure recurring revenue streams for approved vendors.
Growth of 3-D Printing Feedstocks Using Polymer Microspheres
Selective laser sintering of polymer powders relies on near-perfectly spherical particles that guarantee smooth layer deposition and minimal porosity, making microsphere morphology a critical performance attribute[1]Maximilian Dechet et al., “Production of Spherical Micron-Sized Polymer Particles for Additive Manufacturing by Liquid Phase Processes,” AIP Conference Proceedings, aip.org. Polyamide 12 presently dominates, yet new formulations based on polycarbonate and high-temperature engineering polymers are expanding material choices in aerospace and medical implants. Continuous production lines have reduced the cost per kilogram, which narrows the gap with conventional injection molding for small and medium runs. Users benefit from tooling-free customization that accelerates product iteration while minimizing scrap. The additive-manufacturing ecosystem, therefore, becomes a structural growth lever for specialized grades with tight particle-size cuts.
Restraints Impact Analysis of Polymer Microspheres Market*
| Restraints | (~) % Impact on CAGR Forecast | Geographic Relevance | Impact Timeline |
|---|---|---|---|
| Restrictions on microplastics in cosmetics and toiletries | -1.8% | Europe is leading, expanding globally | Short term (≤ 2 years) |
| Volatile petrochemical feedstock prices and supply disruption risk | -1.3% | Global, with acute impact in Asia-Pacific | Short term (≤ 2 years) |
| Production-scale challenges in ultra-uniform biodegradable microspheres | -0.7% | Global, concentrated in pharmaceutical applications | Medium term (2-4 years) |
| Source: Mordor Intelligence | |||
Restrictions on Micro-Plastics in Cosmetics and Toiletries
European Union regulation limits microplastic content in rinse-off cosmetics to 0.01%, effectively banning conventional polystyrene spheres in facial scrubs and toothpastes. Global brands harmonize formulations to a single compliant standard, which removes a significant volume outlet for disposable grades. Suppliers that lack biodegradable alternatives see immediate revenue declines. New product development cycles also divert resources toward regulatory testing, slowing launches in adjacent categories. While bio-degradable replacements offer higher margins, the short-term shift challenges cash flows for firms heavily exposed to personal care.
Production-Scale Challenges in Ultra-Uniform Biodegradable Microspheres
Pharmaceutical customers demand tight particle-size distributions to achieve consistent drug loading, yet solvent evaporation methods for PLGA can drift outside specification when batch volumes climb. Equipment upgrades, such as precision temperature control and in-line particle classifiers, raise capital requirements. As a result, only a handful of contract manufacturing organizations meet current good manufacturing practice standards for large volumes. Limited capacity constrains supply and maintains premium pricing, which slows penetration in therapies that are cost-sensitive. Process-intensification programs remain a priority, but scale economies will take several years to materialize.
*Our forecasts treat driver/restraint impacts as directional, not additive. The impact forecasts reflect baseline growth, mix effects, and variable interactions.
Polymer Microspheres Market Segment Analysis
By Type:
Biodegradable Innovation Drives Premium GrowthExpandable grades captured 52.05% of 2025 revenue, underpinned by steady use in automotive and construction composites, where controlled expansion lowers density without sacrificing strength. Biodegradable grades, while smaller, are forecast to grow fastest at 10.74% CAGR as regulators and drug developers favor PLGA and polycaprolactone matrices for controlled drug release. Asia-Pacific formulators historically focused on expandable spheres for lightweight fillers, now diversifying into bio-degradable capacity to hedge future demand.
Pharmaceutical contractors lock in long-term supply agreements that secure capacity for late-stage clinical programs, stabilizing order books. By contrast, generic expandable products face intensifying price competition, especially from domestic producers in China and India that leverage low-cost bases. As a result, revenue mix across the polymer microspheres market tilts toward higher-margin biodegradable segments through 2031.



By Material Composition:
Polystyrene Dominance Faces Sustainability PressurePolystyrene accounted for 32.12% of 2025 revenue because of its mature processing routes, narrow particle-size control, and relatively low cost. Polyurethane, polyethylene, and PMMA serve niche applications in coatings and electronics, while bio-degradable polymers such as PLGA expand fastest at 11.05% CAGR. European micro-plastic restrictions and brand commitments to post-consumer recyclability accelerate substitution from polystyrene toward renewable or degradable compositions.
Producers respond by introducing partially bio-based expandable lines that maintain performance while improving life-cycle assessments. Material diversification becomes a strategic imperative because customer audits increasingly evaluate cradle-to-gate greenhouse-gas footprints. Suppliers with multi-polymer platforms protect revenue pools even as legacy grades face structural decline.
By End-User Industry:
Pharmaceutical Leadership Drives InnovationLife sciences and pharmaceuticals dominated 2025 demand with 42.98% revenue share because controlled-release delivery directly improves therapeutic outcomes and patient adherence. Cosmetics, once a major outlet, contracts due to regulatory bans on micro-plastics, whereas electronics grows on the back of miniaturization and higher thermal loads. Paints, coatings, and industrial fillers remain sensitive to construction cycles but continue to use microspheres for texture and weight reduction.
The polymer microspheres market size for pharmaceutical is advancing at an 10.63% CAGR. Oncology, hormone replacement, and vaccine adjuvants represent priority pipelines that require sustained-release carriers. Contract manufacturers that provide integrated drug-substance and microsphere formulation services shorten development timelines, which strengthens customer retention. Cosmetics shifts toward degradable or mineral alternatives, while electronics demand rises steadily, underpinning a diverse consumption profile that insulates the market from single-industry volatility.

Geography Analysis
APAC Polymer Microspheres Market
Asia-Pacific holds a 36.88% share of the 2025 global value, reflecting its dominance in pharmaceutical manufacturing, semiconductor assembly, and automotive production. The region’s 10.31% forecast CAGR stems from cost advantages in feedstocks and expanding electric-vehicle assembly lines that value lightweight fillers. India amplifies growth as domestic pharmaceutical output rises, and local cosmetics brands adopt compliant, degradable alternatives. Export-oriented suppliers leverage established logistics to ship to North America and Europe, reinforcing Asia-Pacific’s role as the primary production hub for the polymer microspheres market.
India and APAC Polymer Microspheres Market
The region’s 10.31% forecast CAGR stems from cost advantages in feedstocks and expanding electric-vehicle assembly lines that value lightweight fillers. India amplifies growth as domestic pharmaceutical output rises, and local cosmetics brands adopt compliant, degradable alternatives. Export-oriented suppliers leverage established logistics to ship to North America and Europe, reinforcing Asia-Pacific’s role as the primary production hub for the polymer microspheres market.
The Americas and EMEA Polymer Microspheres Market
North America maintains strong consumption through innovation in drug delivery and stringent corporate average fuel economy regulations that embed lightweighting targets. Contract research organizations and original equipment manufacturers collaborate with microsphere suppliers on proprietary grades that meet unique performance criteria. Europe enforces micro-plastic restrictions under REACH, compelling formulators to adopt biodegradable spheres. This legislative push drives rapid product reformulation across personal care and paints. South America and the Middle-East, and Africa experience moderate uptake as industrial diversification advances, but supply relies on imports due to limited local production capacity.


Value Chain Analysis
The polymer microspheres value chain starts with upstream petrochemical and bio-based inputs, including monomers (such as styrene and acrylics) and specialty additives (initiators, surfactants, stabilizers). Price swings in petrochemical feedstocks can pass into microsphere costs quickly. Polymerization is typically followed by classification to narrow particle-size cuts, surface functionalization, and application-specific finishing, including expandable/hollow grades for lightweighting, high-purity biodegradable carriers such as PLGA for pharmaceuticals, and functionalized spheres for electronics adhesives and underfills. Process control and raw-material consistency are recurring bottlenecks, since particle-size distribution and purity directly affect qualification outcomes, particularly in life sciences and micro-electronics.
Downstream, microspheres flow through compounders and formulators in paints and coatings, plastics, and composites, as well as to pharmaceutical developers and CMOs and electronics materials suppliers that require tighter specifications and longer validation cycles. Distribution is handled through specialty chemical channels and, for critical grades, direct supply agreements where qualification and audit requirements raise switching costs for approved vendors. Across the chain, investments in tighter particle classification and monitoring to reduce out-of-spec batches are especially relevant for premium biodegradable grades and advanced electronics formulations.
Competitive Landscape
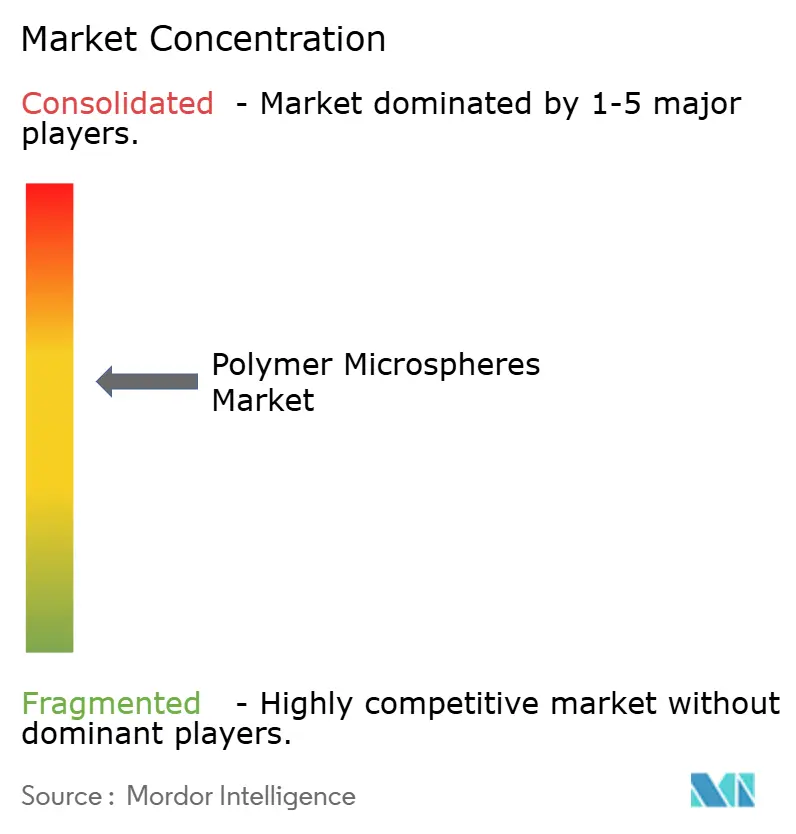
The polymer microspheres market is moderately fragmented. Global incumbents such as Nouryon, Evonik, and Merck lead in scale yet face specialty competition from niche producers that focus on single-application expertise. Market concentration varies by end use. FDA-approved pharmaceutical grades exhibit higher entry barriers because of quality-management standards and intellectual-property portfolios, whereas the paints and coatings segments see regional price competition. Technology strategy centers on proprietary emulsion, suspension, and microfluidic processes that deliver uniform particle morphology and functional coatings.
Polymer Microspheres Industry Leaders
Nouryon
Momentive
Polysciences Inc.
Sekisui Kasei Co., Ltd.
Cospheric LLC
- *Disclaimer: Major Players sorted in no particular order
Polymer Microspheres Market Companies Covered in this Report
- Bangs Laboratories Inc.
- CD Bioparticles
- Cospheric LLC
- DiaSorin S.p.A
- Evonik Industries AG
- Matsumoto Yushi Seiyaku Co., Ltd.
- Merck KGaA
- Momentive
- Nouryon
- Phosphorex Inc.
- PolyMicrospheres
- Polysciences Inc.
- Sekisui Kasei Co., Ltd.
- Sphere Fluidics Ltd.
- Sunjin Chemical Co., Ltd.
- Thermo Fisher Scientific Inc.

Market Opportunities and Future Outlook
A key whitespace sits at the intersection of microplastics restrictions and performance-driven end uses, where buyers need alternatives that maintain functionality while improving sustainability credentials. In pharmaceuticals, controlled-release systems based on PLGA and related biodegradable carriers build on regulatory precedents, with more than 15 PLGA-based products cleared by the US FDA supporting demand for GMP-grade, ultra-uniform microspheres and sterile manufacturing capacity. In Europe, microplastic limits in cosmetics and toiletries are accelerating reformulation away from conventional polystyrene spheres, which creates room for degradable and bio-based microspheres in personal care and adjacent formulation-led categories.
Manufacturing technology is also creating opportunity through scale-up and process innovation focused on tighter size control and higher throughput. Academic and technical work in 2026 highlighted substantially scaled reactor production routes for polystyrene microspheres and continuous scale-up approaches for poly(l-lactic acid) microspheres, aligning with efforts to move beyond batch variability and improve consistency for high-value applications. On the demand side, application-led pull continues across lightweighting (expandable grades used to reduce density in automotive and construction), advanced packaging and thermal management in electronics (functional microspheres in underfills and adhesives), and additive manufacturing powders where spherical morphology and narrow cuts support layer deposition and part quality.
Recent Industry Developments in Polymer Microspheres Market
- April 2026: Nouryon introduced a new Expancel microspheres grade (Expancel 081) targeted at paperboard production to boost bulk and reduce fiber use, launched around the Pulp and Beyond 2026 event in Helsinki. The release expands expandable microspheres penetration beyond traditional lightweighting uses into packaging productivity and material-efficiency levers, tying microspheres demand to paperboard and pulp value chains.
- March 2025: Nouryon launched an extra-small expandable grade, Expancel XS200 microspheres, positioned to reduce interior paint weight and support formulators seeking improved application properties. The rollout points to continued product segmentation within expandable microspheres, where particle-size tuning differentiates performance and can support premiumization in coatings.
- December 2024: Nouryon launched Expancel BIO microspheres, described as a first-generation partially bio-based lightweight filler and blowing-agent concept for applications such as construction and automotive. The introduction reinforces the shift toward lower-carbon and bio-attributed microsphere offerings as customers tighten sustainability requirements and evaluate material footprints.


Polymer Microspheres Market Report Scope and Research Methodology
Market Definition and Coverage
For this study, the polymer microspheres market covers the value of polymer-based micro-sized spheres sold into industrial and specialty uses, counted at the point of commercial sale and expressed in USD for the stated year.
Scope exclusions: We exclude non-polymer microspheres (such as glass or fly ash) and internal captive transfers that do not represent an external sale.
Segments Covered in This Report
- By Type
- Expandable Microspheres
- Biodegradable Microspheres
- By Material Composition
- Polystyrene (PS)
- Polymethyl-methacrylate (PMMA)
- Polyethylene (PE)
- Polyurethane (PU)
- Biodegradable Polymers (PLGA, PCL, etc.)
- Others (Nylon, PVDF, etc.)
- By End-User Industry
- Life Sciences and Pharmaceuticals
- Cosmetics and Personal Care
- Paints and Coatings
- Electronics
- Ceramics and Composites
- Plastics
- Other End-User Industries (3-D Printing, Agriculture, etc.)
- By Geography
- Asia-Pacific
- China
- India
- Japan
- South Korea
- Rest of Asia-Pacific
- North America
- United States
- Canada
- Mexico
- Europe
- Germany
- United Kingdom
- France
- Italy
- Rest of Europe
- South America
- Brazil
- Argentina
- Rest of South America
- Middle-East and Africa
- Saudi Arabia
- South Africa
- Rest of Middle-East and Africa
- Asia-Pacific
Data Sources, Market Sizing, and Validation
Desk Research
Desk research was used to set the starting structure of the market and to collect the public data series that influence demand for polymer microspheres. We reviewed sources such as the USGS, UN Comtrade, the US International Trade Commission DataWeb, and the US Patent and Trademark Office, since they help with trade flows, material availability, and innovation direction. For downstream usage signals, we also referred to sources such as the US FDA (drug delivery related approvals and guidance), and reputable journals that publish polymer science and formulation work.
To connect these indicators with company activity, we used company annual reports, investor presentations, product technical datasheets, and press releases to map grades, end uses, and typical selling routes. Analysts also rely on paid subscriptions for company financials and intelligence, patent databases, and import or export shipment-level databases when trade detail is needed to validate the volume direction. The sources listed here are illustrative only, and many other public documents and data points were also used for validation and clarification.
Primary Interviews and Surveys
Primary work focused on confirming what is actually being counted as polymer microspheres in commercial trade, and how demand shifts across life sciences, cosmetics, coatings, electronics, and other end uses. We spoke with a mix of material suppliers, formulators, distributors, and large end users across key regions so gaps from desk research could be closed and assumptions could be adjusted before totals were finalized.
Distribution of primary research fieldwork respondents
| Company type | Respondent position | Region |
|---|---|---|
| Top tier: 38% | CXOs: 18% | APAC: 39% |
| Mid tier: 44% | Functional/Unit leaders: 37% | EMEA: 37% |
| Smaller Players: 18% | Managers: 45% | Americas: 24% |
Market-Sizing & Forecasting
The model is built using a top-down approach where polymer processing, coatings and adhesive activity, pharma and life science formulation intensity, and trade signals are used to reconstruct the addressable demand pool by region. Once the demand pool is set, we corroborate the totals with selective bottom-up checks such as sampled supplier revenue splits, channel feedback on typical selling prices, and volume by application proxies, and then adjust where the two views do not align.
Key inputs used in the sizing include import and export direction for relevant polymer-based specialty materials, changes in upstream feedstock prices that influence microsphere pricing, adoption of lightweighting and foaming solutions in industrial products, usage intensity in drug delivery and diagnostics, and application-level substitution patterns between expandable and non-expandable grades. Where a bottom-up cross-check is incomplete for a country or application, the gap is handled through regional peer ratios that are validated in interviews and then stress-tested against trade and macro industrial output trends.
For forecasting, scenario analysis is used with a base case anchored to expert views on adoption rates and pricing progression, followed by sensitivity cases for raw material volatility and demand swings in electronics and coatings. These scenarios are converted into annual values using a smoothing step so the final curve matches how specialty material markets typically move, with short cycles but steady long-term penetration.
Data Validation & Update Cycle
Validation is done through multiple checks so the final number is traceable to clear signals. We compare the market output against independent indicators like regional trade direction, end-use production trends, and observable pricing ranges, and then investigate any sharp jumps that do not have a clear driver. When large variances show up, the assumptions are reworked and, where needed, respondents are re-contacted to confirm whether the change is real or caused by a definition mismatch.
A second analyst review is completed before sign-off so inputs, math, and unit conversions are consistent across regions. Reports are refreshed annually, and interim updates are done when material events occur that can move pricing, supply, or demand. Before delivery, a final pass is completed so clients receive the most current view available at that time.
Mordor Intelligence's Polymer Microspheres Market Size Compared With Other Published Estimates
Published market sizes for polymer microspheres often do not match because the boundaries are not consistent, and because pricing and end-use coverage can be mixed with adjacent markets. Differences also come from the base year selected, currency conversion timing, and whether the estimate is built from observable demand indicators or from broad category roll-ups.
By tracking application-level adoption signals, trade direction, and price progression inputs, and then filtering them through a defined scope, Mordor Intelligence keeps the polymer microspheres total tied to real demand pools instead of wider microspheres categories. In addition, some estimates appear to include broader material sets or a wider definition of what counts as a microsphere, which can lift the value even when end-use demand is unchanged.
Benchmark comparison
| Source | Market Size | Gaps in Research Methodology |
|---|---|---|
| Mordor Intelligence | USD 2.29 B (2026) | |
| Global Consultancy A | USD 6.84 B (2025) | Uses a broader market boundary that appears to capture a wider set of polymer particle products and related applications, which increases the counted value versus a microspheres-only scope and can also reflect different pricing assumptions. |
| Industry Research Desk B | USD 4.83 B (2023) | Builds from an earlier base year and a wider category definition across type and end-use groupings, and the headline value may include adjacent microscale polymer forms that are not consistently separated from true microspheres. |
Looking at the spread, the main driver is what gets included as a polymer microsphere and how tightly pricing is linked to observable signals in each end-use. When scope is kept specific and the inputs are checked against trade, application activity, and reasonable pricing ranges, the resulting market size becomes easier to reproduce and to track over time.


Key Questions Answered in the Report
What is the current value of the polymer microspheres market?
The market is valued at USD 2.29 billion in 2026, supported by expanding demand across pharmaceuticals, automotive, and electronics.
How fast will the polymer microspheres market grow through 2031?
Revenue is projected to rise at a 8.92% CAGR, reaching USD 3.51 billion by 2031.
Which end-user industry leads consumption?
Life sciences and pharmaceuticals account for 42.98% of 2025 revenue because precision drug-delivery systems require uniform, high-purity microspheres.
Why are biodegradable microspheres gaining traction?
Regulatory limits on micro-plastics and the need for controlled-release drug systems drive an 10.74% CAGR for biodegradable grades, the fastest among all types.
Which region is the largest market for polymer microspheres?
Asia-Pacific holds 36.88% of global revenue, bolstered by its pharmaceutical manufacturing base, electronics assembly capacity, and automotive production.
Page last updated on:


 Your data is secure and never sold or shared.


