Polymer Fillers Market Size and Share
Market Overview
| Study Period | 2020 - 2031 |
|---|---|
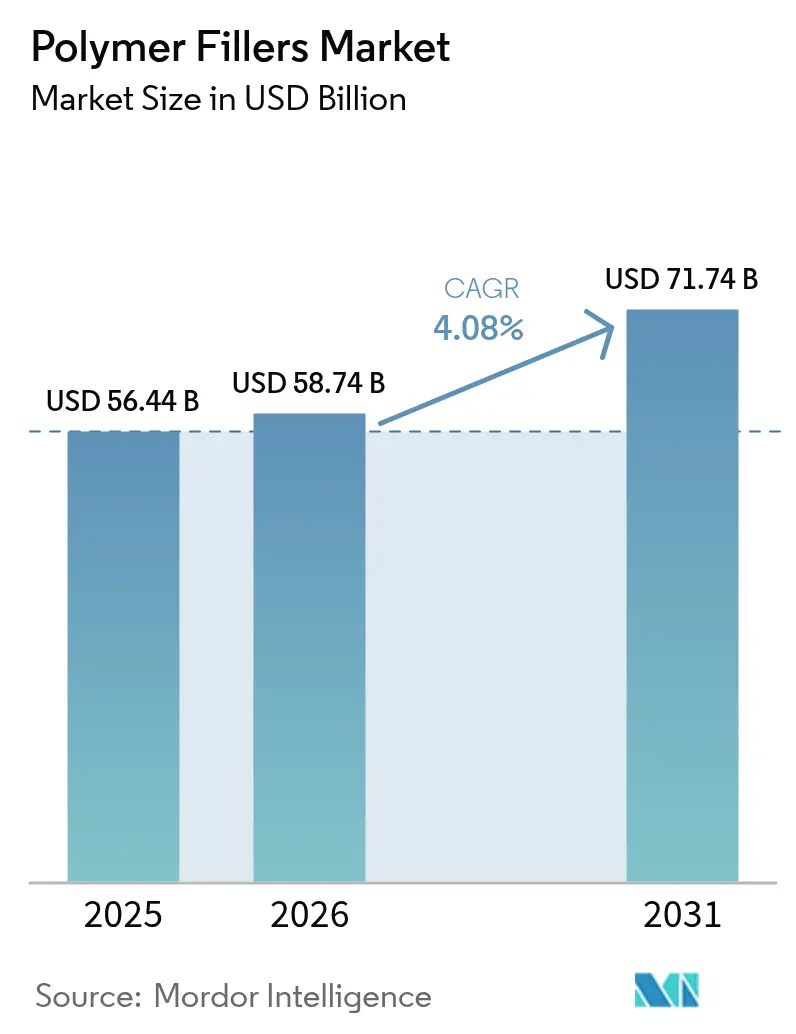
| Market Size (2026) | USD 58.74 Billion |
| Market Size (2031) | USD 71.74 Billion |
| Growth Rate (2026 - 2031) | 4.08% CAGR |
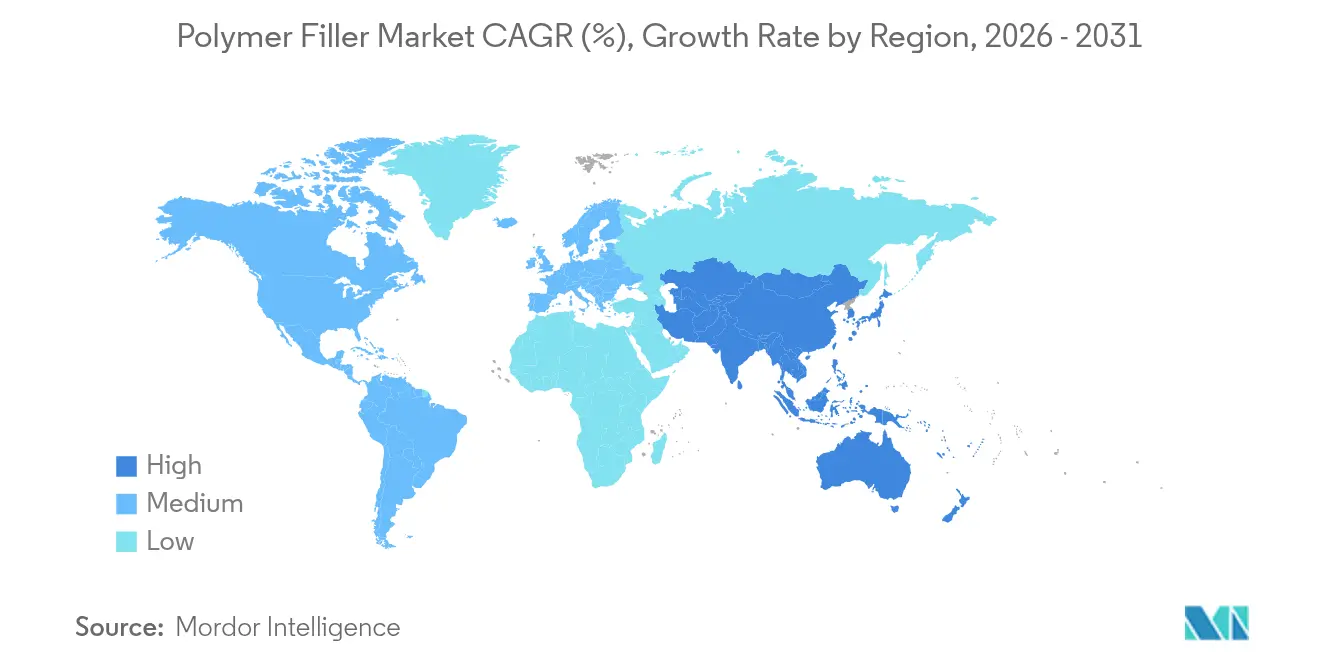
| Fastest Growing Market | Asia Pacific |
| Largest Market | Asia Pacific |
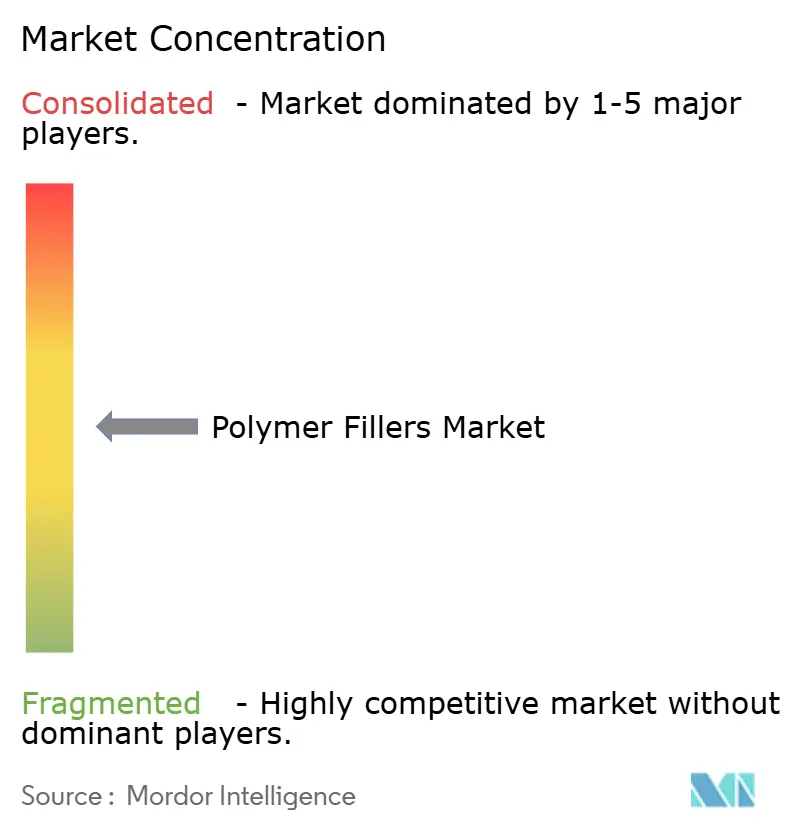
| Market Concentration | Medium |
Major Players *Disclaimer: Major Players sorted in no particular order Image © Mordor Intelligence. Reuse requires attribution under CC BY 4.0. | |
Polymer Fillers Market Analysis by Mordor Intelligence
The Polymer Filler Market size in 2026 is estimated at USD 58.74 billion, growing from 2025 value of USD 56.44 billion with 2031 projections showing USD 71.74 billion, growing at 4.08% CAGR over 2026-2031. Demand growth reflects the dual function of fillers as performance enhancers and cost reducers, a transition that now guides material selection in construction, mobility, and electronics. Inorganic grades continue to dominate because calcium carbonate, silica, and talc can cut formulation costs while simultaneously improving stiffness and thermal stability. Organic options are gaining momentum as bio-based white minerals and natural fibers satisfy regulatory pressure for sustainable inputs and lower carbon footprints. Thermoplastics keep the largest consumption share, but elastomer demand is scaling rapidly as electric vehicle (EV) platforms turn to lightweight, vibration-damping parts. Regionally, the polymer fillers market is expanding fastest in Asia Pacific, thanks to capacity additions in China, India, and the ASEAN bloc, while North American growth remains steady on the back of EV incentives and infrastructure renewal programs.
Key Report Takeaways
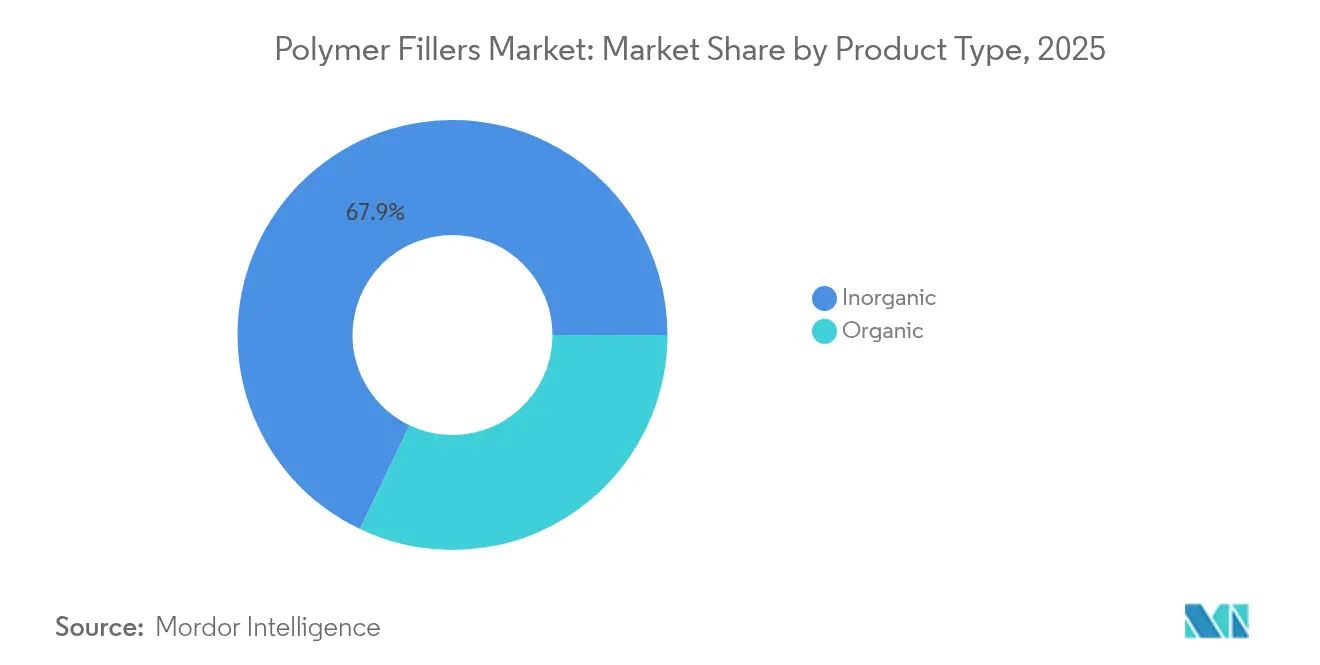
- By product type, inorganic fillers led with a 67.92% revenue stake in 2025, while organic grades display the highest forecast growth at a 5.12% CAGR through 2031.
- By polymer matrix, thermoplastics commanded a 53.61% polymer fillers market share in 2025, whereas elastomers are on track for the quickest rise, advancing at a 4.91% CAGR to 2031.
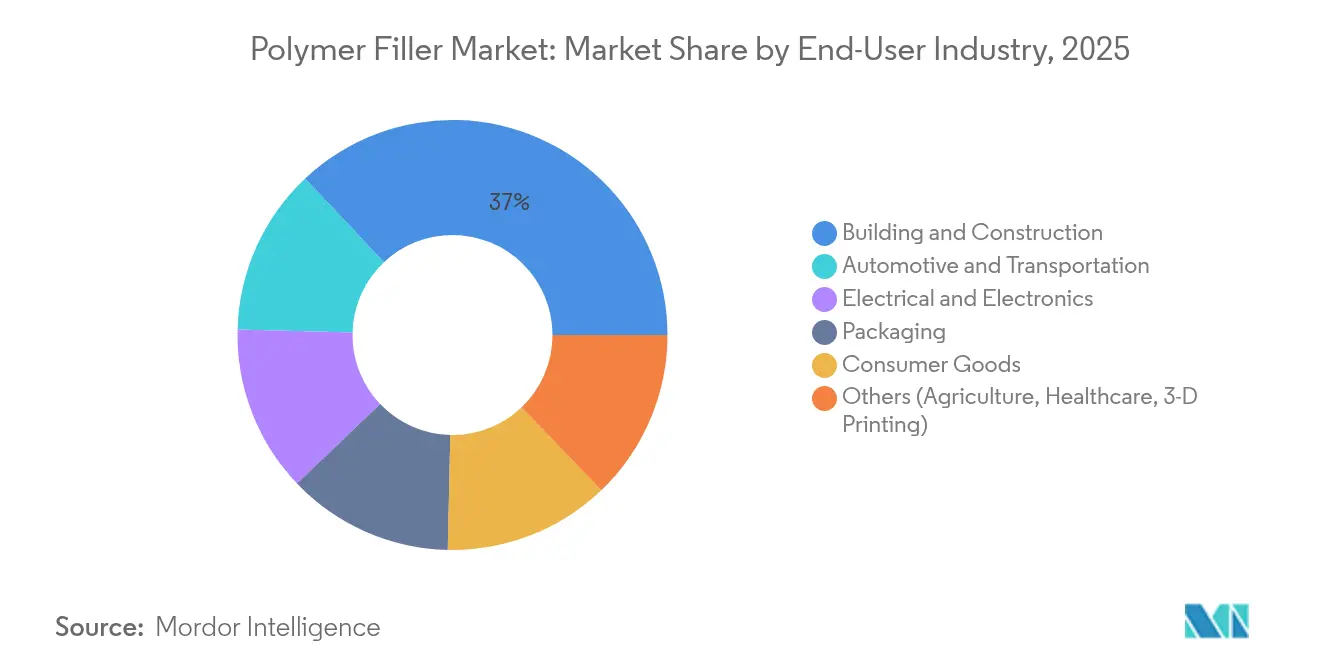
- By end-user industry, building and construction applications held 37.02% of the polymer fillers market size in 2025; automotive and transportation are projected to expand at a 5.46% CAGR over the same period.
- By geography, Asia Pacific captured 39.78% of 2025 demand and is expected to register a robust 5.30% CAGR through 2031.
Note: Market size and forecast figures in this report are generated using Mordor Intelligence’s proprietary estimation framework, updated with the latest available data and insights as of 2026.
Global Polymer Fillers Market Trends and Insights
Drivers Impact Analysis*
| Driver | (~) % Impact on CAGR Forecast | Geographic Relevance | Impact Timeline |
|---|---|---|---|
| Rising demand in building & construction | +1.2% | Global, with strong growth in Asia Pacific and North America | Medium term (2-4 years) |
| Electrification of mobility & lightweighting push | +0.9% | North America, Europe, China leading EV adoption | Long term (≥ 4 years) |
| Surge in electrical & electronics production | +0.8% | Asia Pacific core, spill-over to MEA | Short term (≤ 2 years) |
| Growth of recycled-content polymer compounds | +0.6% | Europe and North America regulatory-driven | Medium term (2-4 years) |
| Rapid uptake of composite 3-D-printing filaments | +0.4% | Global, concentrated in developed markets | Long term (≥ 4 years) |
| Source: Mordor Intelligence | |||
Rising Demand in Building & Construction
Infrastructure modernization and green building codes are lifting filler usage in concrete, cement, and asphalt mixes. Ground calcium carbonate lowers clinker requirements in portland-limestone cements, reducing CO₂ output while retaining strength[1]J. Smith, “Calcium Carbonate in Portland-Limestone Cement,” Portland Cement Association, cement.org. Rubber-reinforced concretes boost compressive strength by up to 29% and flexural strength by 66%, which appeals to seismic-resistant designs. Geopolymer mixes with mineral and plant fibers improve freeze–thaw resilience, important for cold-climate projects. The polymer fillers market benefits when cellulose ethers enhance tile adhesives by improving water retention and workability, a feature keenly adopted in emerging economies. In large infrastructure bids throughout Asia and North America, contractors cite material cost savings of 10-15% when fillers replace more expensive binders.
Electrification of Mobility & Lightweighting Push
Battery-electric vehicles require composites that cut weight yet provide crash resistance, flame retardance, and electromagnetic shielding. Carbon-fiber-reinforced nanocomposites with ionic-liquid-treated nanotubes offer flexural strength near 803 MPa while meeting UL 94 V-0 flame ratings. Filler-rich polypropylene door panels formed with chemical foaming agents trim mass by over 15%, helping OEMs meet U.S. Corporate Average Fuel Economy targets. Natural fiber-reinforced polypropylene blends combine 10 wt.% flax and 20 wt.% wood flour to deliver thermal stability suitable for under-hood use. These advances fuel a 0.9 percentage-point boost in the long-term CAGR of the polymer fillers market, particularly in Europe and China where EV penetration tops 50% of new-car sales.
Surge in Electrical & Electronics Production
Asian electronics hubs consume specialty fillers for heat dissipation and dielectric control. Ceramic-laden nanocomposites raise thermal conductivity past 2 W/m·K while retaining low dielectric loss, critical for 5G antenna housings and LED substrates. Graphene-silica elastomers increase dielectric constants, allowing thinner capacitor films. Glass-fiber laminates reinforced with fillers improve stator cooling in high-speed motors, a requirement for compact EV traction systems. Multilayer CNT materials extend printed-circuit lifespan by halving coefficient of thermal expansion mismatch, reducing solder-joint failures in smartphones. The short-term uptick of 0.8 percentage points in CAGR across Asia Pacific keeps the polymer fillers market on a strong footing.
Growth of Recycled-Content Polymer Compounds
Circular economy policies in Europe and North America accelerate demand for mechanically and chemically recycled resins blended with performance fillers. Advanced optical sorters and design-for-recycling principles cut polypropylene recyclate cost by 30%, making filled recyclates price competitive with virgin grades. Nanoclay-modified bumper recyclates exhibit 25% higher tensile modulus than unfilled counterparts. PVC decking producers deploy calcium-carbonate-rich regrind streams collected under closed-loop take-back programs, reducing virgin PVC usage by 40%. Novel polyhydroxyalkanoate composites with agricultural fillers improve biodegradation rates, meeting municipal composting standards. These shifts contribute a medium-term 0.6 percentage-point lift in CAGR as the polymer fillers industry pivots toward circular feedstocks.
Restraints Impact Analysis*
| Restraint | (~) % Impact on CAGR Forecast | Geographic Relevance | Impact Timeline |
|---|---|---|---|
| High processing & dispersion cost of specialty fillers | -0.8% | Global, particularly affecting small-medium manufacturers | Short term (≤ 2 years) |
| Raw-material price volatility | -0.6% | Global supply chain dependent regions | Medium term (2-4 years) |
| Emerging micro-plastics-dust emission norms | -0.4% | Europe leading, expanding to North America and Asia Pacific | Long term (≥ 4 years) |
| Source: Mordor Intelligence | |||
High Processing & Dispersion Cost of Specialty Fillers
Uniform dispersion of graphene, CNTs, or layered silicates requires twin-screw extruders outfitted with intensive kneading blocks and optimized barrel profiles. Small-and-medium compounders face capital barriers exceeding USD 2 million per line, which limits product range. Masterbatch producers must balance high filler loading with acceptable melt flow; poor flow fosters die-lip build-up and downtime. New dispersants improve milling efficiency but add 8–12 % to formulation cost, compressing margins. Oil absorption in mineral fillers further complicates viscosity control, necessitating surface treatments that raise raw-material spend. These realities trim near-term growth by 0.8 percentage points across the polymer fillers market.
Emerging Micro-Plastics-Dust Emission Norms
The EU restricts synthetic polymers above 0.01 % weight in many articles, with pellet loss prevention mandates affecting sites handling over five tonnes per year[2]European Parliament Committee, “Microplastics Regulation Overview,” europarl.europa.eu. Compliance demands third-party certification, dedicated containment infrastructure, and frequent audits, adding roughly EUR 0.02 per kilogram processed. REACH revisions require usage instructions that curb microplastic release, extending record-keeping and labeling duties. Food-contact packaging now faces stricter migration limits, compelling tight control over filler purity and particle size to avoid re-qualification testing. Although exemptions exist for medicinal products, wider implementation in North America and Asia Pacific drags long-term CAGR down by 0.4 percentage points for the polymer fillers market.
*Our forecasts treat driver/restraint impacts as directional, not additive. The impact forecasts reflect baseline growth, mix effects, and variable interactions.
Segment Analysis
By Product Type: Inorganic Dominance Drives Cost Optimization
Inorganic fillers accounted for 67.92% of 2025 revenue within the polymer fillers market share, sustaining leadership due to their favorable economics and broad applicability. Calcium carbonate fillers can lower polypropylene part cost by up to 40% while imparting improved stiffness and dimensional stability. Silica and engineered talc supply anti-blocking and nucleating functions for food packaging films, with major producers operating mines adjacent to compounding hubs, which reduces logistics overhead. Metal oxides such as titanium dioxide remain essential for opacity and UV protection, although supply constraints have prompted price surcharges.
Organic fillers are expanding at a 5.12% CAGR through 2031, reflecting regulatory support for bio-based content. Sustainable streams like wood flour, starch, and ground eggshells provide weight reductions of 5–10% compared with mineral systems, which supports eco-labeling in consumer goods. Lignocellulosic fibers additionally raise tensile modulus in biopolymer blends, aiding compostable bag performance. Carbon-based fillers extend into conductive applications; graphene nanoplatelets dispersed at 1–3 wt.% lower surface resistivity by three orders of magnitude. As these advanced organics scale commercially, the polymer fillers market size for organic grades could exceed USD 13.25 billion by 2031.


By Polymer Matrix: Thermoplastics Lead Versatile Applications
Thermoplastics held 53.61% of total demand in 2025 and anchor growth for the polymer fillers market. Polypropylene, polyethylene, and polyamide absorb more than six million tonnes of fillers annually because they accept high loadings without sacrificing recyclability. Recent studies show low-density polyethylene sheets with 36 vol % calcium carbonate enjoy a 20% boost in tear resistance, ideal for agriculture films. Glass-fiber-filled polypropylene achieves a 40% modulus gain for HVAC housings, cutting steel replacement costs.
Elastomers represent the fastest-growing matrix, advancing at a 4.91% CAGR as EV platforms need vibration-damping battery gaskets and thermal gap fillers. Hydrogenated nitrile rubber blended with MnCoGe alloys shows near-zero thermal contraction from −20 °C to 40 °C, preventing leakage in oil exploration seals. Nanotube-reinforced silicone foams increase thermal conductivity to 2.5 W/m·K while preserving compressive set below 10%. Thermosets keep niche roles where crosslinked strength matters; basalt-fiber epoxy laminates record tensile strengths above 390 MPa, offering a recyclable route for wind-blade panels. Combined, these developments secure a resilient outlook for the polymer fillers market size across all matrix families.
By End-User Industry: Construction Dominance Meets Automotive Acceleration
Building and construction accounted for a 37.02% share of the polymer fillers market size in 2025, thanks to filler-rich concrete, cement, and asphalt that lower costs and improve environmental profiles. Rubber-modified concrete panels withstand 66% higher flexural loads, which reduces reinforcement steel requirements in bridge decks. Limestone-filled cement cuts clinker use by 15%, translating to CO₂ savings of 43 kg per tonne of cement.
Automotive and transportation remain the quickest-expanding end market, projected at a 5.46% CAGR to 2031. Composite battery enclosures based on filler-enhanced polypropylene demonstrate 40% mass reduction compared with aluminum housings while meeting FMVSS 302 burn tests. Door panels produced with chemical foaming agents surpass OEM mass-reduction targets by 15% and contribute to fleet wide emissions cuts. Natural fiber composites curtail life-cycle greenhouse gas emissions by 20% compared with glass-fiber counterparts, supporting European Union CO₂ fleet regulations. Electronics, packaging, and consumer goods round out filler demand with speciality thermal management, barrier, and aesthetic applications, reinforcing the multi-sector pull on the polymer fillers market.
Geography Analysis
Asia Pacific contributes 39.78% of global demand and is projected to post a 5.30% CAGR through 2031. China leads filler consumption through large-scale investments in lithium-battery materials and engineering plastics, while India’s road-building program drives calcium-carbonate volumes. Regional mineral processors operate integrated mines and coating facilities, lowering delivered costs and meeting just-in-time requirements for electronics lines. Government subsidies for new-material plants in Vietnam and Indonesia further expand local supply.
North America records steady expansion as EV production and federal infrastructure packages invigorate polypropylene and talc demand. Carbon-black producers secure Department of Energy grants that back domestic battery supply chains, and recyclers scale post-consumer PVC fillers for decking boards. Extreme weather events disrupting high-purity quartz supply highlight vulnerability but have spurred risk-mitigation inventories.
Europe experiences moderate growth because micro-plastic restrictions tighten compliance costs. Yet, circularity goals spur investment in glass-cullet fillers and bio-based additives that align with EU taxonomy requirements. Established vendors pioneer low-carbon talc mining with renewable power, aiming for Scope 1 and 2 emission reductions. Collectively, these geographic dynamics shape a balanced outlook for the polymer fillers market.

Competitive Landscape
The polymer fillers market displays moderate fragmentation as top mineral processors leverage vertically integrated assets. Product differentiation rests on particle-size control, surface modification, and sustainable sourcing.
Cabot Corporation unveiled the EVOLVE platform to market recovered carbon blacks and secured USD 50 million in federal grants for battery anode materials.
Innovation in processing aids further distinguishes leaders. Novel dispersants yield 20% shorter milling times for carbon-black concentrates, translating to lower energy input and faster line turnaround. Pilot plants trial hemp-fiber fillers treated for flame retardance in collaboration with BASF, targeting furniture and automotive interiors. Collectively, these moves maintain competitive intensity while advancing sustainability objectives within the polymer fillers market.
Polymer Fillers Industry Leaders
Huber Engineered Materials
Imerys
LKAB Minerals
Omya AG
Minerals Technologies Inc.
- *Disclaimer: Major Players sorted in no particular order

Recent Industry Developments
- January 2024: Birla Carbon announced plans for two 120 kt/y carbon-black plants in India and Thailand to support polymer and rubber reinforcement applications.
- October 2023: Nouryon began full-scale production of Expancel expandable microspheres in Wisconsin to meet rising demand for lightweight fillers in packaging, construction, and automotive sectors.


Global Polymer Fillers Market Report Scope
The Polymer Filler market report includes:
| Organic | Natural (wood-flour, starch) |
| Carbon-based (carbon black, graphene) | |
| Inorganic | Oxides (CaCO₃, SiO₂, Al(OH)₃) |
| Hydro-oxides | |
| Salts | |
| Silicates (talc, kaolin, mica) | |
| Metals and Metal-Oxides (ZnO, Al₂O₃, Fe₂O₃) |
| Thermoplastics |
| Thermosets |
| Elastomers |
| Automotive and Transportation |
| Building and Construction |
| Electrical and Electronics |
| Packaging |
| Consumer Goods |
| Others (Agriculture, Healthcare, 3-D Printing) |
| Asia Pacific | China |
| India | |
| Japan | |
| South Korea | |
| Rest of Asia Pacific | |
| North America | United States |
| Canada | |
| Mexico | |
| Europe | Germany |
| United Kingdom | |
| Italy | |
| France | |
| Rest of Europe | |
| South America | Brazil |
| Argentina | |
| Rest of South America | |
| Middle East and Africa | Saudi Arabia |
| South Africa | |
| Rest of Middle East and Africa |
| By Product Type | Organic | Natural (wood-flour, starch) |
| Carbon-based (carbon black, graphene) | ||
| Inorganic | Oxides (CaCO₃, SiO₂, Al(OH)₃) | |
| Hydro-oxides | ||
| Salts | ||
| Silicates (talc, kaolin, mica) | ||
| Metals and Metal-Oxides (ZnO, Al₂O₃, Fe₂O₃) | ||
| By Polymer Matrix | Thermoplastics | |
| Thermosets | ||
| Elastomers | ||
| By End-User Industry | Automotive and Transportation | |
| Building and Construction | ||
| Electrical and Electronics | ||
| Packaging | ||
| Consumer Goods | ||
| Others (Agriculture, Healthcare, 3-D Printing) | ||
| By Geography | Asia Pacific | China |
| India | ||
| Japan | ||
| South Korea | ||
| Rest of Asia Pacific | ||
| North America | United States | |
| Canada | ||
| Mexico | ||
| Europe | Germany | |
| United Kingdom | ||
| Italy | ||
| France | ||
| Rest of Europe | ||
| South America | Brazil | |
| Argentina | ||
| Rest of South America | ||
| Middle East and Africa | Saudi Arabia | |
| South Africa | ||
| Rest of Middle East and Africa | ||


Key Questions Answered in the Report
What is the current Polymer Filler Market size?
The polymer fillers market is worth USD 58.74 billion in 2026 and is forecast to reach USD 71.74 billion by 2031.
Which product type holds the largest polymer fillers market share?
Inorganic fillers such as calcium carbonate, silica, and talc command 67.92% of global revenue as of 2025.
Which end-user industry is expanding fastest?
Automotive and transportation applications are growing at a 5.46% CAGR through 2031, driven by vehicle electrification and lightweighting needs.
Why is Asia Pacific the leading regional market?
Asia Pacific’s 39.78% share is supported by large-scale manufacturing bases, rising infrastructure spending, and high electronics output.
Page last updated on:


