Payday Lending Market Size and Share
Market Overview
| Study Period | 2020 - 2031 |
|---|---|
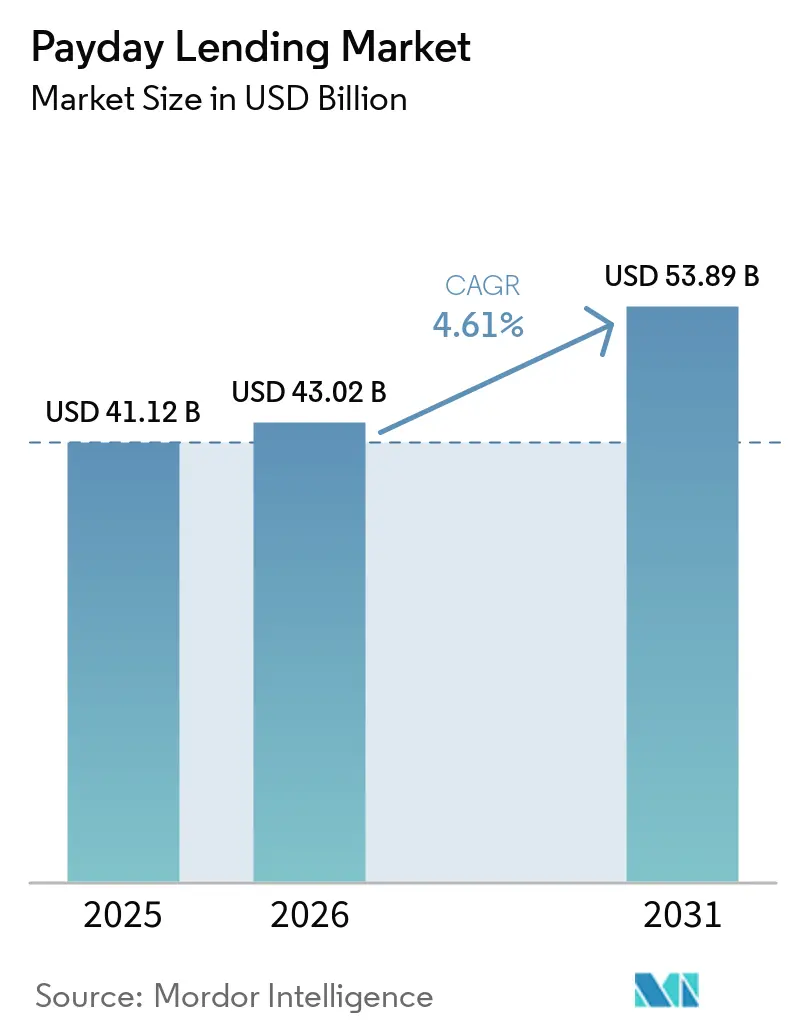
| Market Size (2026) | USD 43.02 Billion |
| Market Size (2031) | USD 53.89 Billion |
| Growth Rate (2026 - 2031) | 4.61% CAGR |
| Fastest Growing Market | Asia Pacific |
| Largest Market | North America |
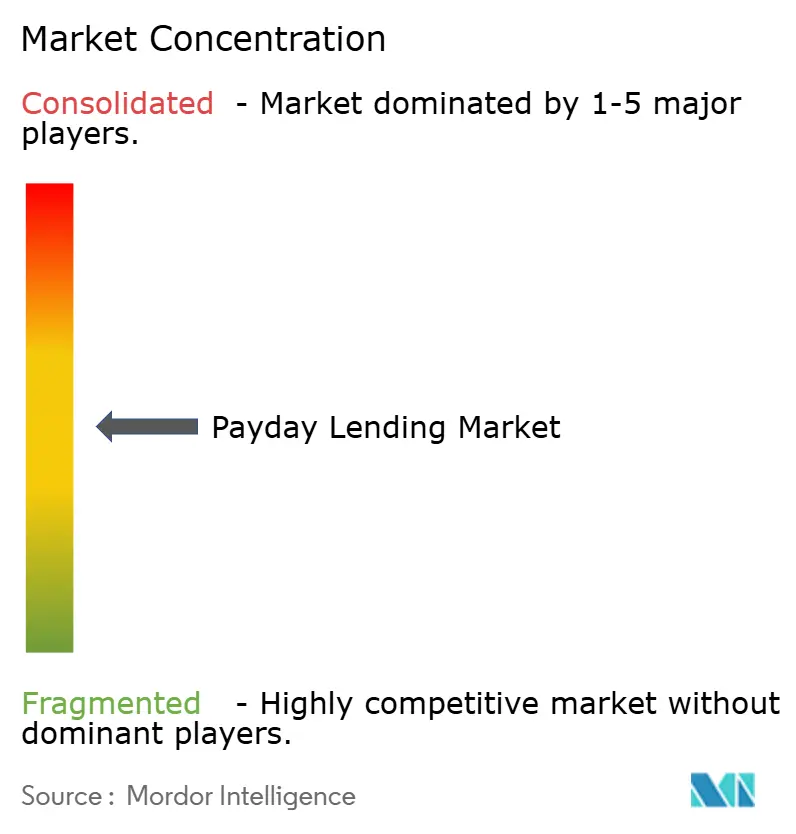
| Market Concentration | Medium |
Major Players *Disclaimer: Major Players sorted in no particular order Image © Mordor Intelligence. Reuse requires attribution under CC BY 4.0. | |
Payday Lending Market Analysis by Mordor Intelligence
The payday lending market size was valued at USD 41.12 billion in 2025 and estimated to grow from USD 43.02 billion in 2026 to reach USD 53.89 billion by 2031, at a CAGR of 4.61% during the forecast period (2026-2031). Digital channels, demographic shifts and selective deregulation underpin this growth even as new Consumer Financial Protection Bureau (CFPB) rules effective March 2025 tighten loan-disclosure requirements. Online platforms already command the largest user base, and artificial-intelligence underwriting is lowering default risk and acquisition cost. Younger borrowers and single-income households continue to rely on short-tenor credit, while regional loan-size cap changes create niche expansion opportunities for compliant lenders. Competitive intensity is rising as banks, fintechs and specialty finance firms respond to shifting consumer preferences and tighter interest-rate ceilings.
Key Report Takeaways
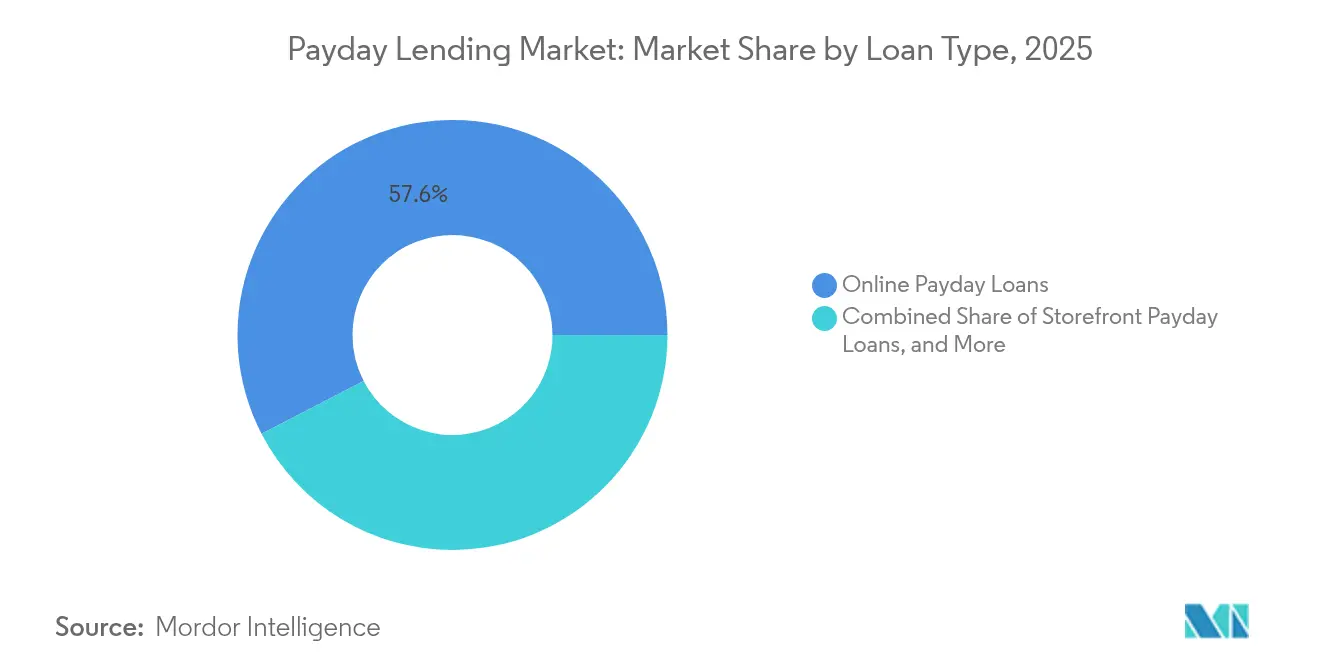
- By loan type, Online Payday Loans led with 57.60% of the payday lending market share in 2025; Hybrid/Omni-channel solutions are projected to expand at a 12.05% CAGR to 2031.
- By age group, the 25-34 cohort captured 29.55% of the payday lending market in 2025, whereas the 18-24 bracket records the highest projected CAGR at 11.1% through 2031.
- By marital status, single borrowers accounted for 47.00% of the payday lending market in 2025 and are growing at a 9.55% CAGR to 2031.
- By distribution channel, Direct-lender Websites controlled 60.10% revenue share in 2025, while Mobile Apps are set to increase at a 15.1% CAGR during 2026-2031.
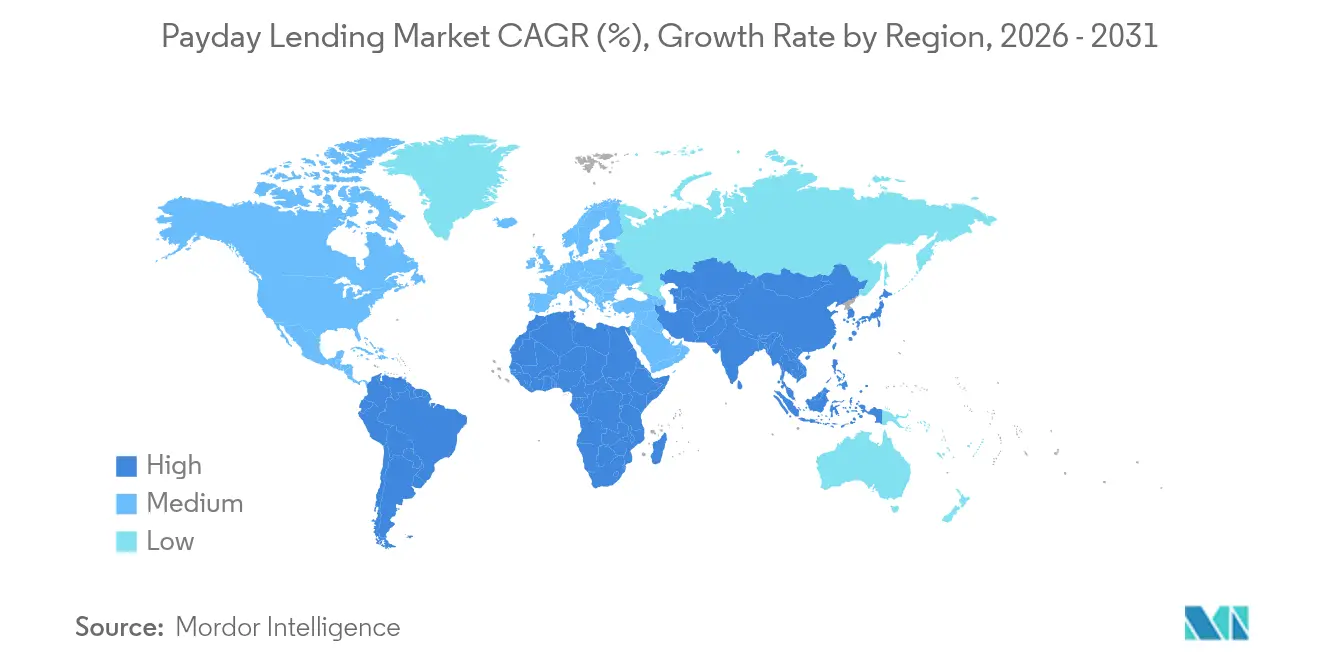
- By geography, North America held 41.60% of the payday lending market in 2025; Asia-Pacific is forecast to post the fastest regional CAGR at 9.95% through 2031.
Note: Market size and forecast figures in this report are generated using Mordor Intelligence’s proprietary estimation framework, updated with the latest available data and insights as of 2026.
Global Payday Lending Market Trends and Insights
Drivers Impact Analysis*
| Driver | (~) % Impact on CAGR Forecast | Geographic Relevance | Impact Timeline |
|---|---|---|---|
| Shift to online and mobile lending platforms | +1.8% | Global, higher in North America and Europe | Medium term (2-4 years) |
| Volatile household incomes driving small-ticket credit demand | +1.2% | Global, higher in emerging economies | Short term (≤2 years) |
| Deregulation in select U.S. states raising loan-size caps | +0.8% | United States | Medium term (2-4 years) |
| Open-banking-based alternative-data underwriting | +1.1% | Europe and North America, emerging in Asia-Pacific | Medium term (2-4 years) |
| Employer-integrated earned-wage-access partnerships | +0.9% | North America and Europe, emerging in Asia-Pacific | Medium term (2-4 years) |
| Expansion of hybrid/omni-channel service models | +0.7% | Global, strongest in multi-branch lenders | Medium term (2-4 years) |
| Source: Mordor Intelligence | |||
Shift to Online and Mobile Lending Platforms
Mobile and web channels are re-shaping how credit is originated, funded and serviced. Consumers favor application turnaround measured in minutes, and lenders that embed biometrics and real-time payroll data can cut operating expense by up to 50% while lowering fraud losses. These efficiencies let providers offer slightly lower fees without eroding margins, even as regulators scrutinize algorithmic bias [1]Consumer Financial Protection Bureau, “Payday, Vehicle Title, and Certain High-Cost Installment Loans Rule – Supervisory Guidance,” consumerfinance.gov.
Volatile Household Incomes Driving Small-Ticket Credit Demand
Gig-economy workers and part-time employees frequently encounter mid-month liquidity gaps. The Federal Reserve logged USD 1.4 billion in outstanding small-dollar loans at end-2023, with a median balance of USD 507 and 70% of borrowers classified sub-prime. Extreme weather events are adding a climate-risk lens to underwriting because repayment rates dip when utilities and medical bills spike.
Deregulation in Select U.S. States Raising Loan-Size Caps
Several U.S. jurisdictions have lifted or indexed principal ceilings, enabling lenders to issue advances up to USD 1,200 for terms as long as 180 days, albeit at triple-digit APRs, according to the Texas Office of Consumer Credit Commissioner [2]Texas Office of Consumer Credit Commissioner, “Texas Credit Access Business Annual Report 2024,” occc.texas.gov. The CFPB’s March 2025 stance to deprioritize enforcement for banks making ≤2,500 loans annually offers community institutions room to pilot higher-ticket products without breaching federal scrutiny.
Open-Banking-Based Alternative-Data Underwriting
Application-programming-interface frameworks let lenders ingest cash-flow data, utility payments and employment records, expanding thin-file borrower eligibility while maintaining portfolio performance. The Bank for International Settlements reports that non-bank intermediaries held 47.2% of global financial assets in 2022, underscoring the systemic importance of robust, tech-enabled risk models.
Restraints Impact Analysis*
| Restraint | (~) % Impact on CAGR Forecast | Geographic Relevance | Impact Timeline |
|---|---|---|---|
| Tighter APR caps and rate-glide-path legislation | −1.2% | Europe and select U.S. states | Medium term (2-4 years) |
| Rising preference for BNPL and overdraft-free wage products | −0.9% | North America and Europe, growing in Asia-Pacific | Medium term (2-4 years) |
| Heightened algorithmic-bias scrutiny by regulators | −0.6% | North America and Europe | Short term (≤2 years) |
| ESG-driven divestment from high-cost lenders | −0.4% | Europe and North America | Long term (≥4 years) |
| Source: Mordor Intelligence | |||
Tighter APR Caps and Rate-Glide-Path Legislation
Canada’s January 2025 reforms cut payday loan fees to 14% of the principal and reduced the criminal interest ceiling to 35% APR, prompting providers to recalibrate revenue models. Forty-five U.S. states also enforce caps, many targeting 36% APR, putting pressure on high-cost operators to pivot toward installment or earned-wage products.
Rising Preference for BNPL and Overdraft-Free Wage Products
Zero-interest installment plans from retailers and fintech-embedded earned-wage advances now compete for the same liquidity-constrained borrower. The CFPB clarified in 2024 that wage advances fall under Truth in Lending Act disclosures, while the UK Treasury plans to mandate affordability checks for BNPL firms by 2026. These shifts dilute addressable volume for the payday lending market and accelerate innovation cycles among incumbents.
*Our forecasts treat driver/restraint impacts as directional, not additive. The impact forecasts reflect baseline growth, mix effects, and variable interactions.
Segment Analysis
By Loan Type: Digital Platforms Dominate Growth Trajectory
Online advances accounted for 57.60% of the payday lending market in 2025 as convenience, privacy and 24-hour disbursement win over storefront traffic. Hybrid channels are set to post a 12.05% CAGR because lenders pair chat-bots with branch pick-up options for users who value face-to-face verification. Regulators view omnichannel models as easier to supervise than cash-only outlets, potentially supporting sustainable scale.
Storefront loans still attract older or rural borrowers but face escalating rent and compliance overhead. Chain consolidation saw Illinois outlet numbers shrink during 2021-2024 as operators exited low-margin zip codes. Nevertheless, strategic clustering persists in lower-income districts where bank branch density is low.


By Age Group: Younger Borrowers Drive Market Momentum
Borrowers aged 25-34 held 29.55% of the payday lending market in 2025, reflecting student-loan loads and starter-salary cash flow gaps. The 18-24 cohort is on an 11.1% CAGR path, propelled by thin credit files that block card access. Lenders, therefore, emphasize in-app education modules to curb default and regulator concern over youth debt traps.
Middle-aged segments use payday credit episodically for medical or car-repair bills, whereas the 55+ bracket shows modest uptake linked to retirement-income shortfalls. FDIC surveys confirm that 34% of 18-34-year-olds used high-cost products within five years, underscoring sustained growth prospects for age-tailored offerings .
By Marital Status: Single Borrowers Face Unique Financial Vulnerabilities
Single adults represented 47.00% of total loan count in 2025 and will grow at a 9.55% CAGR as one-income households lack shared buffers. Lenders calibrate smaller ticket sizes and flexible rollover structures to curb delinquency. Research also shows a high proportion of single mothers among repeat users, which is guiding product design toward fee-transparent installment variants.
Married borrowers are the next-largest group, often bridging utility or childcare expenses until paycheck. Divorced and widowed consumers form a niche segment sensitive to court or medical bills; tailored counseling add-ons improve retention in this cohort.

By Distribution Channel: Mobile Innovation Reshapes Access Patterns
Direct-lender Websites delivered 60.10% of disbursements in 2025 because borrowers prefer dealing with the funder rather than brokers. The mobile-app segment, however, is forecast to rise 15.1% per year as smartphone adoption hits saturation. Push-notification reminders and biometric login elevate repayment discipline, lowering loss ratios for app-first lenders.
Aggregator marketplaces still help rate-shopping users but face margin compression as direct brands strengthen SEO and partner programs. Physical outlets retain relevance for cash pick-up and check-cashing services, though the share will keep sliding as digital IDs gain regulatory acceptance.
Geography Analysis
North America controlled 41.60% of the payday lending market in 2025 amid a patchwork of state rules ranging from Texas’s 662% permissible APR to outright bans in 18 jurisdictions. The CFPB’s current enforcement posture gives small banks breathing room to test sub-prime credit offerings, yet impending federal elections could reverse that stance, injecting policy risk into lender forecasts.
Asia-Pacific is the fastest-growing region at 9.95% CAGR to 2031. India’s Unified Payments Interface and China’s super-app ecosystems allow instant cash-flow verification, enabling risk-based pricing at scale. Regulatory sandboxes in Indonesia and the Philippines further accelerate fintech penetration, presenting outsized upside for cross-border digital lenders.
Europe paints a mixed picture. The UK’s crackdown trimmed the local operator count by more than 80% between 2019 and 2024, leading to a market where price caps and redress schemes dominate strategic dialogue. Meanwhile, Eastern European economies display double-digit growth because traditional bank credit remains under-served. The EU’s 2023 Consumer Credit Directive extends strict creditworthiness tests to small-value loans, signaling future compliance cost escalations across the bloc.

Competitive Landscape
The payday lending market features moderate fragmentation. Enova International grew its online portfolio to nearly USD 4 billion in 2024 and lifted revenue 26% by leveraging machine-learning engines that refresh scorecards daily. Cash America and Check Into Cash follow with omnichannel footprints but are racing to digitize origination funnels.
Fintech challengers such as Dave and Brigit embed wage-advance options inside budgeting apps, eroding first-time borrower inflows traditionally routed to payday storefronts. Banks partner with white-label payday providers to monetize checking-account data, although the FDIC warns that “tip-based” models often camouflage APRs exceeding 300%. MandA appetite remains elevated, as specialty finance consolidators anticipate margin upside from Federal Reserve rate cuts expected later in 2025.
Payday Lending Industry Leaders
Enova International, Inc.
Advance America, Cash Advance Centers, Inc. (Grupo Elektra)
MoneyMart Financial Services (DFC Global Corp.)
Community Choice Financial, Inc.
Speedy Cash
- *Disclaimer: Major Players sorted in no particular order

Recent Industry Developments
- June 2025: Ready Payday Loans introduced a streamlined online submission form to expedite same-day funding for bad-credit borrowers.
- June 2025: The People’s Own Savings Bank rolled out POSB Payday Loan, a fully automated facility offering flexible tenor and real-time approval.
- March 2025: The CFPB confirmed it will not prioritize enforcement of the payment-disclosure provision for lenders with ≤2,500 annual small-dollar loans.
- January 2025: Canada’s revised Criminal Code capped payday loan fees at 14% of the advance and lowered the criminal APR ceiling to 35%.


Research Methodology Framework and Report Scope
Market Definitions and Key Coverage
Our study treats the payday lending market as the total annual value of short-term, small-principal consumer loans, typically under USD 1,500, that must be repaid from the borrower's next paycheck or benefit payment. It bundles both single-payment and installment variants issued through storefronts, direct-lender websites, broker portals, and mobile apps, so long as the loan carries a cost of credit that materially exceeds mainstream personal-loan APRs (>36 %). According to Mordor Intelligence, this market is worth USD 41.12 billion in 2025 and is projected to reach USD 51.68 billion by 2030.
Scope exclusion: earned-wage-access advances, credit-card cash advances, BNPL installments, and pawn transactions are excluded to keep the model focused on regulated payday products only.
Segmentation Overview
- By Loan Type
- Storefront Payday Loans
- Online Payday Loans
- Hybrid / Omni-channel Payday Loans
- By Age Group
- 18 - 24
- 25 - 34
- 35 - 44
- 45 - 54
- 55 +
- By Marital Status
- Single
- Married
- Others
- By Distribution Channel
- Direct-lender Websites
- Marketplace / Broker Platforms
- Mobile Apps
- Physical Stores
- Others
- By Geography
- North America
- United States
- Canada
- Mexico
- South America
- Brazil
- Argentina
- Rest of South America
- Europe
- Germany
- United Kingdom
- France
- Italy
- Spain
- Russia
- Rest of Europe
- Asia-Pacific
- China
- Japan
- India
- South Korea
- Australia and New Zealand
- Rest of Asia-Pacific
- Middle East and Africa
- Middle East
- Saudi Arabia
- United Arab Emirates
- Turkey
- Rest of Middle East
- Africa
- South Africa
- Nigeria
- Egypt
- Rest of Africa
- Middle East
- North America
Detailed Research Methodology and Data Validation
Primary Research
Mordor analysts interviewed payday executives, storefront managers, fintech aggregators, consumer-rights advocates, and state regulators across North America, Europe, Asia-Pacific, and Africa. These conversations clarified typical loan-volume seasonality, online conversion funnels, default ratios, and the practical impact of APR caps, which we used to fine-tune model assumptions.
Desk Research
We compiled macro and regulatory baselines from tier-1 public sources such as CFPB rule filings, FDIC household surveys, the UK FCA high-cost credit dataset, and Eurostat consumer finance tables, then layered in trade-association storefront counts and state-level fee disclosures. Company 10-Ks, US SEC call transcripts, and in-principle approvals posted by central banks supplied lender operating metrics. Proprietary pulls from D&B Hoovers and Dow Jones Factiva helped us vet revenue splits and branch footprints. The sources cited above illustrate, not exhaust, the wider literature our analysts checked.
Market-Sizing & Forecasting
We apply a top-down model that scales reported loan-origination volumes from supervisory filings and household-survey penetration rates; these totals are then cross-checked with sampled average loan size × frequency data from lender interviews. Key drivers, unbanked household share, median real wage volatility, regulatory APR ceilings, online channel mix, and default-adjusted fee yield, feed a multivariate regression that projects demand. Bottom-up revenue roll-ups from a panel of 25 major lenders act as a reasonableness test, and gaps are reconciled where variances exceed three percent.
Data Validation & Update Cycle
Outputs undergo automated variance scans, senior-analyst peer review, and a compliance sign-off. We refresh every twelve months or sooner if rule changes, M&A, or macro shocks shift any leading indicator by ±10 %. Before release, one analyst reruns the latest quarter's inputs to ensure clients receive an up-to-date view.
Why Mordor's Payday Lending Baseline Commands Confidence
Published estimates often diverge because firms pick different value metrics, geographies, and refresh cadences.
Key gap drivers include whether totals reflect gross loan principal (our choice) or only lender fee revenue, inclusion of hybrid online-to-storefront channels, treatment of informal peer-to-peer cash apps, and currency conversion timing. Many studies also extend or curtail coverage of markets that enforce 36 % APR caps, which materially moves the needle.
Benchmark comparison
| Market Size | Anonymized source | Primary gap driver |
|---|---|---|
| USD 41.12 B (2025) | Mordor Intelligence | - |
| USD 35.47 B (2024) | Global Consultancy A | Omits emerging markets and gig-platform lenders, converts at fixed 2023 FX rates |
| USD 5.06 B (2022) | Trade Journal B | Counts only lender fee revenue, focuses on storefront loans, older base year |
These contrasts show that Mordor's disciplined scope, dual validation loops, and annual refresh give decision-makers a balanced, transparent baseline anchored to clearly traceable variables.


Key Questions Answered in the Report
What is the current size of the payday lending market?
The market stands at USD 43.02 billion in 2026 and is forecast to reach USD 53.89 billion by 2031, translating to a 4.61% CAGR.
Which loan type holds the largest share of the payday lending market?
Online Payday Loans led with 57.60% of the payday lending market share in 2025, reflecting consumer preference for digital convenience.
Which age group is growing the fastest in payday lending usage?
Borrowers aged 18-24 are projected to grow at an 11.1% CAGR between 2026 and 2031 due to limited credit history and rising living costs.
How are new regulations affecting payday lenders in North America?
Canada’s 2025 interest-rate caps and the CFPB’s selective enforcement stance in the United States are pushing lenders to adapt pricing and compliance strategies while creating opportunities for smaller community lenders.
Why are mobile apps critical for future growth?
Mobile Apps are expected to expand at a 15.1% CAGR through 2031 because they enable real-time credit decisioning, lower customer acquisition costs and align with consumers’ smartphone-centric habits.
What competitive strategies are leading firms using?
Market leaders like Enova International deploy artificial-intelligence underwriting, invest in omnichannel delivery and pursue acquisitions to scale portfolios and diversify risk.
Page last updated on:


