Patient Portal Market Size and Share
Market Overview
| Study Period | 2020 - 2031 |
|---|---|
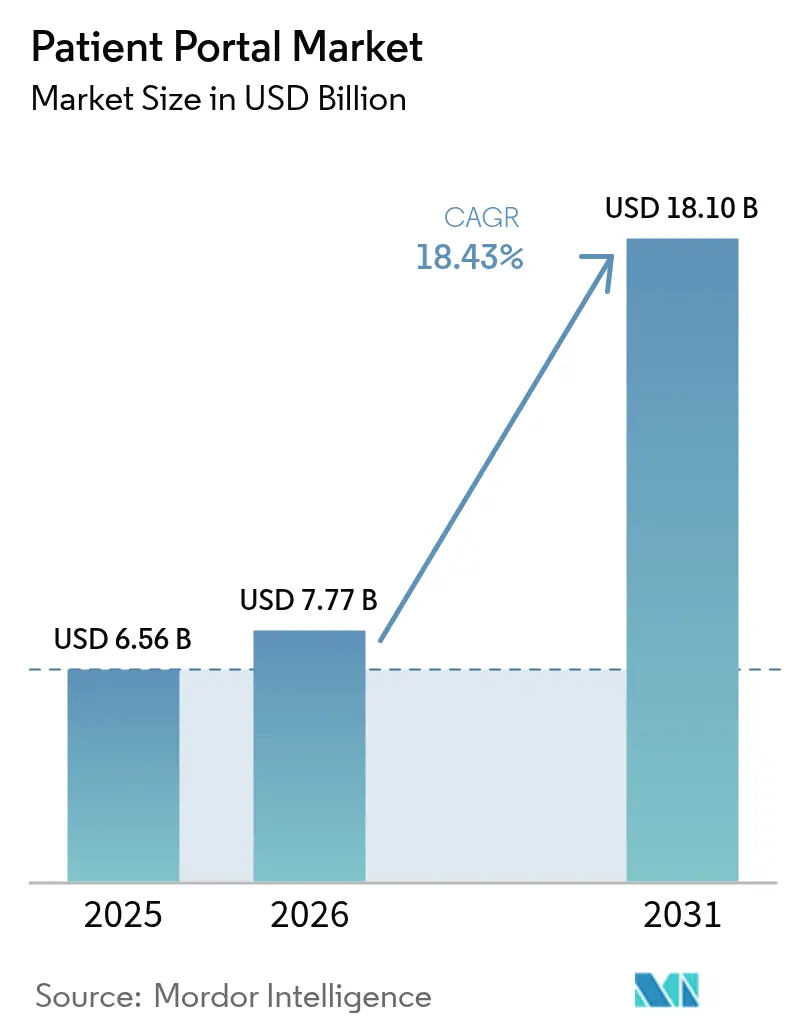
| Market Size (2026) | USD 7.77 Billion |
| Market Size (2031) | USD 18.10 Billion |
| Growth Rate (2026 - 2031) | 18.43% CAGR |
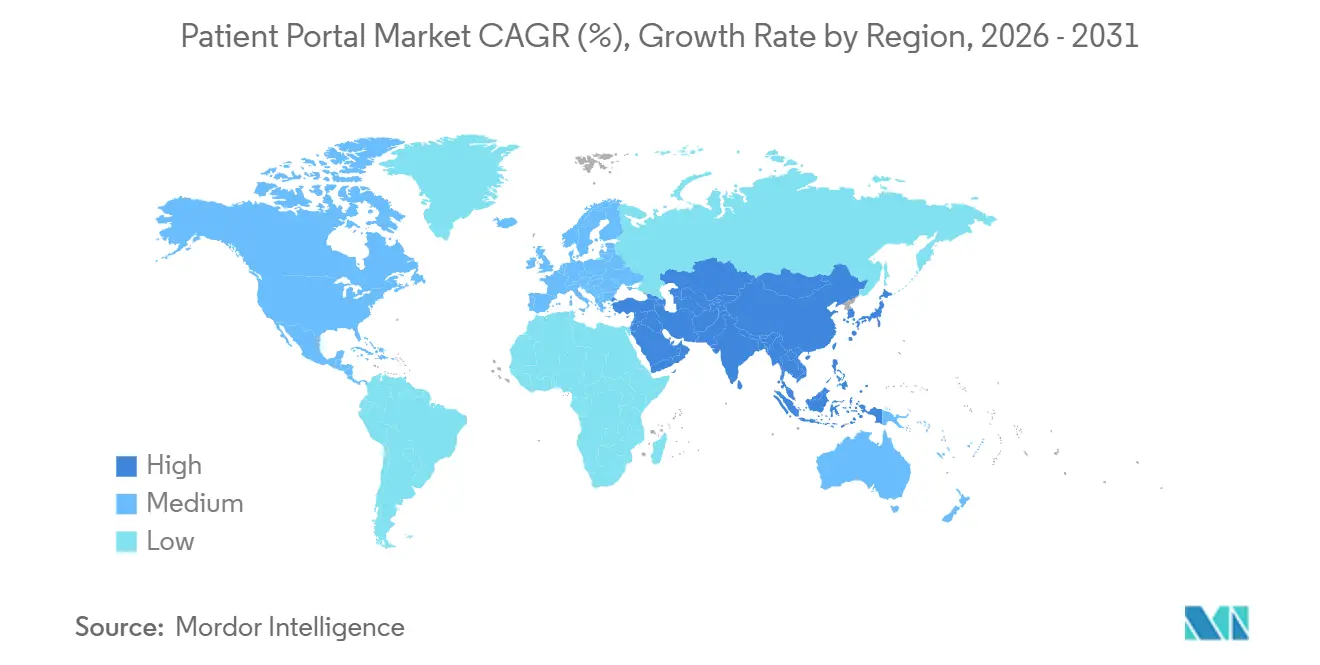
| Fastest Growing Market | Asia-Pacific |
| Largest Market | North America |
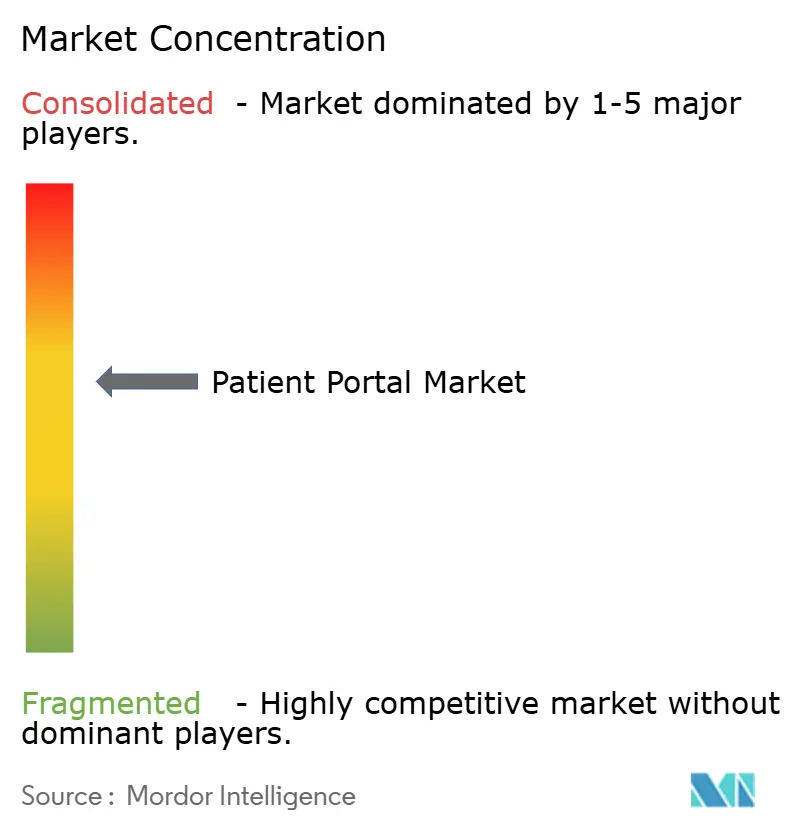
| Market Concentration | Medium |
Major Players *Disclaimer: Major Players sorted in no particular order Image © Mordor Intelligence. Reuse requires attribution under CC BY 4.0. | |
Patient Portal Market Analysis by Mordor Intelligence
The Patient Portal Market size is projected to expand from USD 6.56 billion in 2025 and USD 7.77 billion in 2026 to USD 18.10 billion by 2031, registering a CAGR of 18.43% between 2026 to 2031.
Driven by stricter federal and international interoperability mandates, payer requirements for documented digital engagement, and growing consumer demand for on-demand health access, health portals are transitioning from optional features to critical infrastructure. Integrated platforms continue to dominate enterprise health systems due to bundled licensing that reduces switching costs. However, standalone solutions are scaling rapidly as ambulatory centers and retail clinics adopt modular deployments to avoid costly and extensive EHR overhauls. Concurrently, cloud migration is reshaping cost structures. Hyperscale vendors now offer HIPAA-compliant reference architectures, providing elastic computing, audited security controls, and a lower five-year total cost of ownership than on-premises systems. The competitive landscape exhibits moderate rivalry. Established EHR vendors protect their market share through network effects, while venture-backed specialists gain traction by embedding payment solutions, streamlining intake processes, and leveraging AI-driven triage to optimize administrative workflows.
Key Report Takeaways
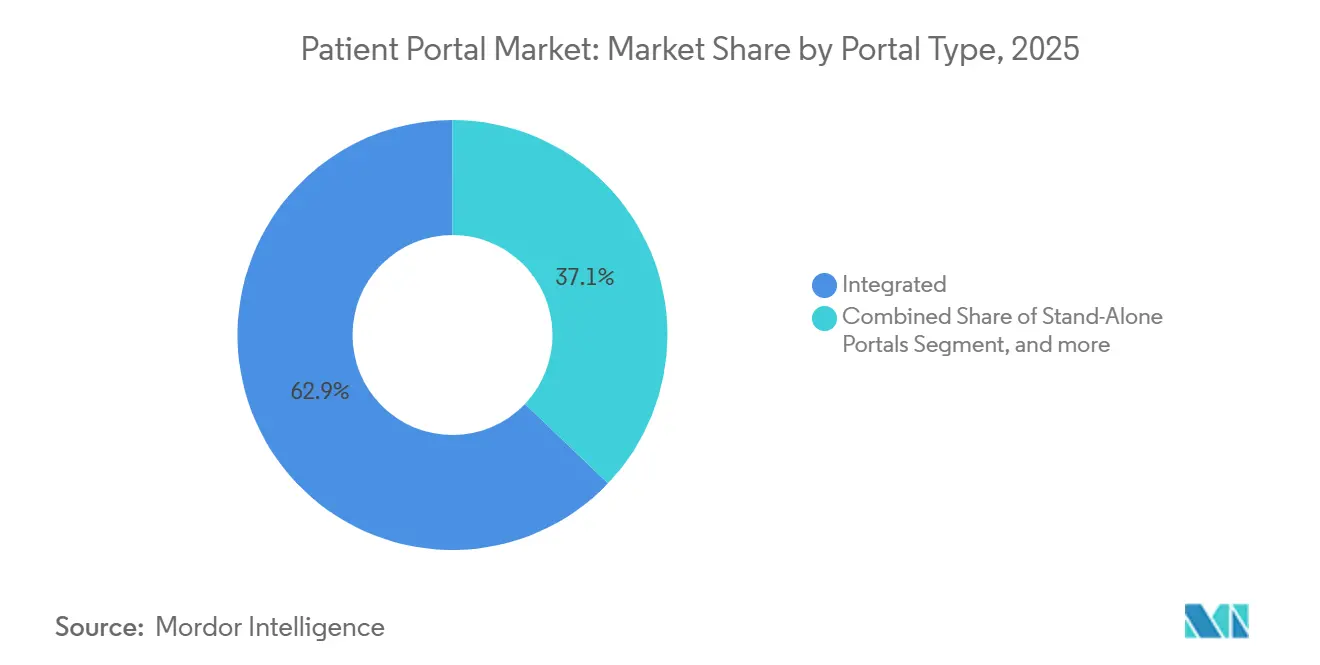
- By portal type, integrated platforms led with 62.88% revenue share in 2025, while standalone portals are advancing at a 20.54% CAGR through 2031.
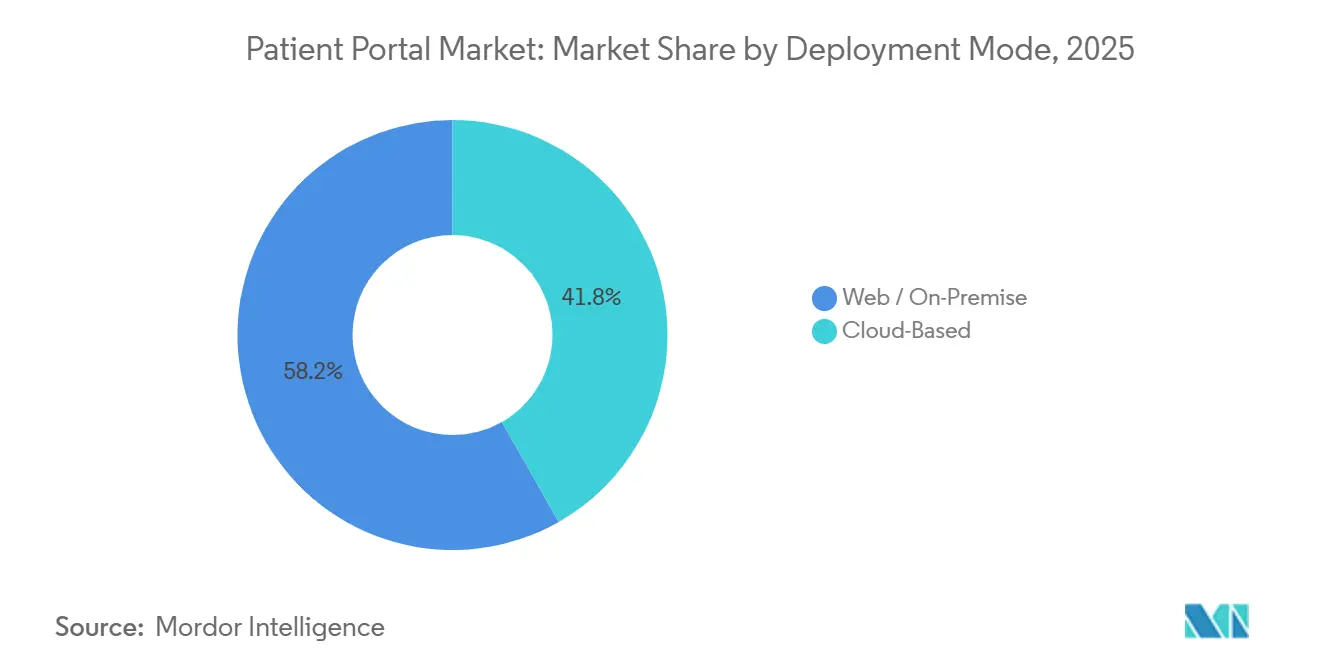
- By deployment mode, web/on-premise systems accounted for 58.23% of the patient portal market share in 2025, yet cloud-based portals are forecast to expand at a 20.78% CAGR through 2031.
- By end user, providers held 72.65% of the patient portal market size in 2025, and payers are growing at a 21.32% CAGR to 2031.
- By geography, North America accounted for 44.32% of revenue in 2025, whereas Asia-Pacific is projected to grow at a 19.65% CAGR through 2031.
Note: Market size and forecast figures in this report are generated using Mordor Intelligence’s proprietary estimation framework, updated with the latest available data and insights as of 2026.
Global Patient Portal Market Trends and Insights
Driver Impact Analysis*
| Driver | (~) % Impact on CAGR Forecast | Geographic Relevance | Impact Timeline |
|---|---|---|---|
| Federal interoperability & Meaningful-Use mandates | +4.2% | North America & EU | Medium term (2-4 years) |
| Rising consumer demand for digital front-door access | +3.8% | Global | Short term (≤ 2 years) |
| Rapid shift to cloud-hosted EHR ecosystems | +3.1% | Global, with early gains in North America, APAC | Medium term (2-4 years) |
| Reimbursement incentives for value-based care models | +2.9% | North America core, spill-over to EU | Long term (≥ 4 years) |
| AI-driven hyper-personalized education modules | +2.4% | North America & APAC core | Medium term (2-4 years) |
| FHIR-enabled "plug-in" app marketplace momentum | +1.8% | Global | Long term (≥ 4 years) |
| Source: Mordor Intelligence | |||
Government Interoperability Regulations
Nationwide frameworks such as the Trusted Exchange Framework and Common Agreement in the United States and the European Health Data Space in the EU require certified EHRs to publish standardized APIs that expose clinical data without special effort. Vendors now face commoditized data access and must differentiate on analytics or user experience. Smaller suppliers lacking API capacity are exiting or merging, whereas Epic Systems and Oracle Health leverage existing FHIR infrastructure to upsell advanced analytics modules. Payers increasingly exploit transparent data flows; one leading U.S. insurer realized USD 340 million in administrative savings after automating prior authorizations through open APIs[1]Office of the National Coordinator for Health IT, “Trusted Exchange Framework and Common Agreement,” healthit.gov.
Consumer Demand for Digital Healthcare Access
Smartphone-centric behavior is setting new service benchmarks. A 2025 Pew survey confirmed that 68% of U.S. adults under 50 expect same-day appointment booking and real-time prescription refills via mobile apps[2]Pew Research Center, “Public Expectations for Digital Health Services,” pewresearch.org. India’s Ayushman Bharat Digital Mission has 450 million registered users who access portals tied to a national health identifier, illustrating how government mandates align with consumer expectations. Retail pharmacy chains respond by embedding full-service portals that boosted digital engagement 19% year over year, eroding patient loyalty to traditional practices.
Cloud Adoption in Healthcare IT Systems
A Deloitte analysis found 23% five-year cost savings when EHR workloads move to hyperscale cloud platforms, mainly by retiring on-site data centers. All three major cloud providers hold HITRUST certification and publish HIPAA reference blueprints, mitigating historical compliance objections. Oracle Health’s cloud-native Cerner Millennium now loads 95% of patient transactions in under one second after migrating from local servers. Community hospitals take advantage of per-transaction SaaS pricing that eliminates capital budgets and accelerates deployment.
Shift Toward Value-Based Reimbursement Models
Medicare’s Merit-based Incentive Payment System now awards bonuses for “digital access,” incentivizing providers to raise portal activation and message response rates within 72 hours. Private payers mirror the trend: one major insurer ties 8% of reimbursement to engagement scores. Cleveland Clinic lifted portal registration from 54% to 71% through multilingual outreach, securing an extra USD 12 million in quality payments, proving that digital engagement now carries direct revenue implications.
Restraint Impact Analysis*
| Restraint | (~) % Impact on CAGR Forecast | Geographic Relevance | Impact Timeline |
|---|---|---|---|
| Cyber-security & privacy breaches | -2.8% | Global | Short term (≤ 2 years) |
| Low digital/health literacy in elderly cohorts | -1.9% | Global, with higher impact in rural areas | Long term (≥ 4 years) |
| Clinician message-overload burnout | -1.4% | North America & EU | Medium term (2-4 years) |
| Misaligned reimbursement for asynchronous visits | -1.1% | North America core | Medium term (2-4 years) |
| Source: Mordor Intelligence | |||
Data Security and Privacy Concerns
The U.S. Department of Health and Human Services logged 725 large-scale breaches in 2024, with portals implicated in 18% due to credential stuffing and session hijacking[3]U.S. Department of Health and Human Services, “Breach Portal Annual Report 2024,” hhs.gov. Europe’s NIS2 Directive requires 24-hour incident reporting and imposes fines up to 2% of global revenue, increasing vendor compliance costs. FaceID authentication, introduced by Epic in late 2025, reduces account takeovers by 34% but increases development complexity for smaller providers. A 2025 Kaiser survey indicates that 41% of adults avoid portals due to privacy concerns, slowing adoption among key demographics.
Digital Divide Among Elderly and Rural Populations
The FCC reports 19% of rural Americans still lack 25 Mbps broadband, undermining video consult reliability. Portal registration among adults 65+ lags the average by 22 percentage points. Clinical impact is tangible; lower portal use correlates with higher preventable hospitalization rates. Governments and health systems pilot kiosks and telephone navigators, yet these measures raise administrative overhead without closing infrastructure gaps.
*Our forecasts treat driver/restraint impacts as directional, not additive. The impact forecasts reflect baseline growth, mix effects, and variable interactions.
Segment Analysis
By Portal Type: Integrated Platforms Dominate Through EHR Lock-In
Integrated offerings commanded 62.88% of the patient portal market in 2025 as enterprise health systems accept bundled portals within EHR license fees. The patient portal market size for integrated solutions is forecast to maintain high absolute revenue, even as it cedes relative share to nimble standalone entrants. Standalone portals, projected to deliver a 20.54% CAGR, benefit from FHIR-based data exchange, which removes historical barriers to vendor swaps. Ambulatory surgery centers, specialty clinics, and retail chains increasingly adopt modular portals that prioritize billing clarity, real-time eligibility checks, and rapid go-live cycles. As a result, the competitive landscape bifurcates: large integrated delivery networks extend bundled contracts, whereas smaller organizations adopt best-of-breed apps.
Standalone suppliers validate demand for specialization. Cedar shortens payment cycles by embedding transparent estimates and flexible plans, while Phreesia automates check-in and intake to lift front-desk throughput 18%. These focused wins attract investors and expand total addressable opportunities, even in hospitals that retain integrated portals for clinical charts but overlay standalone applications for revenue-cycle or intake workflows. Regulatory insistence on open APIs erodes proprietary data moats, ensuring ongoing contest between breadth and specialization inside the patient portal market.


By Deployment Mode: Cloud Economics Reshape Infrastructure Decisions
Web/on-premise deployments held 58.23% of the patient portal market share in 2025, but cloud portals are expected to post the fastest growth at a 20.78% CAGR. Health systems pursuing cloud platforms cite automatic scaling, baked-in disaster recovery, and audited security controls as decisive advantages. The patient portal market size tied to cloud implementations rises steadily as mid-tier hospitals shift to SaaS subscriptions, converting capital expenditures into operating expenses. Cloud launches now include per-user or per-transaction pricing, appealing to budget-constrained community sites that previously delayed portal upgrades.
Yet on-premises solutions persist where data-science teams need immediate local access to imaging repositories or where government accreditation rules require FedRAMP High authorizations. Academic medical centers sometimes absorb higher maintenance costs to avoid outbound data fees on research-grade datasets. Hybrid architectures are emerging: transactional traffic resides in the cloud, while de-identified research copies stay on campus clusters, giving institutions flexibility without full forklift migrations.
By End User: Provider Dominance Faces Payer Segment Disruption
In 2025, providers accounted for 72.65% of the patient portal market, driven by compliance with meaningful-use requirements and the critical role of EHR connectivity in daily clinical operations. However, payer portals are experiencing significant growth, with a 19.65% CAGR, as insurers increasingly implement features such as self-service cost estimators and medication-adherence alerts. Additionally, retail pharmacies and grocery-based clinics are using loyalty programs to drive customers to their branded portals, further diversifying market demand. These trends indicate a gradual decline in provider dominance, enabling payers to gain greater influence over feature development and market standards.
Hospitals typically enter into multi-year contracts that require stringent uptime guarantees, while payers prefer flexible, API-driven portals that integrate claims data with wellness incentives. This divergence in priorities is driving intensified competition among platform vendors, each striving to differentiate their offerings and capture market share.
Geography Analysis
North America generated 44.32% of global revenue in 2025 as Medicare and commercial insurers embed digital access metrics into reimbursement contracts, transforming portal activation into a revenue lever. Practices achieving top-quartile engagement receive USD 48,000 more in quality bonuses each year than bottom-quartile peers. Canada pilots similar incentives, while Mexico’s public insurer enrolled 18 million users within its first year but struggles with rural adoption.
Asia-Pacific is set to be the fastest expanding region at 19.65% CAGR through 2031. India’s national mission compels every empaneled hospital to maintain a portal connected to a universal health identifier, driving large-scale, cloud-native implementations. China integrates portals with social-credit and reimbursement systems, reducing claim cycles from 30 days to 3 days. Australia operates a government backbone that supports 24 million citizens, although a 2024 breach dampened new registrations. South Korea sets a 2026 deadline for tertiary hospitals to adopt FHIR-compliant portals, reflecting regional commitment to standards.
Europe faces moderate momentum because GDPR compliance elevates development expense and health systems remain fragmented. The European Health Data Space standardizes cross-border access, but disparate reimbursement structures slow nationwide deployments. Outside Europe, Gulf Cooperation Council states weave portals into smart-city agendas, while Brazil’s national system enrolls 150 million users yet contends with data-quality variability.

Competitive Landscape
Epic Systems and Oracle Health together control about 55% of integrated deployments, yielding network advantages that increase switching costs. Epic’s 305 million global MyChart accounts allow a single login across any Epic facility, reinforcing user stickiness. Oracle Health patents context-aware notification engines that reduce alert noise, signaling investments in usability enhancements. The patient portal market, therefore, shows moderate concentration yet growing fragmentation in ancillary segments.
Challengers compete on depth rather than breadth. Cedar compresses patient payment timelines by 30%, Phreesia automates intake across 3,500 practices, and Luma Health personalizes outreach to raise appointment adherence. Consumer-tech aggregators such as Apple and Google capture the longitudinal record layer, forcing traditional vendors to prioritize experience over exclusivity. Vendors increasingly differentiate through analytics, payment automation, and AI-enabled triage rather than on possession of core clinical data alone, shifting the competitive battlegrounds within the patient portal market.
Patient Portal Industry Leaders
Allscripts Healthcare Solutions Inc.
McKesson Corporation
CureMD Healthcare
Athenahealth, Inc.
Oracle (Cerner Corporation)
- *Disclaimer: Major Players sorted in no particular order

Recent Industry Developments
- November 2025: Salinas Valley Health launched a new era of coordinated, patient-centered care across its entire network with the launch of MyChart at Salinas Valley Health Medical Center. The expansion of MyChart connects hospital services with Salinas Valley Health’s extensive network of primary and specialty clinics — giving patients complete access to every record in one place.
- October 2025: MediRecords announced the public launch of Engage, its new patient portal designed to improve communication, safety, and convenience in healthcare.
- April 2025: NaphCare, Inc., one of the leading correctional healthcare company developed the MyCare Patient Portal to improve access to care and provide patients 24/7 visibility into their personal health information.


Global Patient Portal Market Report Scope
As per the scope of the report, the patient portal is a web-based access point connected to electronic health records (EHR) systems and focuses on patient access to those records. The patients may share their health information and communicate remotely. These allow patients to look into various data points. Some portals allow patients to check medical history data and view demographics.
The Patient Portal Market is Segmented by Portal (Integrated Patient Portal and Standalone Patient Portal), Deployment Mode (Cloud-based and On-Premise and Web-based), End-User (Hospitals and Clinics, Pharmacies, and Other End-Users), and Geography (North America (United States, Canada, and Mexico), Europe (United Kingdom, Germany, France, Italy Spain, and Rest of Europe) Asia-Pacific (China, Japan, India, Australia, South Korea, and Rest of Asia-Pacific), Middle East and Africa (GCC, South Africa, and Rest of Middle East and Africa), and South America (Brazil, Argentina, and Rest of South America)). The market report also covers the estimated market sizes and trends for 17 countries across major regions globally. The report offers the value (in USD million) for the above segments.
| Integrated Portals |
| Stand-Alone Portals |
| Web / On-Premise |
| Cloud-Based |
| Providers (Hospitals, Clinics, IDNs) |
| Payers |
| Pharmacies & Retail Health |
| Other End Users |
| North America | United States |
| Canada | |
| Mexico | |
| Europe | Germany |
| United Kingdom | |
| France | |
| Italy | |
| Spain | |
| Rest of Europe | |
| Asia-Pacific | China |
| Japan | |
| India | |
| Australia | |
| South Korea | |
| Rest of Asia-Pacific | |
| Middle East & Africa | GCC |
| South Africa | |
| Rest of Middle East & Africa | |
| South America | Brazil |
| Argentina | |
| Rest of South America |
| By Portal Type | Integrated Portals | |
| Stand-Alone Portals | ||
| By Deployment Mode | Web / On-Premise | |
| Cloud-Based | ||
| By End User | Providers (Hospitals, Clinics, IDNs) | |
| Payers | ||
| Pharmacies & Retail Health | ||
| Other End Users | ||
| Geography | North America | United States |
| Canada | ||
| Mexico | ||
| Europe | Germany | |
| United Kingdom | ||
| France | ||
| Italy | ||
| Spain | ||
| Rest of Europe | ||
| Asia-Pacific | China | |
| Japan | ||
| India | ||
| Australia | ||
| South Korea | ||
| Rest of Asia-Pacific | ||
| Middle East & Africa | GCC | |
| South Africa | ||
| Rest of Middle East & Africa | ||
| South America | Brazil | |
| Argentina | ||
| Rest of South America | ||


Key Questions Answered in the Report
What revenue will patient portal market reach by 2031?
The sector is forecast to generate USD 18.10 billion by 2031 on an 18.43% CAGR from 2026.
Which portal type grows fastest to 2031?
Standalone portals, favored by ambulatory and specialty clinics, are projected to advance at a 20.54% CAGR.
Why are cloud-based portals displacing on-premise systems?
Hospitals gain 20-25% total-cost savings, elastic scaling, and audited security by adopting hyperscale cloud platforms.
How do payers influence portal adoption?
Value-based contracts now allocate up to 8% of reimbursement to engagement metrics captured through member portals.
What is the main barrier to wider portal use among seniors?
Broadband gaps and low digital literacy leave registration rates 22 percentage points below the national average.
Which companies dominate integrated deployments?
Epic Systems and Oracle Health together control roughly 55% of integrated portal revenue.
Page last updated on:


