Paraxylene (PX) Market Size and Share
Market Overview
| Study Period | 2021 - 2031 |
|---|---|
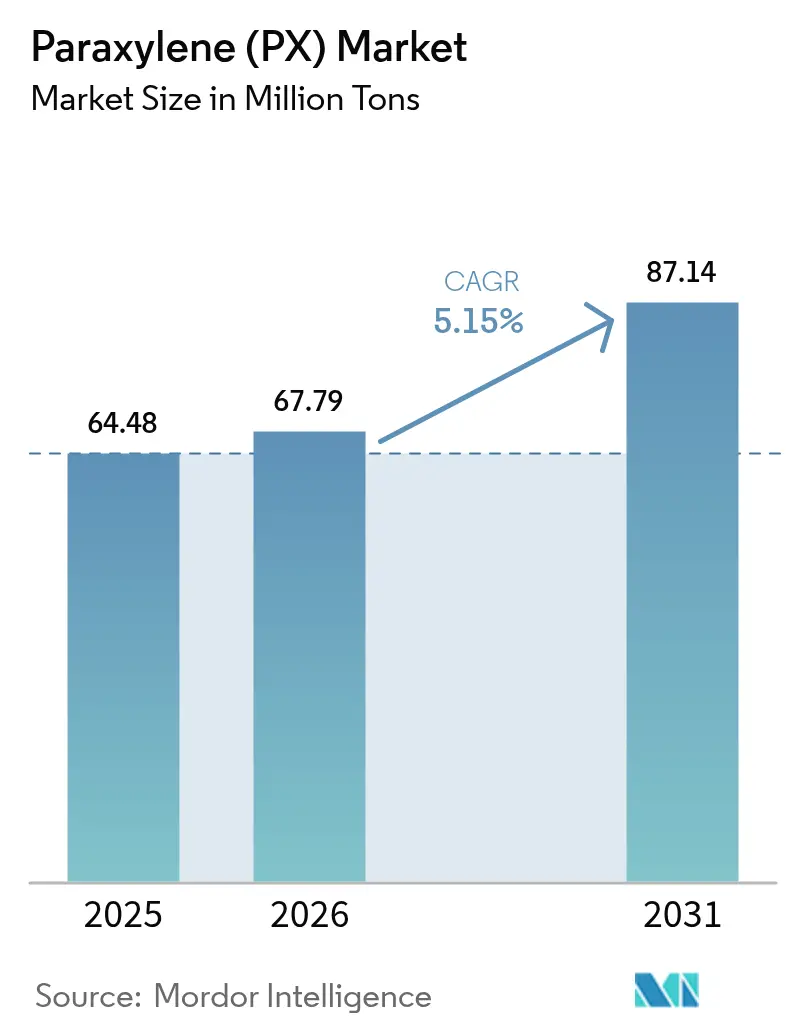
| Market Volume (2026) | 67.79 Million tons |
| Market Volume (2031) | 87.14 Million tons |
| Growth Rate (2026 - 2031) | 5.15% CAGR |
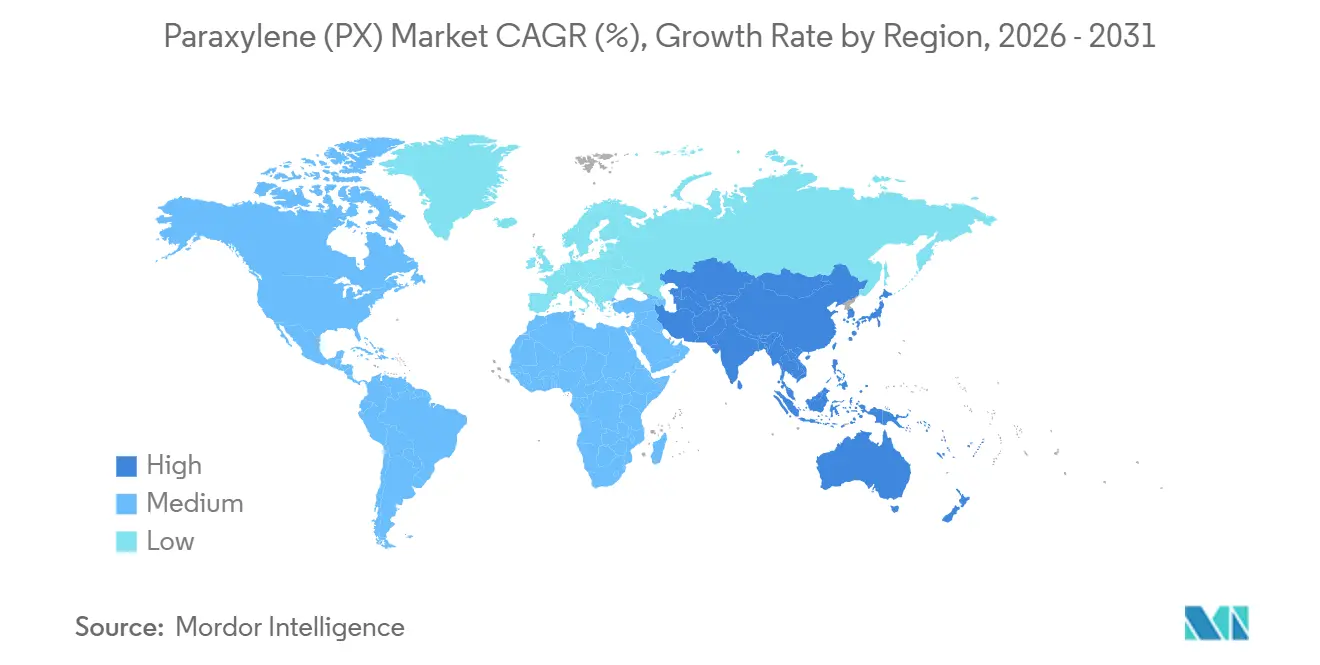
| Fastest Growing Market | Asia Pacific |
| Largest Market | Asia Pacific |
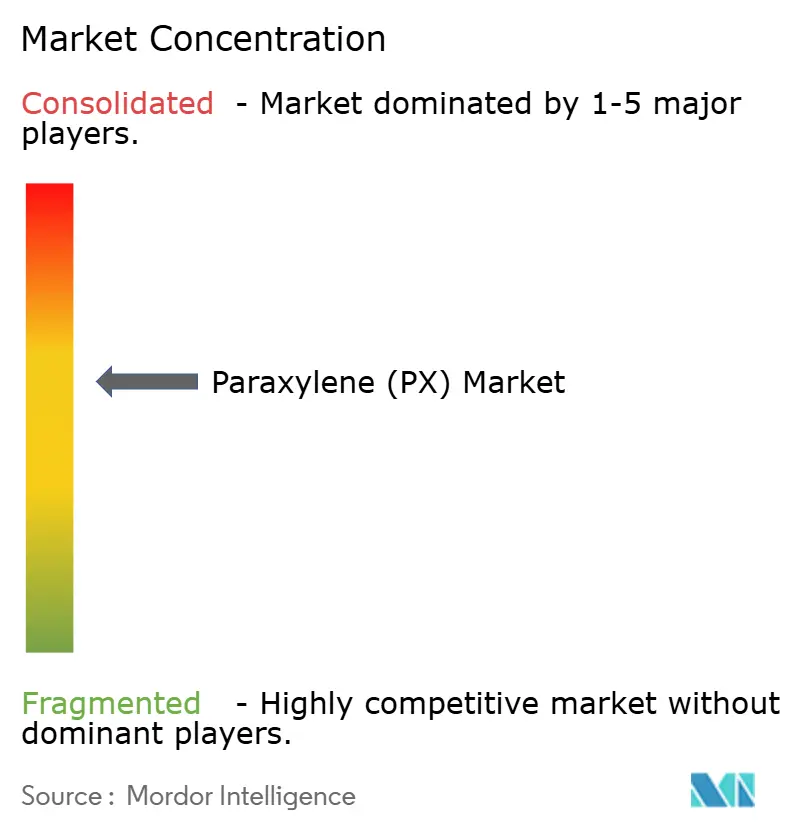
| Market Concentration | Medium |
Major Players *Disclaimer: Major Players sorted in no particular order Image © Mordor Intelligence. Reuse requires attribution under CC BY 4.0. | |
Paraxylene (PX) Market Analysis by Mordor Intelligence
The Paraxylene Market size is projected to be 64.48 million tons in 2025, 67.79 million tons in 2026, and reach 87.14 million tons by 2031, growing at a CAGR of 5.15% from 2026 to 2031. In 2025, Asia-Pacific contributed 82.21% of global volume and remains the engine of capacity growth, helped by large crude-to-chemicals complexes that insulate producers from standalone naphtha-cracker volatility. Downstream polyester demand continues to outpace recycling infrastructure, so virgin feedstock stays resilient even as the European Union and several U.S. states impose recycled-content mandates. Before 2030, integrated producers in China, India, and the Middle East are set to establish new PX capacity. In contrast, legacy exporters from South Korea and Japan are reducing operations to mitigate margin losses. Meanwhile, technology enhancements—such as continuous catalyst regeneration reformers, simulated-moving-bed adsorption, and full-isomerization loops—boost yields and reduce cash costs. This enables efficient producers to navigate tighter PX-naphtha spreads.
Key Report Takeaways
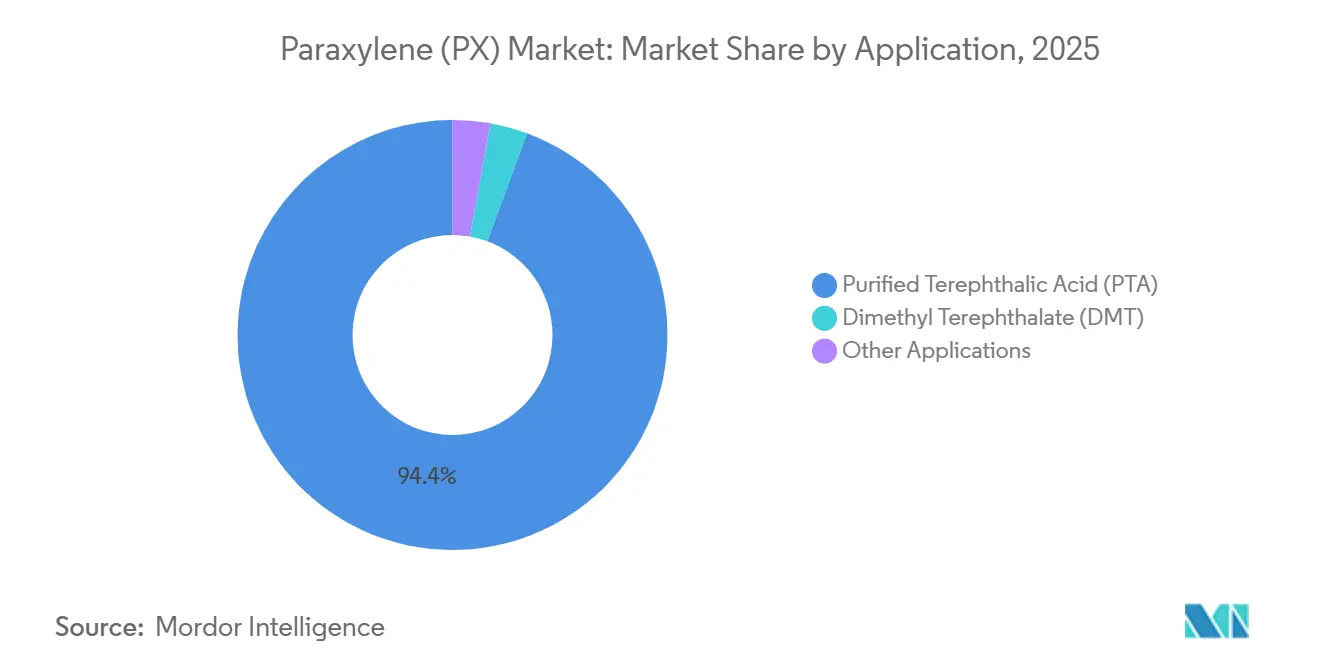
- By application, purified terephthalic acid captured 94.37% of the Paraxylene market share in 2025; the purified terephthalic acid segment is forecast to expand at a 5.37% CAGR through 2031.
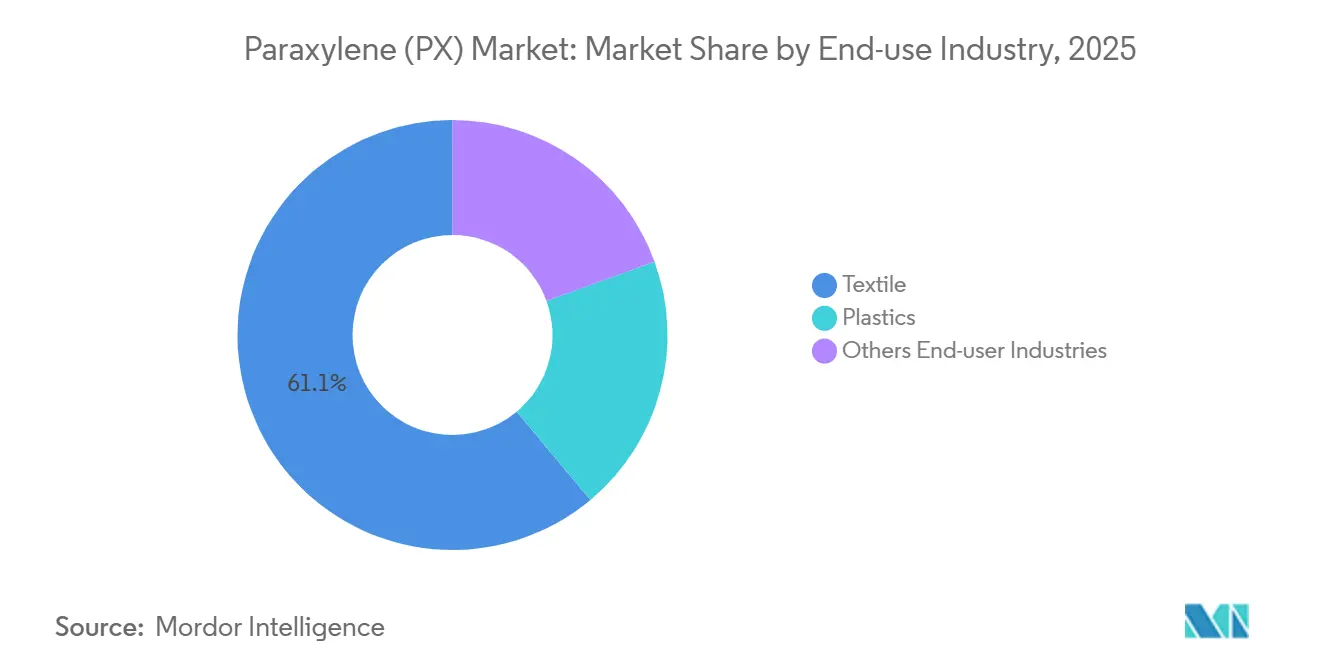
- By end-user industry, textiles led with 61.09% revenue contribution in 2025, whereas plastics posted the fastest trajectory at a 6.15% CAGR through 2031.
- By geography, Asia-Pacific commanded 82.21% of global volume in 2025 and is anticipated to grow at a 5.49% CAGR to 2031.
Note: Market size and forecast figures in this report are generated using Mordor Intelligence’s proprietary estimation framework, updated with the latest available data and insights as of 2026.
Global Paraxylene (PX) Market Trends and Insights
Drivers Impact Analysis*
| Drivers | (~) % Impact on CAGR Forecast | Geographic Relevance | Impact Timeline |
|---|---|---|---|
| Surging demand for PET packaging | +1.2% | Global, with concentration in Asia-Pacific and Europe | Medium term (2–4 years) |
| Polyester-fiber expansion in Asia | +1.5% | Asia-Pacific core, spill-over to Middle East and Africa | Long term (≥4 years) |
| Commercialization of high-yield CCR/PRT aromatics units | +0.8% | Global, led by China and Middle East | Medium term (2–4 years) |
| Government-backed paraxylene self-sufficiency programs in India | +0.6% | India, with regional implications for South Asia | Long term (≥4 years) |
| Simulated-moving-bed (SMB) revamp boosting paraxylene yield | +0.5% | Global, brownfield sites in Asia-Pacific and North America | Short term (≤2 years) |
| Source: Mordor Intelligence | |||
Surging Demand for PET Packaging
Brand-owner commitments, urban expansion, and a swift rise in cold-chain logistics are driving up the demand for PET bottles, even as recycling targets become more stringent. The European Union's Regulation 2025/40 mandates a recycled-content threshold by 2030[1]European Union, “Regulation (EU) 2025/40,” eur-lex.europa.eu. Yet, in 2023, only a portion of PET bottles collected in Europe were recycled, resulting in a reliance on virgin PTA to bridge the gap. Meanwhile, collection rates in India, Indonesia, and Vietnam remain low. Consequently, new PTA plants in these nations continue to be centered around prime PX feed. Global PTA nameplate capacity is set to rise significantly in the coming years, signaling robust confidence in packaging demand[2]U.S. Energy Information Administration, “Short-Term Energy Outlook,” eia.gov. Petrochemical feedstock demand is projected to grow between 2023 and 2030, highlighting the sector's resilience. While beverage producers are exploring bio-PX pathways, their commercial availability is still confined to pilot volumes, ensuring virgin material's dominance for the remainder of the decade.
Polyester-Fiber Expansion in Asia
Forecasts indicate a surge in global polyester staple fiber consumption, projected to rise significantly by 2030. This uptick is largely driven by increasing disposable incomes and the rapid pace of fast-fashion supply chains. In 2023, China achieved a notable milestone, reaching high self-sufficiency in paraxylene (PX). However, downstream yarn producers, Hengyi and Tongkun, are aggressively expanding their operations to capitalize on these cost advantages. Meanwhile, India's ambitious refining-petrochemical integration strategy is set to introduce substantial crude capacity by FY 2029–30. This move not only reroutes naphtha streams into aromatics but also amplifies the nation's domestic PX production. To put this into perspective, every significant diversion of naphtha translates to an augmentation in PX capacity. Thus, adjustments in Asian refinery configurations have a direct ripple effect on upstream supply. Furthermore, this vertical integration acts as a buffer against spot-price fluctuations. Captive PTA users, by securing feed through long-term contracts, further solidify Asia's position as the dominant hub of the Paraxylene market.
Commercialization of High-Yield CCR/PRT Aromatics Units
New crude-to-PX complexes are leveraging continuous catalyst regeneration reformers, Eluxyl adsorption, and Oparis full-isomerization loops to boost PX yields and reduce cash costs. Hengli Petrochemical’s plant on Changxing Island serves as a prime example: three CCR reformers feed into dual purification trains, achieving a PX purity exceeding 99.9%. Following this trend, the licensor clinched new awards over the subsequent period, underscoring the market's enthusiasm for integrated refinery-petrochemical platforms. These projects, by sidestepping merchant naphtha markets and harnessing the entire value chain, mitigate earnings volatility. This adoption is gaining traction in the Middle East, allowing exporters to shift focus from fuels to chemicals, thereby safeguarding long-term crude demand.
Government-Backed Paraxylene Self-Sufficiency Programs in India
In a bid to slash its import bill, New Delhi allocated funds in FY 2024–25 for refinery and PX capacity. ONGC is set to introduce a PX unit with a significant capacity, while IOCL’s expansion at Paradip will add another substantial amount to the market later this decade. Aligning with China's directive to "reduce fuels and increase chemicals," the national policy now emphasizes chemical yield over transport fuels. As compliance with ISO 9001 and Bureau of Indian Standards specifications becomes the norm, smaller players face pressure to either upgrade or exit the market. Domestic polyester manufacturers are optimistic about the shift; while freight and duty costs on imported PX have been squeezing margins, a localized supply promises to bolster long-term competitiveness.
Restraints Impact Analysis*
| Restraints | (~) % Impact on CAGR Forecast | Geographic Relevance | Impact Timeline |
|---|---|---|---|
| Single-use-plastic legislation tightening | -0.4% | Europe and North America, emerging in Asia | Medium term (2–4 years) |
| Crude-oil-led feedstock price volatility | -0.6% | Global | Short term (≤2 years) |
| US–China tariff risk disrupting PX/PTA trade flows | -0.3% | North America and Asia-Pacific bilateral routes | Short term (≤2 years) |
| Source: Mordor Intelligence | |||
Single-Use-Plastic Legislation Tightening
By 2030, the European Union has set a target of mandating recycled content in PET bottles, with an ambitious increase by 2040. In the U.S., California's SB-54 enforces a similar mandate. Europe's mechanical recycling capacity currently falls short of the required levels to meet the 2030 target. This gap suggests a significant reduction in the use of virgin resin, should the supply align with targets. Brand owners are also navigating design-for-recycling mandates and bans on PFAS, potentially leading to a decrease in PET usage per package. While enforcement timelines differ, the overarching policy direction limits growth in developed markets, steering producers towards chemical recycling or bio-PX alternatives. Currently, while demand in OECD economies lags, it's buoyed by consumption in Asia and Africa. Nonetheless, the legislative trend poses a consistent challenge for the Paraxylene market.
Crude-Oil-Led Feedstock Price Volatility
As WTI prices dropped, the PX-naphtha spread declined, impacting market dynamics. While integrated players benefited from lower crude prices through reduced feedstock costs, standalone aromatics plants, reliant on robust gasoline and diesel co-product values, faced challenges. In 2025, South Korean producers grappled with significant operating losses, hindered by their older crackers' inability to compete with the scale and integration of Chinese mega-sites. With OPEC+ unwinding voluntary cuts and non-OPEC supplies from Brazil and Guyana on the rise, crude prices seem poised for a prolonged cap, potentially further squeezing margins. As cash-cost curves flatten, only the most efficient plants in the Paraxylene market maintain high utilization rates.
*Our forecasts treat driver/restraint impacts as directional, not additive. The impact forecasts reflect baseline growth, mix effects, and variable interactions.
Segment Analysis
By Application: PTA Dominance Anchors Feedstock Economics
PTA consumed 94.37% of global PX volume in 2025 and is forecast to grow at a 5.37% CAGR through 2031. This heavy concentration ties the Paraxylene market closely to polyester dynamics, making producer economics heavily reliant on trends in textiles and packaging. Between 2021 and 2026, Asia bolstered its PTA capacity significantly, with China leading the charge across multiple projects. A testament to the industry's scale requirements, Tongkun unveiled a large-scale plant in Quanzhou. As integrated sites like Hengli Dalian increasingly feed their captive downstream lines, the Paraxylene market's appetite for PTA continues to swell. This trend is further accentuated by a diminishing merchant trade volume, making spot prices more susceptible to any unforeseen outages.
While Dimethyl Terephthalate and select specialty outlets command a modest share of the demand, their growth trajectory closely mirrors that of GDP. PTA's cost-effectiveness and superior polymerization kinetics have made it the dominant choice for commodity resins. In contrast, DMT finds its niche, primarily in specialized films and niche polyesters, where flexibility in processing takes precedence over feedstock pricing. Other applications, including plasticizers, isophthalic acid, and a handful of minor chemicals, exert minimal influence on the broader Paraxylene market. Regulatory oversight tends to emphasize the sustainability of downstream polymers over the purity of PX or PTA. Consequently, compliance for feedstocks leans more towards ISO 9001 standards and moisture specifications, sidelining environmental considerations.


By End-Use Industry: Plastics Outpace Textiles on Packaging Momentum
In 2025, textiles accounted for a 61.09% share of Paraxylene (PX) volume, asserting their dominance. However, plastics are on a faster trajectory, projected to grow at a 6.15% CAGR through 2031. As apparel consumption in South Asia and Sub-Saharan Africa approaches Chinese per-capita levels, Chinese integrated yarn giants continue to expand capacity, even as domestic demand plateaus. The Paraxylene market for plastics is buoyed by beverage bottlers' shift from glass to lightweight PET, a transition that not only reduces freight costs but also lessens the carbon footprint. While EU recycled-content regulations and California’s SB-54 exert short-term pressure on virgin feedstock, collection bottlenecks allow new PTA plants to confidently target packaging markets without the threat of cannibalization.
India’s naphtha demand is set to rise significantly until 2030, indicating a boost in domestic PET resin supply for bottled water and carbonated beverages. Meanwhile, Thailand, Vietnam, and Malaysia are establishing PET lines to reduce their reliance on imports. The market also sees growth in industrial fibers, biaxially oriented films, and engineering resins, all expanding steadily. Demands in tire reinforcement, electronics miniaturization, and automotive lightweighting drive this growth. Collectively, these dynamics position the plastics segment as the primary growth driver within the larger Paraxylene market.
Geography Analysis
Asia-Pacific captured 82.21% of PX volume in 2025 and is set to expand at a 5.49% CAGR through 2031. In a significant move, China introduced new xylene capacity in the latter half of 2025, elevating its national xylene capacity. The region's momentum is further underscored by projects like the Sinopec-Aramco Fujian complex, targeting PX by 2030, and the Tahe refinery's expansion, set to add PX by 2028. Echoing this trend, India aims for self-sufficiency, planning to add PX by 2030. Meanwhile, producers in South Korea and Japan are either downsizing or retrofitting to stay competitive in exports.
While North America holds a modest share of the Paraxylene market, it enjoys protective tariff shields against Chinese PTA imports. The U.S. Gulf Coast, with Beaumont as its largest unit, houses the bulk of this capacity. Europe, however, faces a structural decline: as refineries pivot to biofuels, the output of aromatics diminishes. This shift leaves the remaining PTA plants reliant on imports. In the Middle East, Saudi Aramco's Jazan and the planned Yanbu expansions are capitalizing on low-cost feedstock and their strategic closeness to Asia, positioning the region as a swing exporter. Conversely, South America remains tethered as an import-dependent market, sourcing both PX and PTA from the Gulf Coast and Asia, a reliance that's projected to persist throughout the decade.

Competitive Landscape
The paraxylene (PX) market is moderately fragmented. Technology licensing is pivotal in shaping competitive advantages. In South Korea, firms including GS Caltex, S-Oil, and Lotte Chemical reported significant losses in H1 2025. This financial strain has led to a government-initiated restructuring, potentially opening doors for Chinese or Middle Eastern investors to acquire these distressed assets. Meanwhile, in Southeast Asia, mid-tier companies such as PTT Global Chemical and Petronas are considering consolidation or joint ventures as a strategy to enhance their scale and gain access to advanced technologies.
Paraxylene (PX) Industry Leaders
China Petrochemical Corporation
Reliance Industries Limited
Hengli Petrochemical Co., Ltd.
Rongsheng Petrochemical Co., Ltd.
Exxon Mobil Corporation
- *Disclaimer: Major Players sorted in no particular order

Recent Industry Developments
- October 2024: Suntory Group unveiled plans to roll out PET bottles made from bio-paraxylene, a sustainable alternative derived from used cooking oil, in select products across Japan. The initiative targets around 45 million beverage PET bottles, with discussions already in motion to broaden its application throughout the company's product range.
- October 2024: Indorama Ventures Public Company Limited, in collaboration with Suntory, ENEOS Corporation, Mitsubishi Corporation, Iwatani, and Neste, unveiled the world's inaugural commercial-scale bio-PET bottle. This bottle was crafted from ISCC+ certified bio-paraxylene and promises a notable reduction in CO2 emissions.


Global Paraxylene (PX) Market Report Scope
Paraxylene, also known as 1,4-dimethylbenzene, is a colorless and flammable aromatic hydrocarbon mainly produced from catalytic reforming or thermal cracking of naphtha. Paraxylene serves as the primary feedstock for the production of purified terephthalic acid (PTA), dimethyl terephthalate (DMT), and other specialty chemicals. Paraxylene, via its derivatives PTA and DMT, caters to the textile and plastic industries, producing polyester fibers, resins, and films.
The market is segmented by application, end-use industry, and geography. By application, the market is segmented into Purified Terephthalic Acid (PTA), Dimethyl Terephthalate (DMT), and Other Applications. By end-use industry, the market is segmented into Textiles, Plastics, and Other End-user Industries. The report also covers the market size and forecast for the Paraxylene Market in 26 countries across major regions. For each segment, the market sizing and forecasts have been done on the basis of volume (Tons).
| Purified Terephthalic Acid (PTA) |
| Dimethyl Terephthalate (DMT) |
| Other Applications |
| Textile |
| Plastics |
| Others End-user Industries |
| Asia-Pacific | China |
| India | |
| Japan | |
| South Korea | |
| Thailand | |
| Indonesia | |
| Malaysia | |
| Vietnam | |
| Rest of Asia-Pacific | |
| North America | United States |
| Canada | |
| Mexico | |
| Europe | Germany |
| United Kingdom | |
| France | |
| Italy | |
| Spain | |
| Russia | |
| Rest of Europe | |
| South America | Brazil |
| Argentina | |
| Colombia | |
| Rest of South America | |
| Middle-East and Africa | Saudi Arabia |
| United Arab Emirates | |
| Qatar | |
| Nigeria | |
| Egypt | |
| South Africa | |
| Rest of Middle-East and Africa |
| By Application | Purified Terephthalic Acid (PTA) | |
| Dimethyl Terephthalate (DMT) | ||
| Other Applications | ||
| By End-use Industry | Textile | |
| Plastics | ||
| Others End-user Industries | ||
| By Geography | Asia-Pacific | China |
| India | ||
| Japan | ||
| South Korea | ||
| Thailand | ||
| Indonesia | ||
| Malaysia | ||
| Vietnam | ||
| Rest of Asia-Pacific | ||
| North America | United States | |
| Canada | ||
| Mexico | ||
| Europe | Germany | |
| United Kingdom | ||
| France | ||
| Italy | ||
| Spain | ||
| Russia | ||
| Rest of Europe | ||
| South America | Brazil | |
| Argentina | ||
| Colombia | ||
| Rest of South America | ||
| Middle-East and Africa | Saudi Arabia | |
| United Arab Emirates | ||
| Qatar | ||
| Nigeria | ||
| Egypt | ||
| South Africa | ||
| Rest of Middle-East and Africa | ||


Key Questions Answered in the Report
How large will global PX demand be by 2031?
The Paraxylene market size is projected at 87.14 million tons by 2031, reflecting a 5.15% CAGR from 67.79 million tons in 2026.
Which region drives PX consumption growth?
Asia-Pacific holds 82.21% of volume and grows at 5.49% CAGR through 2031, powered by integrated Chinese and Indian complexes.
Why does PTA dominate PX use?
PTA claims 94.37% of demand because almost all new polyester and packaging capacity is designed around PTA, not DMT or alternatives.
How are recycling mandates affecting virgin PX?
Near-term gaps between collection targets and recycling capacity keep virgin PX demand steady, but tighter rules in the EU and U.S. cap long-term growth.
Page last updated on:


