
OTT Video Market Size and Share
Market Overview
| Study Period | 2020 - 2031 |
|---|---|
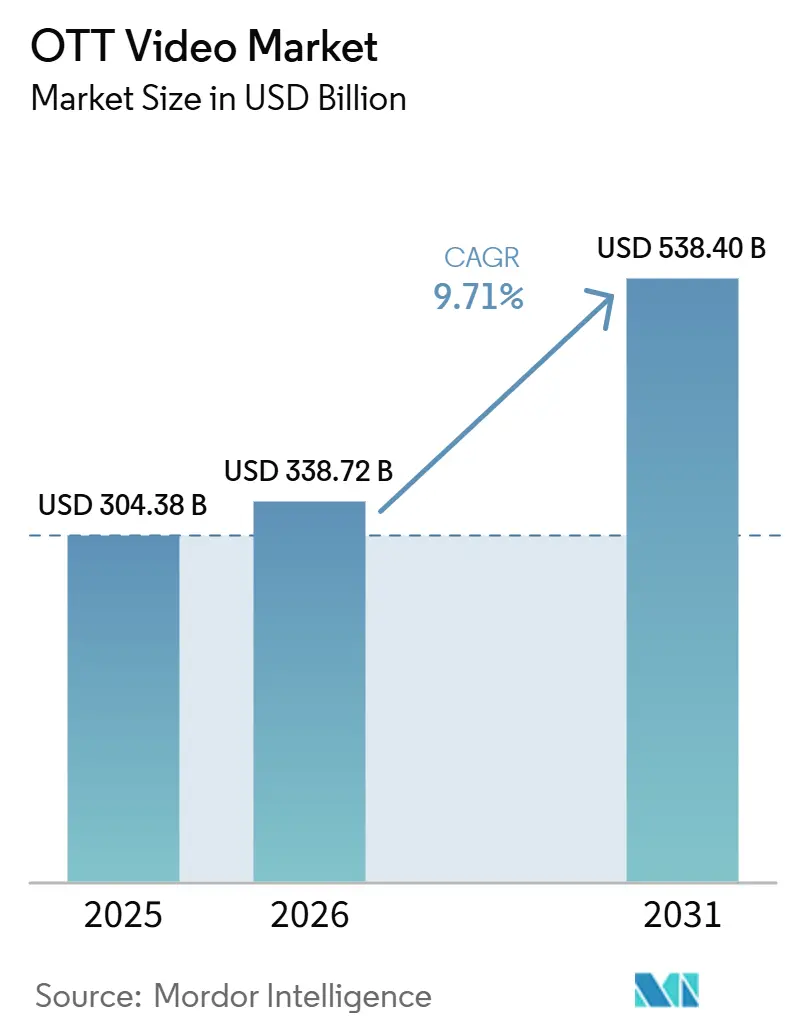
| Market Size (2026) | USD 338.72 Billion |
| Market Size (2031) | USD 538.40 Billion |
| Growth Rate (2026 - 2031) | 9.71 % |
| Fastest Growing Market | Asia-Pacific |
| Largest Market | North America |
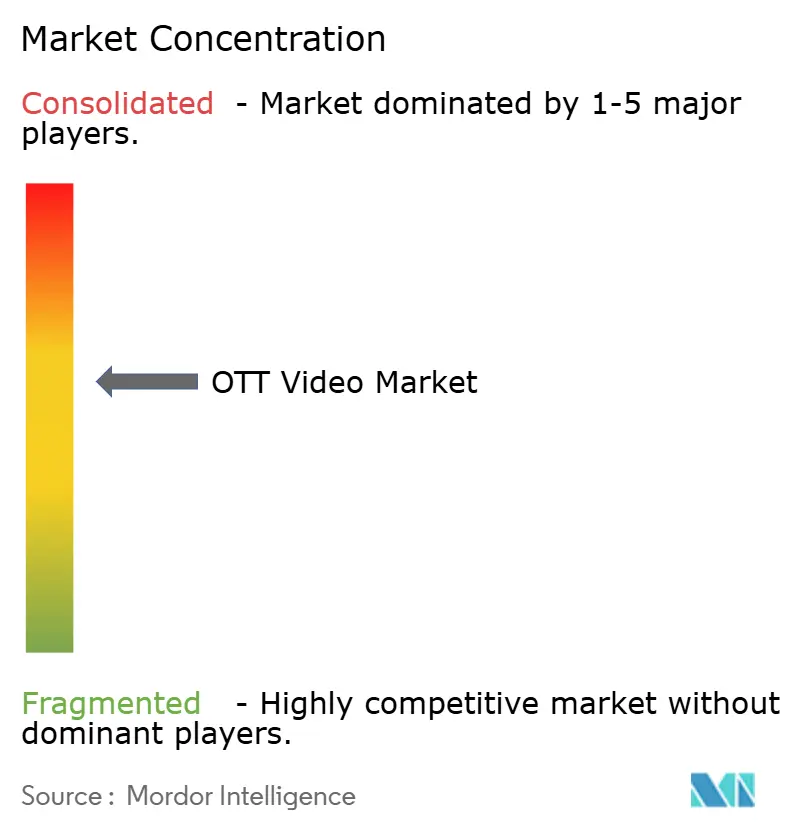
| Market Concentration | Medium |
Major Players *Disclaimer: Major Players sorted in no particular order Image © Mordor Intelligence. Reuse requires attribution under CC BY 4.0. | |
OTT Video Market Analysis by Mordor Intelligence
The OTT video market size was valued at USD 304.38 billion in 2025 and is estimated to grow from USD 333.92 billion in 2026 to reach USD 538.40 billion by 2031, at a CAGR of 9.71% during the forecast period (2026-2031). The OTT video market is moving further away from scheduled television as audiences choose on-demand services across phones, televisions, and computers. Advertising has become a central revenue source as platforms offer lower-priced plans and sell more connected-TV inventory. Sports rights, local programming, and telecom bundles are becoming important ways to acquire and retain viewers in the OTT video market. Platforms are also investing in recommendation tools and delivery capacity because these capabilities affect content discovery, viewing quality, and advertising value. The opportunity is strongest where mobile use, broadband coverage, and connected television adoption are advancing together, although rising content costs and frequent subscription cancellations remain material limits on the OTT video market.
Key Report Takeaways
- By revenue model, SVOD held 56.41% share of the OTT video market in 2025, while the advertising-based model is projected to expand at a 10.31% CAGR through 2031.
- By device type, smartphones and tablets held 60.56% share in 2025, while smart TVs are projected to expand at a 10.81% CAGR through 2031.
- By content genre, TV shows and episodic content held 45.38% share in 2025, while sports content is projected to expand at a 10.55% CAGR through 2031.
- By end user, individual consumers held 33.72% share of the OTT video market in 2025, while hospitality and travel is projected to expand at a 10.23% CAGR through 2031.
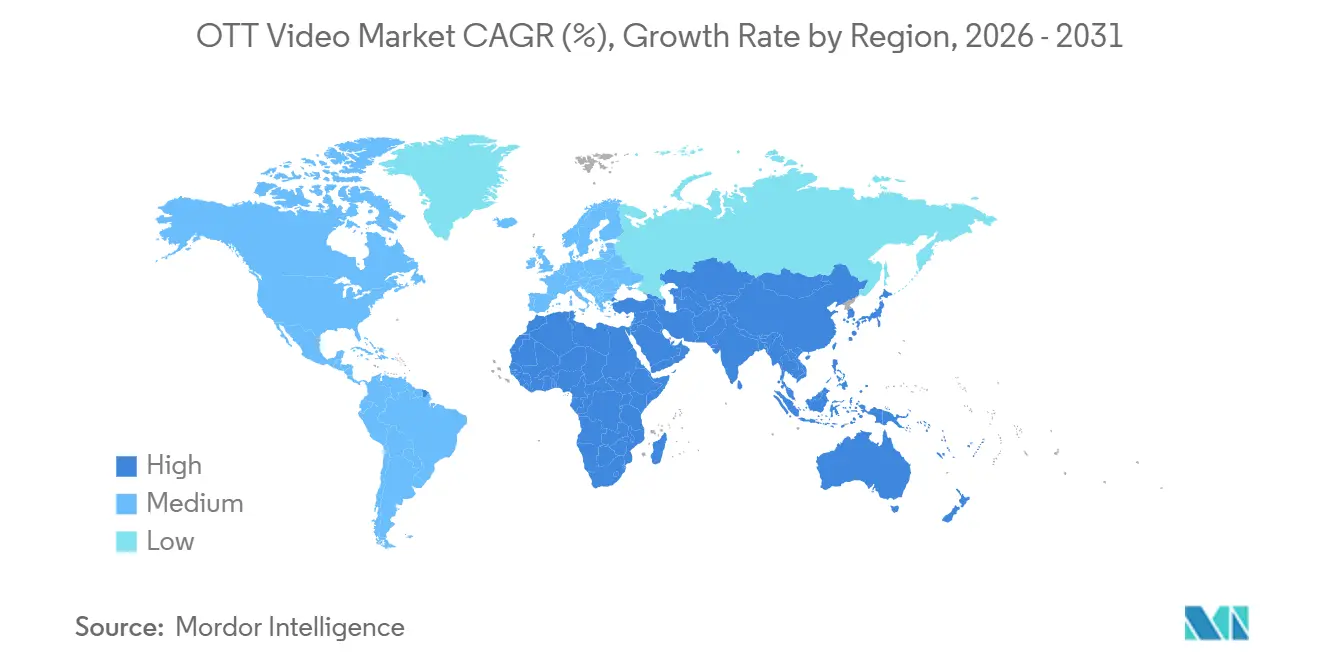
- By geography, North America held 55.89% share in 2025, while Asia-Pacific is projected to expand at a 10.06% CAGR through 2031.
Note: Market size and forecast figures in this report are generated using Mordor Intelligence’s proprietary estimation framework, updated with the latest available data and insights as of January 2026.
Market Trends and Insights
Drivers Impact Analysis of OTT Video Market*
| Driver | (~) % Impact on CAGR Forecast | Geographic Relevance | Impact Timeline |
|---|---|---|---|
| Rising Demand for On-Demand and Multi-Screen Viewing | +3.0% | Global, with highest intensity in Asia-Pacific and North America | Short term (≤ 2 years) |
| Rapid Expansion of Connected TV Advertising Inventory | +2.4% | North America and Europe core, spill-over to Asia-Pacific | Short term (≤ 2 years) |
| Live Sports Rights Fragmentation Across Platforms | +1.6% | Global, led by North America, Europe, and Asia-Pacific | Medium term (2-4 years) |
| Bundled Telecom, Pay TV, and OTT Offers | +1.2% | Asia-Pacific, Europe, Middle East and Africa | Medium term (2-4 years) |
| AI-Driven Content Discovery and Retention Optimization | +0.9% | Global | Long term (≥ 4 years) |
| Cloud-Native Delivery and Low-Latency Streaming Architecture | +0.6% | Global, with acceleration in emerging markets through 5G rollout | Long term (≥ 4 years) |
| Source: Mordor Intelligence | |||
Rising Demand for On-Demand and Multi-Screen Viewing
The move from scheduled viewing to continuous access across devices is supporting demand in the OTT video market. Audiences increasingly expect the same service to work on a smartphone, smart TV, laptop, or tablet without losing access to their profiles and viewing history. This pattern is especially important in South and Southeast Asia, where mobile viewing remains broad while connected-TV use is also rising. A person who uses multiple screens can create more viewing sessions and advertising opportunities for a single service. The resulting data can help platforms tailor recommendations and advertising while maintaining lower-priced plans. These changes give the OTT video market a wider base of subscription and advertising revenue, while also helping services understand how content, devices, and viewing times shape each customer relationship.
Rapid Expansion of Connected TV Advertising Inventory
Connected-TV advertising is becoming a more established part of media planning in the United States. The Interactive Advertising Bureau reported that digital video advertising spending in the United States is expected to exceed USD 81.9 billion in 2026, representing more than 60% of television and video advertising spending.[1]Interactive Advertising Bureau, “2026 IAB Digital Video Ad Spend and Strategy Report: Part One,” Interactive Advertising Bureau, iab.com The same report found that 54% of incremental connected-TV budgets were redirected from linear television. Smaller advertisers increased connected-TV adoption from 60% in 2024 to 85% in 2026 as self-service buying tools became more available. For the OTT video market, more advertiser participation makes ad-supported plans more viable and increases the value of measurable audience data. It also underscores the need for cross-platform measurement, as advertising inventory is spread across more streaming services, devices, and purchasing channels that advertisers must assess together.
Live Sports Rights Fragmentation Across Platforms
Premium sports programming is becoming a major acquisition tool for OTT video services. The National Basketball Association announced an 11-year set of media agreements in July 2024, under which Prime Video began carrying NBA games in the 2025-2026 season. Prime Video's package includes 66 regular-season games and the NBA Play-In Tournament. Live events can attract viewers who want to watch at the time of broadcast and cannot easily defer viewing. However, rights spread across different platforms can encourage viewers to subscribe for a season and cancel after it ends. A broad content library can reduce that risk by giving sports viewers reasons to remain active between events. DAZN uses a portfolio of sports rights in selected markets to maintain a steadier schedule of live programming, thereby lessening its reliance on any single event or league.
Bundled Telecom, Pay TV, and OTT Offers
Telecom bundles are becoming a practical distribution route for the OTT video market in price-sensitive regions. Reliance Jio launched its Rs 200 plan in May 2026, offering 15 streaming apps, more than 1,000 live TV channels, and 30 GB of high-speed data for 28 days. The offer targeted price-sensitive middle-income smartphone users and combined live television, streaming apps, and mobile data into a single plan. The offer lowers the initial cost of accessing several services and extends reach beyond direct subscription channels. Telefónica's O2 Spain introduced plans in July 2026 that combine fiber, mobile service, Netflix, Disney+, and Movistar Plus+. EU Turkcell also introduced subscription bundles for its customer base during its 5G rollout. Bundles can improve access and reduce customer churn for carriers, but they also reduce the revenue retained by content owners compared with a direct subscription, requiring clearer commercial terms between carriers, distributors, and platforms.
Restraints Impact Analysis of OTT Video Market*
| Restraint | (~) % Impact on CAGR Forecast | Geographic Relevance | Impact Timeline |
|---|---|---|---|
| Subscription Fatigue and Churn Pressure | -2.1% | North America and Europe, with highest per-household service stacking | Short term (≤ 2 years) |
| Rising Content Acquisition and Original Production Costs | -1.5% | Global | Medium term (2-4 years) |
| Fragmented Rights Windows and Licensing Complexity | -0.8% | North America and Europe | Medium term (2-4 years) |
| Network Quality Gaps in Emerging Markets | -0.6% | Sub-Saharan Africa, South Asia, and Southeast Asia | Long term (≥ 4 years) |
| Source: Mordor Intelligence | |||
Subscription Fatigue and Churn Pressure
Subscription fatigue is a direct restraint on the OTT video market, particularly in North America and Europe, where households already hold several services. The average number of paid video subscriptions per United States household declined to 4.1 in the second quarter of 2025 from 4.2 in the first quarter. Ad-supported plans can ease price pressure, but excessive advertising can create another reason to cancel. Services must balance price, advertising load, and exclusive programming to protect recurring revenue. That balance affects both the cost of bringing back former subscribers and the funding available for new content, product improvements, and advertising sales capabilities that can support longer-term retention.
Rising Content Acquisition and Original Production Costs
Large content budgets make it harder for smaller operators to compete in the OTT video market. Amazon reported USD 22.4 billion in combined video and music content costs in its 2025 annual report, a 10% increase from the prior year. The scale of this spending shows how programming and sports rights can create a high operating cost base. Netflix planned to increase content spending to USD 20 billion in 2026, including live programming. Smaller services may need a clear regional, genre, or audience focus when they cannot match the spending of the largest platforms. For established platforms, high programming costs can also limit funds for delivery upgrades, compliance work, and expansion into new countries, even when those investments are necessary to sustain long-term service quality.
*Our forecasts treat driver/restraint impacts as directional, not additive. The impact forecasts reflect baseline growth, mix effects, and variable interactions.
OTT Video Market Segment Analysis
By Revenue Model:
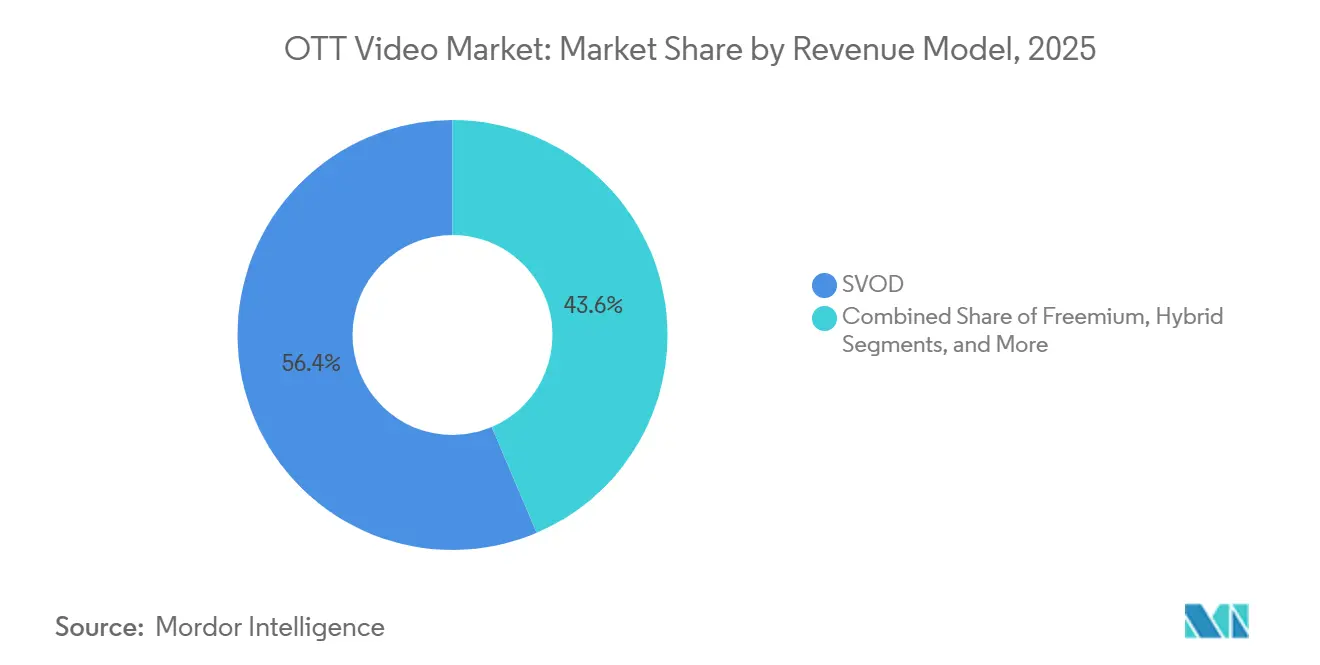
Subscription Revenue Leads While Advertising Gains GroundSVOD held 56.41% of the OTT video market share in 2025, supported by broad content catalogs and regular household use. Established services benefit when subscribers use the same platform frequently across genres and devices. Transactional video on demand remains relevant for premium rentals, recent releases, and live events. Its position is challenged as subscription services shorten exclusive release windows or add more films to their own catalogs. Freemium services have lower revenue per viewer, but they can introduce new users to a platform before a paid commitment. Hybrid offerings are therefore becoming more common across the OTT video market.
The advertising-based model is projected to record a 10.31% CAGR through 2031. This model is supported by ad-supported tiers, free ad-supported streaming television services, and lower-priced access for cost-sensitive viewers. More than 110 million ad-supported streaming plans were active in the United States in 2025, excluding Amazon Prime Video. Netflix's ad-supported plan reached 94 million monthly active users globally in 2025. Its advertising revenue increased 26% during that year. European rules on recommendation and advertising transparency can increase compliance demands, while stronger data controls can help platforms build advertiser confidence.



By Device Type:
Mobile Viewing Leads as Smart TVs Expand Premium ViewingSmartphones and tablets captured 60.56% of global revenue in 2025. India and Southeast Asia have supported this position through mobile-first viewing, regional-language interfaces, and lower-data streaming modes. These features allow services to reach viewers who may not have regular access to a broadband-connected television. Laptops and desktops continue to serve work, education, screen-sharing, and multitasking use cases. Their role is less central to everyday entertainment viewing than it was earlier in the development of streaming. The device mix allows platforms to serve different viewing situations rather than relying on a single screen.
Smart TVs are projected to grow at a 10.81% CAGR through 2031. Connected television adoption in North America and Europe supports this growth, especially for live sports, serialized dramas, and event programming. Tracking in Indonesia and the Philippines found longer, large-screen viewing and more co-viewing sessions during 2025. Fox Corp's announced USD 22 billion acquisition of Roku in 2026 highlighted the strategic value of a smart-TV operating system and a large device base. Control of the home-screen interface can provide valuable first-party data and an advertising sales channel. Smartphones and smart TVs therefore address different viewing occasions within the same OTT video market.
By Content Genre:
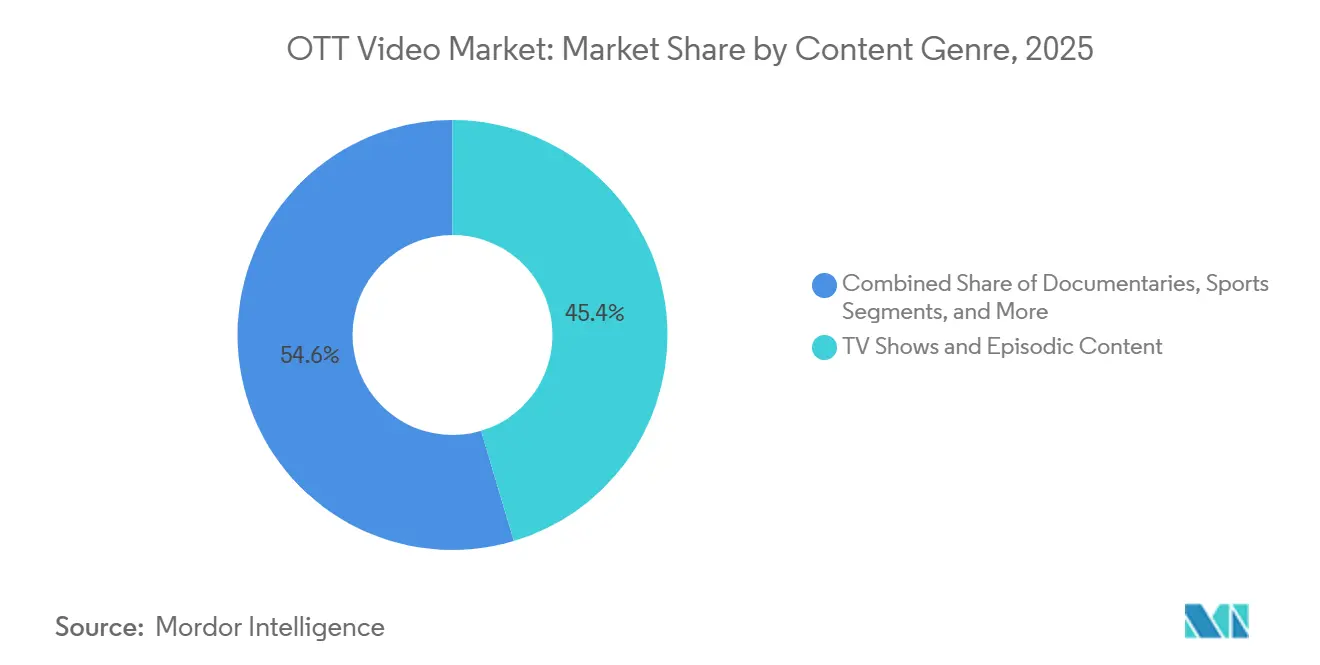
Episodic Programming Leads While Sports Draws New ViewersTV shows and episodic content accounted for 45.38% of the OTT video market in 2025. Serialized programming can encourage viewers to return regularly and can spread production costs over several episodes. The category includes drama, reality formats, and international series that serve different audience groups. Movies and films remain an important category, but shorter theatrical windows and more original series affect their relative role. Documentaries serve a more specialized audience and can reinforce platforms with cultural or educational positioning. A balanced genre portfolio helps a service meet both routine and event-based viewing needs.
Sports content is projected to expand at a 10.55% CAGR through 2031. Major rights agreements are shifting live games to streaming services and making sports a central tool for subscriber acquisition. The NBA agreements placed Prime Video games on a streaming service starting in the 2025-2026 season. NBC Universal extended its United States Olympic rights in March 2025 through 2036, with Peacock as the streaming partner.[2]National Basketball Association, “NBA Announces New 11-Year Media Agreements,” NBA, nba.com The long-duration arrangement secured premium live-event programming to support the service's subscriber retention strategy. Sports can strengthen immediate viewing, but a limited pool of rights also raises programming costs. Services with programming outside sports can reduce cancellations once a season ends.
By End User:
Consumers Lead While Hospitality and Travel Adopt Integrated ServicesIndividual consumers commanded 33.72% of global revenue in 2025. Direct household subscriptions remain the foundation of demand across income groups and regions. Viewing patterns range from single-service households in mature countries to mobile users who rotate among several services. Corporate enterprises, educational institutions, healthcare organizations, and public-sector organizations also use video for training, communication, and secure content delivery. These business uses can involve multiyear contracts that are more predictable than consumer subscription cycles. They are helping broaden the role of the OTT video industry beyond household entertainment.
Hospitality and travel are projected to expand at a 10.23% CAGR through 2031. Hotels, cruise operators, and premium aircraft cabins are replacing legacy in-room systems with OTT-enabled smart-TV services. Properties can include streaming access within the room experience rather than charge separately for each use. This approach supports a more consistent guest experience and enables the creation of institutional subscriptions at scale. Hotel-oriented platforms can also support advertising directed at business and leisure travelers when privacy rules are met. This opportunity requires partnership models that differ from conventional consumer content licensing.
Geography Analysis
North America OTT Video Market
North America held 55.89% of the OTT video market share in 2025, supported by high subscription revenue per user and broad connected-TV access. The United States is the region's main revenue center, while Canada and Mexico add demand at lower revenue per user. Connected-TV advertising is changing how services monetize television viewing, with more advertising budgets moving from linear television.[3]Interactive Advertising Bureau, “2026 IAB Digital Video Ad Spend and Strategy Report: Part One,” Interactive Advertising Bureau, iab.com Household subscription stacking has reached a ceiling, which is shifting competition toward advertising tiers, price changes, bundles, and longer customer value. Fox Corp's proposed Roku transaction also reflects the value of controlling the television interface and related advertising inventory.
APAC OTT Video Market
Asia-Pacific is projected to grow at a 10.06% CAGR through 2031, making it the fastest-growing regional OTT video market. India combines large mobile audiences with a growing streaming base. JioHotstar streamed 821 million concurrent viewers during the ICC T20 World Cup 2026 Final. Southeast Asia's five leading markets recorded 19% growth in paid streaming accounts in 2025, bringing the total to over 61 million. Japan, South Korea, and Australia are more subscription-led, while India, Indonesia, Vietnam, and the Philippines have stronger advertising-led models. China remains distinct because iQIYI, Tencent Video, and Youku operate within content and data requirements set by domestic regulators.
EMEA and South America OTT Video Market
Europe, South America, the Middle East, and Africa provide different paths for further expansion. Europe combines pan-regional services, national broadcaster platforms, and active telecom bundles, while the Digital Services Act raises requirements for transparency. South America is led by Brazil and Argentina, where Spanish- and Portuguese-language programming and smartphone use support demand. The Middle East is supported by younger audiences, media investment, and partnerships such as stc group's extended Netflix relationship in Saudi Arabia. Africa has lower penetration, with South Africa, Egypt, and Nigeria among its key markets. Vodacom's planned Amazon Prime bundle from August 2026 shows why carrier distribution is important where payment and direct acquisition systems are less developed.

Competitive Landscape
The OTT video market is moderately concentrated at the top tier, where Netflix, Amazon, and Alphabet hold substantial shares of viewer engagement and advertising inventory. Regional and specialist platforms compete through local programming, sports rights, and carrier partnerships. Netflix combined large-scale subscription operations with a growing advertising business, supported by its content spending and ad-supported plan. Amazon reported USD 22.4 billion of combined video and music content costs in 2025.[4]Amazon.com, Inc., “Annual Report on Form 10-K for Fiscal Year 2025,” About Amazon, aboutamazon.com Prime Video also uses sports rights and integration with its broader membership offering to support retention. The OTT video industry, therefore, rewards companies that can link content, technology, advertising, and distribution.
Companies are increasingly combining bundles, personalized discovery, and live programming. Netflix said in April 2026 that its recommendation system supports faster iteration and a broader range of content types. Recommendation quality can reduce the difficulty viewers face when deciding what to watch and can make a deep catalog more useful. Amazon's NBA package is another example of a major platform using exclusive live programming to attract and retain users. DAZN provides a different model by focusing on sports audiences and combining rights across markets. Fox Corp's Roku proposal would add control of a television operating system to its broadcast and streaming assets.
The competitive field also has openings in hospitality, healthcare, and enterprise video delivery. These customers need reliable content delivery, privacy controls, and service terms that may not match consumer streaming products. Vertical platforms can serve focused audiences with sports, factual programming, or other specialized content. Paramount Skydance's proposed acquisition of Warner Bros. Discovery received European Commission clearance in July 2026 and would combine Paramount+ and Max under one corporate group. The planned combination demonstrates the continued importance of studio libraries and global distribution. The OTT video market remains competitive because broad global platforms and specialized regional services use different methods to build viewer loyalty.
OTT Video Industry Leaders
Netflix, Inc.
Alphabet Inc.
Amazon.com, Inc.
The Walt Disney Company
Tencent Holdings Limited
- *Disclaimer: Major Players sorted in no particular order
OTT Video Market Companies Covered in this Report
- Netflix, Inc.
- Alphabet Inc.
- Amazon.com, Inc.
- The Walt Disney Company
- Tencent Holdings Limited
- Apple Inc.
- Warner Bros. Discovery, Inc.
- Comcast Corporation
- Paramount Skydance Corporation
- Roku, Inc.
- DAZN Group Limited
- PCCW Limited
- iQIYI, Inc.
- Alibaba Group Holding Limited
- Zee Entertainment Enterprises Limited
- JioStar India Private Limited
- MBC Group
- CANAL+ S.A.
- Rakuten Group, Inc.
- Starz Entertainment Corp.

Recent Industry Developments in OTT Video Market
- July 2026: Fox Corp announced an agreement to acquire Roku for USD 22 billion in a combination of cash and Fox Class A shares, valuing Roku at USD 160 per share. The deal is expected to close in the first half of 2027 and gives Fox access to Roku's more than 90 million active devices and its operating system, creating an integrated platform across linear broadcasting, direct streaming, and smart-TV inventory monetization with expected annual run-rate cost synergies of USD 400 million.
- July 2026: Telefónica's O2 Spain launched 4 household convergence plans starting from EUR 45 per month (USD 49.50 per month), bundling fiber broadband, mobile data, Disney+, Netflix, and Movistar Plus+.
- May 2026: Reliance Jio launched a Rs 200 (USD 2.40) OTT Pass that bundles 15 streaming platforms, more than 1,000 live TV channels, and 30 GB of high-speed data for 28 days.
- October 2025: Amazon Prime Video launched its exclusive NBA broadcast partnership under the 11-year, USD 76 billion total media-rights deal signed with the NBA in July 2024, airing 66 regular-season games, the NBA Cup, and full Play-In Tournament coverage. The agreement marked a major United States professional league's primary sports package moving to a streaming-only platform.


Global OTT Video Market Report Scope
The OTT video market refers to the delivery of video content, including movies, TV shows, live streaming, and other digital video services, directly to viewers over the internet without relying on traditional cable, satellite, or broadcast television distribution. The scope of the study covers OTT video services offered through subscription-based, advertising-based, transactional, and hybrid models across various devices, including smartphones, tablets, smart TVs, laptops, and desktops.
The OTT Video Market Report is Segmented by Revenue Model (SVOD, AVOD, TVOD, Hybrid, and Freemium), Device Type (Smartphones and Tablets, Smart TVs, Laptops and Desktops, and Other Device Types), Content Genre (Movies and Films, TV Shows and Episodic Content, Sports, Documentaries, and Other Content Genres), End User (Individual Consumers, Hospitality and Travel, Corporate Enterprises, Educational Institutions, Healthcare Organizations, Government and Public Sector, and Other End Users), and Geography (North America, South America, Europe, Asia-Pacific, Middle East, and Africa). The Market Forecasts are Provided in Terms of Value (USD).
| SVOD |
| AVOD |
| TVOD |
| Hybrid |
| Freemium |
| Smartphones and Tablets |
| Smart TVs |
| Laptops and Desktops |
| Other Device Types |
| Movies and Films |
| TV Shows and Episodic Content |
| Sports |
| Documentaries |
| Other Content Genres |
| Individual Consumers |
| Hospitality and Travel |
| Corporate Enterprises |
| Educational Institutions |
| Healthcare Organizations |
| Government and Public Sector |
| Other End Users |
| North America | United States |
| Canada | |
| Mexico | |
| South America | Brazil |
| Argentina | |
| Chile | |
| Rest of South America | |
| Europe | Germany |
| United Kingdom | |
| France | |
| Italy | |
| Spain | |
| Rest of Europe | |
| Asia-Pacific | China |
| Japan | |
| India | |
| South Korea | |
| Australia | |
| Rest of Asia-Pacific | |
| Middle East | Saudi Arabia |
| United Arab Emirates | |
| Qatar | |
| Rest of Middle East | |
| Africa | South Africa |
| Egypt | |
| Nigeria | |
| Rest of Africa |
| By Revenue Model | SVOD | |
| AVOD | ||
| TVOD | ||
| Hybrid | ||
| Freemium | ||
| By Device Type | Smartphones and Tablets | |
| Smart TVs | ||
| Laptops and Desktops | ||
| Other Device Types | ||
| By Content Genre | Movies and Films | |
| TV Shows and Episodic Content | ||
| Sports | ||
| Documentaries | ||
| Other Content Genres | ||
| By End User | Individual Consumers | |
| Hospitality and Travel | ||
| Corporate Enterprises | ||
| Educational Institutions | ||
| Healthcare Organizations | ||
| Government and Public Sector | ||
| Other End Users | ||
| By Geography | North America | United States |
| Canada | ||
| Mexico | ||
| South America | Brazil | |
| Argentina | ||
| Chile | ||
| Rest of South America | ||
| Europe | Germany | |
| United Kingdom | ||
| France | ||
| Italy | ||
| Spain | ||
| Rest of Europe | ||
| Asia-Pacific | China | |
| Japan | ||
| India | ||
| South Korea | ||
| Australia | ||
| Rest of Asia-Pacific | ||
| Middle East | Saudi Arabia | |
| United Arab Emirates | ||
| Qatar | ||
| Rest of Middle East | ||
| Africa | South Africa | |
| Egypt | ||
| Nigeria | ||
| Rest of Africa | ||


Key Questions Answered in the Report
What is the projected size of the OTT video market by 2031?
The OTT video market is projected to reach USD 538.40 billion by 2031, from USD 333.92 billion in 2026, at a 9.71% CAGR.
What is driving demand for OTT video services?
On-demand viewing, multi-screen access, connected-TV advertising, live sports, and telecom bundles are supporting demand across consumer and institutional use cases worldwide over the stated global forecast period, across major regions.
Which revenue model is growing fastest in OTT video?
The advertising-based model is projected to expand at a 10.31% CAGR through 2031, supported by ad-supported tiers and free streaming services.
Which devices are most important for streaming video?
Smartphones and tablets held 60.56% share in 2025, while smart TVs are projected to grow at a 10.81% CAGR through 2031.
Which content category is growing fastest?
Sports content is projected to expand at a 10.55% CAGR through 2031 because live rights can attract time-sensitive viewing in the OTT video market.
Which region is growing fastest for OTT video?
Asia-Pacific is projected to grow at a 10.06% CAGR through 2031, supported by India and the expansion of paid accounts in Southeast Asia.
Page last updated on:





