Oslo Data Center Market Size and Share
Market Overview
| Study Period | 2020 - 2031 |
|---|---|
| Forecast Data Period | 2026 - 2031 |
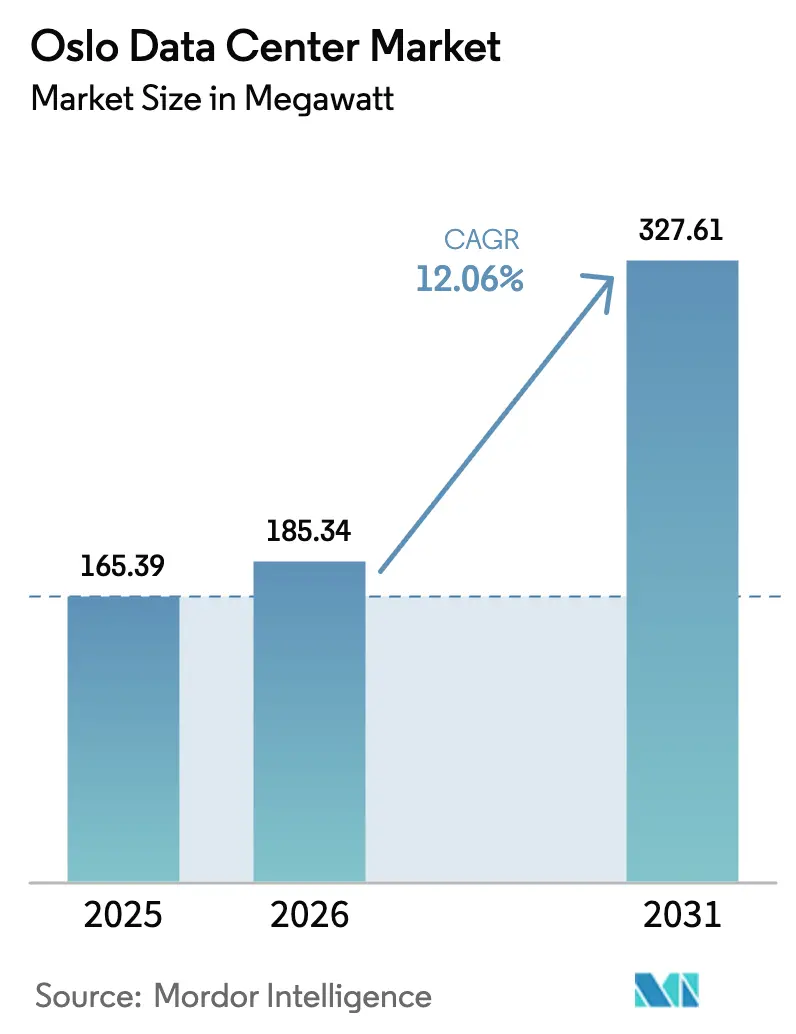
| Base Year Market Size (2025) | 165.39 megawatt |
| Market Volume (2026) | 185.34 megawatt |
| Market Volume (2031) | 327.61 megawatt |
| Growth Rate (2026 - 2031) | 12.06% CAGR |
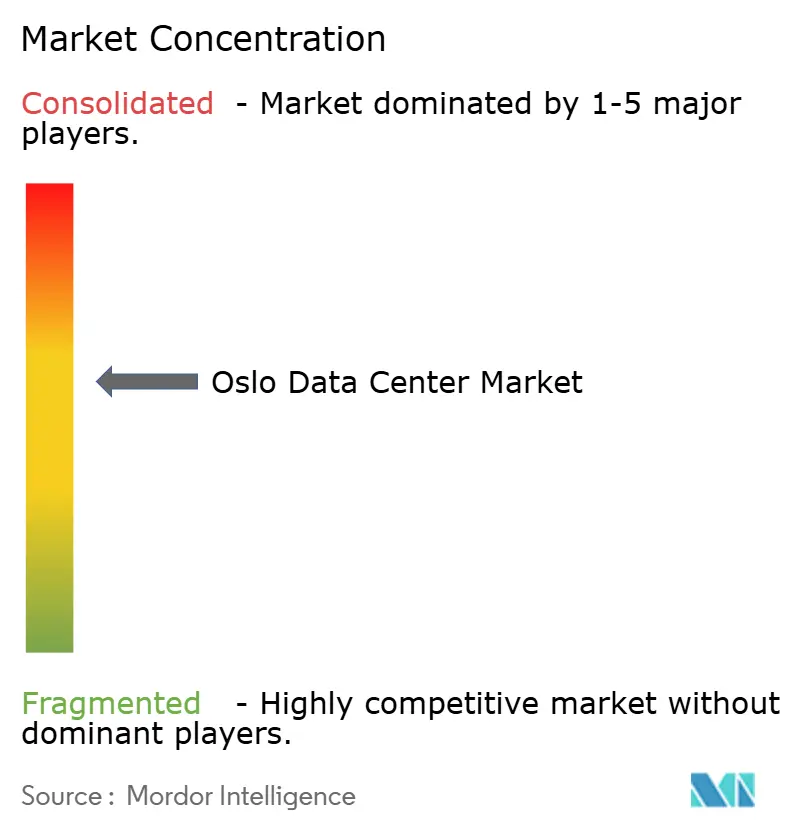
| Market Concentration | Medium |
Major Players *Disclaimer: Major Players sorted in no particular order Image © Mordor Intelligence. Reuse requires attribution under CC BY 4.0. | |
Oslo Data Center Market Analysis by Mordor Intelligence
The Oslo data center market size is expected to grow from 165.39 MW in 2025 to 185.34 MW in 2026 and is forecast to reach 327.61 MW by 2031 at 12.06% CAGR over 2026-2031. Strong momentum comes from 100% renewable hydro-based electricity, a naturally cool climate that drives best-in-class PUE ratios near 1.1, and the city’s growing role as a digital gateway linking mainland Europe with the Arctic and North America. New submarine cables, large-scale renewable investments, and supportive electricity-tax incentives keep power prices 30-40% below many continental hubs, preserving total cost advantages. Operators also benefit from policy changes that prioritize grid access for facilities with heat-recovery systems, reinforcing Oslo’s sustainability narrative. At the same time, hyperscale and AI workloads push average rack densities higher, creating demand for mega campuses, liquid cooling, and flexible grid interconnections that underpin the next wave of growth in the Oslo data center market.
Key Report Takeaways
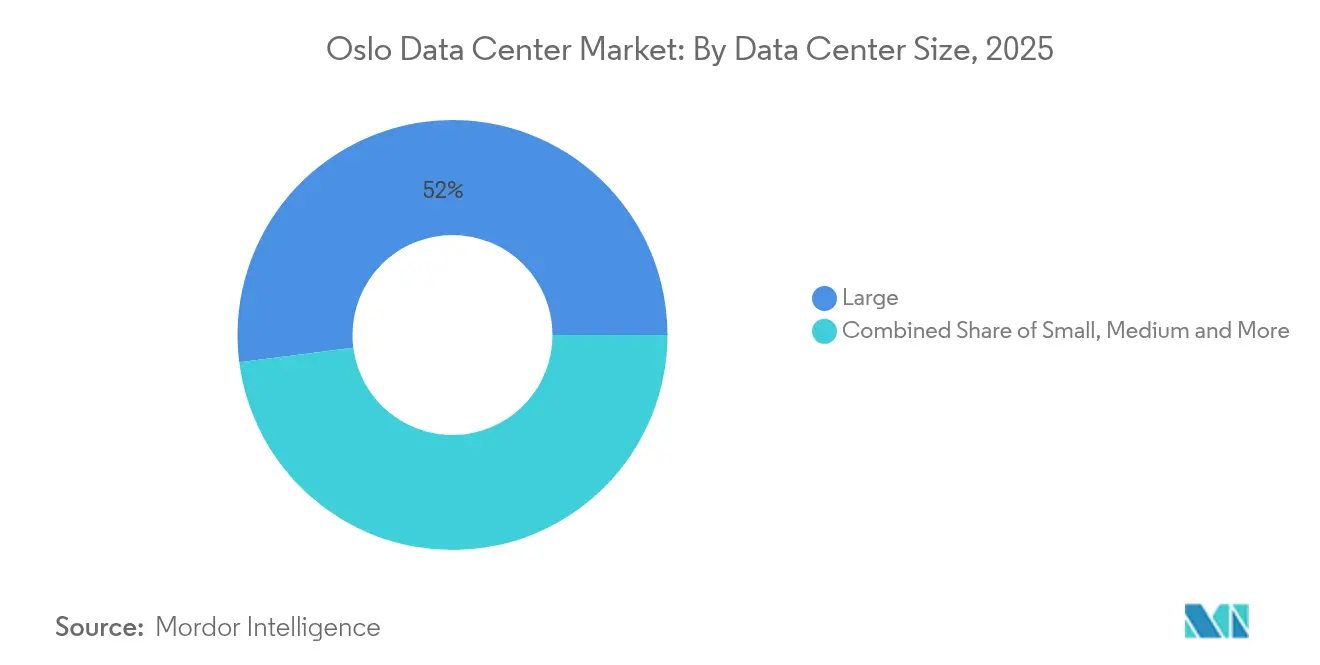
- By data center size, large facilities led with 52.02% of Oslo data center market share in 2025, while the mega segment is projected to expand at a 14.93% CAGR through 2031.
- By tier type, Tier 3 facilities commanded 70.65% of capacity in 2025; Tier 4 is the fastest-growing class at a 19.05% CAGR to 2031.
- By data center type, colocation providers accounted for 71.58% of revenue in 2025, whereas Cloud Service Providers are set to grow at 18.32% CAGR to 2031.
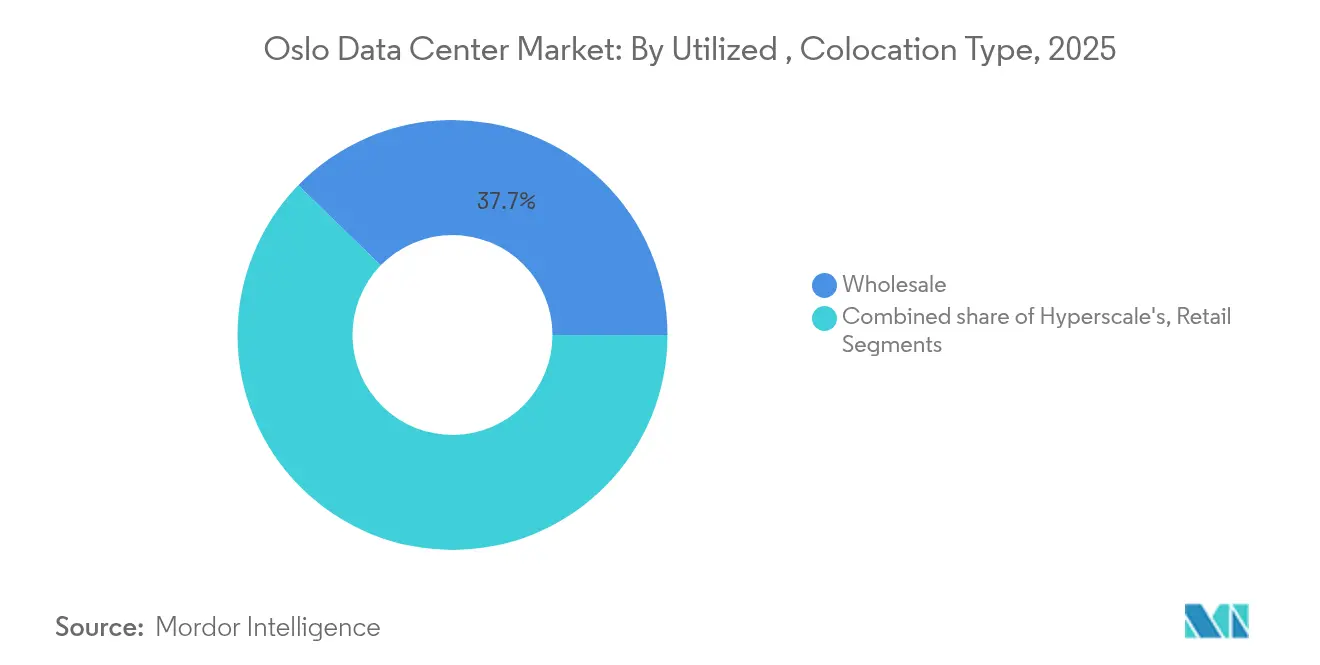
- By colocation model, wholesale held 37.74% of the Oslo data center market size in 2025, and hyperscale colocation is advancing at 14.74% CAGR to 2031.
- By end user, cloud and IT services represented 22.05% of capacity in 2025; manufacturing shows the fastest trajectory with a 15.34% CAGR through 2031.
Note: Market size and forecast figures in this report are generated using Mordor Intelligence’s proprietary estimation framework, updated with the latest available data and insights as of 2026.
Oslo Data Center Market Trends and Insights
Drivers Impact Analysis*
| Driver | (~) % Impact on CAGR Forecast | Geographic Relevance | Impact Timeline |
|---|---|---|---|
| Renewable grid mix and cold climate | +2.5% | Oslo and adjacent regions | Long term (≥ 4 years) |
| Electricity-tax relief for data centers | +1.8% | National | Medium term (2-4 years) |
| AI-led hyperscale demand spike | +3.1% | Oslo-centric, global pull | Medium term (2-4 years) |
| New trans-Atlantic and Arctic cables | +1.2% | Oslofjord landings | Long term (≥ 4 years) |
| District-heating heat-offtake model | +1.0% | Oslo metro | Medium term (2-4 years) |
| EU “Data-for-Green” low-cost capital | +0.9% | Oslo and EU projects | Medium term (2-4 years) |
| Source: Mordor Intelligence | |||
Favourable Climate and 100% Renewable Grid Mix
Norway supplies data centers with fully renewable hydro power, cutting operational emissions to near zero and lowering electricity costs by up to 40% versus key European peers.[1]Norwegian Government, “Norwegian Data Centres – Sustainable, Digital Powerhouses,” regjeringen.no A cool ambient climate supports extensive free cooling, enabling typical PUE readings around 1.1, well below the 1.57 global benchmark. In February 2025 the government raised grid-allocation priority for sites with heat-recovery, rewarding operators that integrate with Oslo’s district-heating grid.These factors attract global firms aligning infrastructure with corporate ESG targets while protecting margins. The combined sustainability and cost edge is a long-run catalyst for the Oslo data center market.
AI-Driven Hyperscale Demand Spike (2025–2030)
Surging AI workloads increase rack densities and push multi-megawatt expansions. By 2030, AI-ready halls are expected to represent 70% of Nordic capacity. Google’s EUR 600 million facility in Skien alone could draw 5% of Norway’s total power when live in 2026.[2]ITPro, “Google Breaks Ground on Its First Norwegian Data Center,” itpro.com Hardware vendors respond with high-bandwidth SmartNICs and liquid-cooling solutions designed for 200-400 Gbps traffic. For Oslo, hyperscale appetite means larger campuses, innovative cooling and substantial grid-connection requests that reshape power-planning discussions. This AI-centric wave is a core growth engine for the Oslo data center market.
New Trans-Atlantic and Arctic Connect Cables Landing in Oslofjord
The Arctic Way Cable (USD 250 million) will link mainland Norway with Jan Mayen and Svalbard, giving Oslo the world’s northernmost subsea path by 2028.[3]Space Norway and SubCom, “Contract-in-Force for Arctic Way Cable System,” subcom.comFar North Fiber adds a Europe-Asia link via North America, while the N0R5KE Viking ring connects Bergen and Oslo with 192-core fiber by late 2025. Reduced latency, path diversity and sovereign routing make Oslo more attractive for latency-sensitive workloads and disaster-recovery nodes. Enhanced connectivity further accelerates investment in the Oslo data center market.
District-Heating Off-Take Agreements Monetising Waste Heat
Stack Infrastructure exports about 3.5 MW of heat from OSL01 into the Hafslund Oslo Celsio network, warming 5,000 homes and displacing 25 GWh of alternative energy annually. New builds such as Skygard in Hovinbyen are engineered for similar circular-energy model. These projects turn thermal waste into a revenue stream, align with municipal climate goals and position operators favorably with regulators. Such monetization adds depth to the Oslo data center market and illustrates how sustainability becomes a competitive lever.
Restraints Impact Analysis*
| Restraint | (~) % Impact on CAGR Forecast | Geographic Relevance | Impact Timeline |
|---|---|---|---|
| Land-use moratoriums in Greater Oslo | −1.8% | Metropolitan Oslo | Short term (≤ 2 years) |
| Rising Statnett grid-connection fees | −1.2% | National, Oslo focus | Medium term (2-4 years) |
| Skilled-labour scarcity for liquid cooling | −1.0% | National | Medium term (2-4 years) |
| Local opposition to transformer yards | −0.6% | Urban and suburban Oslo | Short term (≤ 2 years) |
| Source: Mordor Intelligence | |||
Land-Use Moratoriums in Greater Oslo
In July 2025 “data center” became a standalone land-use category, adding scrutiny to zoning reviews. The city’s Climate Budget 2024 sets a 95% emission-reduction target by 2030, tightening approval for developments near residential zones. Economic analyses show heightened friction for plots on farmland or close to housing, prompting operators to shift toward vertical designs or suburban sites. These planning obstacles temporarily slow expansions inside the beltway and influence project pipelines across the Oslo data center market.
Rising Grid-Connection Fees (Statnett Upgrade Backlog)
A single hyperscale request of 840 MW could equal 5.5% of national power consumption, underscoring grid-capacity stress. In 2024 government scrapped the discounted electricity tax for data centers, while wholesale prices remain volatile after the 2021 energy-price crisis. Statnett’s backlog lengthens connection timelines, forcing operators toward efficiency gains and long-term power-purchase agreements. Higher entry costs temper near-term growth across the Oslo data center market.
*Our forecasts treat driver/restraint impacts as directional, not additive. The impact forecasts reflect baseline growth, mix effects, and variable interactions.
Segment Analysis
By Data Center Size: Mega Facilities Reshape Landscape
Large facilities controlled 52.02% of the Oslo data center market share in 2025, reflecting the long-term prevalence of 5-20 MW builds. The mega class, defined at 45 MW and above, is projected to log a 14.93% CAGR to 2031, the fastest among all size bands. This escalation is anchored in AI and cloud scale economies, with operators consolidating capacity on campus-style estates that can double or triple through phased halls. Green Mountain’s 90-150 MW TikTok project and Bulk’s OS-IX expansion exemplify the path.
Mega builds stimulate innovation in supply-chain logistics, modular substation design and multi-stage liquid-cooling deployments. Land scarcity within Oslo pushes some projects to peripheral counties while keeping backbone fiber latency under 3 ms. Operators maintain medium facilities for custom enterprise deployments, and small sites increasingly migrate toward edge use cases. This rebalancing positions mega campuses as the growth nucleus of the Oslo data center market.


By Tier Type: Tier 4 Growth Signals Mission-Critical Shift
Tier 3 retained 70.65% share in 2025 thanks to its balance of N+1 redundancy and cost discipline. Yet Tier 4 is rising with a 19.05% CAGR as finance and government workloads demand 2N topology and fault-tolerant architecture. Facilities chasing Tier 4 certification emphasize dual active power paths, concurrent maintenance and fault-isolated cooling loops.
Projects like DigiPlex Fetsund target PUE 1.1 via indirect-evaporative air systems while meeting Tier 4 requirements. Achieving Tier 4 bolsters data-sovereignty credentials in an increasingly regulated EU context. With stricter uptime obligations, the Oslo data center market size for Tier 4 builds will grow steadily, while Tier 1/2 footprints shrink to niche requirements.
By Data Center Type: CSPs Lead Growth Trajectory
Colocation vendors delivered 71.58% of 2025 capacity, leveraging flexible leases and carrier-neutral ecosystems. However, Cloud Service Providers will pace the field with an 18.32% CAGR as global platforms deploy Nordic availability zones. Google’s 2026 Skien hyperscale is emblematic, targeting 99% carbon-free energy blends itpro.com.
The CSP build-out increases average rack density to 30-50 kW and accelerates adoption of liquid cooling and 48 V DC power distribution. Enterprises still value dedicated colocation suites for control and compliance, but workload migration toward public cloud recalibrates demand patterns. These shifts collectively sustain high utilization rates and reinforce the primacy of CSP footprints in the Oslo data center market.
By Utilized, Colocation Type : Hyperscale Demand Reshapes Market
Wholesale colocation represented 37.74% of the Oslo data center market size in 2025, offering dedicated suites prewired for tenant fit-out. Hyperscale colocation grows fastest at 14.74% CAGR because cloud and AI tenants prefer multi-megawatt blocks with SLA flexibility. Bulk’s May 2025 OS-IX halls, scaling up to 50 kW per rack, target this profile.
Retail footprints remain relevant for SMEs needing one-to-five-rack footprints with managed services. Operators segment facilities, dedicating separate electrical risers for hyperscale clients to isolate load profiles from retail zones. This bifurcation maximizes asset yield and underscores the hyperscale-centric opportunity inside the Oslo data center market.
By Utilized, End User: Manufacturing Sector Leads Growth
Cloud and IT services held 22.05% share in 2025 as SaaS and platform operators built core clusters. Manufacturing capacity is projected to climb 15.34% CAGR, propelled by Industry 4.0 sensors, AI-driven quality control and predictive maintenance. Telenor’s 2025 “AI factory” underscores industrial demand for dedicated compute tied into operational technology stacks.
Other sectors—telecom, media, BFSI, government, and e-commerce—continue to deploy secure nodes, but industrial digitalization sets the fastest cadence. Edge micro-sites appear near production lines to cut latency below 10 ms. This industrial momentum diversifies revenue and amplifies sector resilience across the Oslo data center market.
Geography Analysis
Oslo city concentrates fiber rings, subsea-cable landings and skilled labor, anchoring the bulk of national capacity. Projects such as Skygard’s NOK 2.4 billion urban site mix secure data halls with public green space, illustrating how operators adapt to urban zoning while staying within 5 km of the city center. The clustering effect cultivates specialist contractors, resilient power suppliers and dark-fiber providers that reinforce Oslo’s dominance in the Oslo data center market.
Peripheral counties Akershus and Østfold emerge as cost-effective spill-over zones, offering larger land parcels and easier permitting. Green Mountain and other hyperscale players prefer these areas for campus footprints while maintaining sub-3 ms latency to the Oslo Internet Exchange. Grid upgrades lag demand, so developers often phase build-outs around staged Statnett connections or behind-the-meter renewables.
Coastal nodes near Oslofjord gain profile as new cable landfalls like Arctic Way and N0R5KE Viking shorten trans-Atlantic hops. These sites marry direct fiber to continental exchanges with access to offshore wind, making them ideal for edge clusters and content-delivery nodes. Collectively, the tri-regional configuration—urban core, suburban counties and coastal landing zones—creates a balanced topology that enhances resilience and scalability across the Oslo data center market.
Competitive Landscape
The Oslo data center market is moderately consolidated with several players like Stack Infrastructure, Inc., Bulk Infrastructure Group AS, Blix Solutions AS, etc. The companies continuously invest in strategic partnerships and product developments to gain substantial market share. Some of the recent developments in the market are:
In May 2023, DE-CIX announced that its new DE-CIX IXs were available in Oslo and Kristiansand bulk data centers. Its InterconnectionFLEX service will be available through a collaboration with Bulk Infrastructure Group, providing users with an interconnection package for peering, cloud connectivity, and private network interconnects (PNIs). Customers will also have direct access to more than 50 clouds, 2000+ local and international networks, and more than 250 data centers in Germany, Southern Europe, and the United States.
In January 2023, Green Mountain completed building a new 13.5 MW data center adjacent to its current OSL1-Enebakk campus. This is the campus's third data center, designed for colocation. With this addition, the data center campus in Enebakk now has three data centers. The first two 4MW data centers will house a single tenant, while the third 13.5MW structure will host multiple tenants. The 10,000 m2 three-story building is designed to Tier 3 standards and has 1,300 m2 of white space on each floor. Capacity has already been reserved for numerous clients, although there is still some available capacity in this building and future planned campus extensions.
Oslo Data Center Industry Leaders
Stack Infrastructure
Bulk Infrastructure
Green Mountain
DigiPlex (Stack EMEA)
Lefdal Mine Datacenter
- *Disclaimer: Major Players sorted in no particular order

Recent Industry Developments
- May 2025: Bulk Infrastructure added three high-density halls at OS-IX, supporting 3-50 kW per rack
- May 2025: Space Norway and SubCom signed the Arctic Way Cable System contract, linking mainland Norway, Jan Mayen and Svalbard
- May 2025: Government exempted firms that export renewable power to the grid from electricity tax, effective July 2025
- April 2025: TikTok began operating all three Green Mountain buildings in Norway
- March 2025: Polar unveiled an AI-ready, fully renewable data center in Norway
- March 2025: Telenor launched the country’s first AI factory and outlined plans for a dedicated data center


Research Methodology Framework and Report Scope
Market Definitions and Key Coverage
Our study defines the Oslo data center market as the annual value generated by live facilities located within the Greater Oslo grid zone that provide colocation, self-built hyperscale, and enterprise data services in which primary workloads are processed, stored, or transmitted. Revenues include recurring space and power fees, cross-connects, and carrier-neutral meet-me rooms, converted to USD at average NOK rates.
Scope exclusion: disaster recovery pods housed outside the municipal boundary and pure cloud software revenues are not counted.
Segmentation Overview
- By Data Center Size
- Small
- Medium
- Large
- Massive
- Mega
- By Tier Type
- Tier 1 and 2
- Tier 3
- Tier 4
- By Data Center Type
- Cloud Service Providers (CSPs)
- Enterprise, Modular and Edge
- Colocation
- Utilized
- Colocation Type
- Retail
- Wholesale
- Hyperscale
- End User
- Cloud and IT
- Telecom
- Media and Entertainment
- Government
- BFSI
- Manufacturing
- E-Commerce
- Other End User
- Colocation Type
- Non-Utilized
- Utilized
Detailed Research Methodology and Data Validation
Primary Research
Mordor analysts interviewed facility managers, utility executives, and cloud migration consultants across Oslo, Vestland, and Trøndelag. Their inputs refined assumptions on typical rack utilization, average selling price per kW, and project-level energization dates, allowing us to close gaps left by desk research and to stress test early model outputs.
Desk Research
We began by mapping Norway's digital infrastructure stack using open datasets from Statnett (grid capacity additions), the Norwegian Communications Authority (fiber landing licenses), Enova (energy efficiency grants), and Eurostat power price indices. Trade association briefs from the Norwegian Data Center Industry group, patent filings on liquid cooling (Questel), and company 10-Ks enriched supply side insights. We then screened press releases, planning board minutes, and customs import codes for high-density racks to pinpoint fresh capacity. D&B Hoovers offered capex run rates for key operators. These sources are illustrative; several other public and subscription references supported data collection, validation, and clarification needs.
Market Sizing and Forecasting
A top down model starts with Statnett production and trade data to reconstruct the demand pool, followed by a capacity utilization roll up that links MW installed to monetized square foot uptake. Select bottom up checks, sampled operator revenues and channel ASP multiplied by deployed kW, help us adjust totals. Key variables guiding projections include wholesale electricity tariff trends, average PUE ratios, hyperscaler rack density shifts, submarine cable activations, and enterprise cloud migration rates. Multivariate regression, chosen for its transparency, couples these drivers with macro indicators to forecast value through 2030. Where bottom up estimates lack granularity, interpolation using colocation white space absorption and build to suit delivery lags fills the void.
Data Validation and Update Cycle
Outputs pass a three layer review: automated variance scans, peer analyst audits, and senior sign off. We refresh the model each year and trigger interim revisions when grid tariff resets, large campus launches, or policy shifts materially move the market. Before publication, an analyst reruns the latest inputs so clients always receive an up to date viewpoint.
Why Mordor's Oslo Data Center Baseline Commands Reliability
Published estimates vary, and buyers often wonder why.
Divergences usually stem from whether studies treat full Norway versus Oslo only revenues, include one off capex, or translate NOK to USD at spot rather than period average rates.
Benchmark comparison
| Market Size | Anonymized source | Primary gap driver |
|---|---|---|
| USD 1.45 billion (2025) | Mordor Intelligence | - |
| USD 1.55 billion (2024) | Global Consultancy A | Counts national investment outlays, not operating revenue; different base year and currency basis |
| USD 2.82 billion (2023) | Industry Tracker B | Combines Norway wide colocation revenue with hyperscaler capex; omits exchange rate normalization and Oslo share split |
The comparison shows that figures swing when scope widens or when capital expenses are mixed with recurring revenue. By anchoring on operating income generated within Oslo's power metered facilities and by updating inputs annually, Mordor Intelligence delivers a balanced, transparent baseline that decision makers can replicate and trust.


Key Questions Answered in the Report
How large is the Oslo data center market in 2026?
The Oslo data center market size is 185.34 MW in 2026, with a projected rise to 327.61 MW by 2031 at a 12.06% CAGR.
Which facility size segment is expanding fastest?
Mega data centers show the highest growth, registering a 14.93% CAGR between 2026 and 2031 as hyperscale and AI workloads concentrate.
Why are Tier 4 data centers gaining momentum?
Stricter uptime, data-sovereignty and compliance needs push enterprises toward Tier 4 redundancies, giving this class a 19.05% CAGR through 2031.
What makes Oslo attractive for sustainability-focused operators?
Access to 100% renewable hydro power, a cold climate enabling low PUE ratios, and incentives for waste-heat recovery combine to lower operating costs and emissions.
How is submarine-cable expansion impacting Oslo’s position?
New systems such as Arctic Way, Far North Fiber and N0R5KE Viking reduce latency, improve route diversity and strengthen Oslo’s role as a northern digital gateway.
What policy challenges could slow near-term growth?
Land-use moratoriums in Greater Oslo and rising grid-connection fees due to Statnett’s upgrade backlog increase permitting complexity and capital costs for developers.
Page last updated on:


