Denmark Data Center Market Size and Share
Market Overview
| Study Period | 2020 - 2031 |
|---|---|
| Forecast Data Period | 2026 - 2031 |
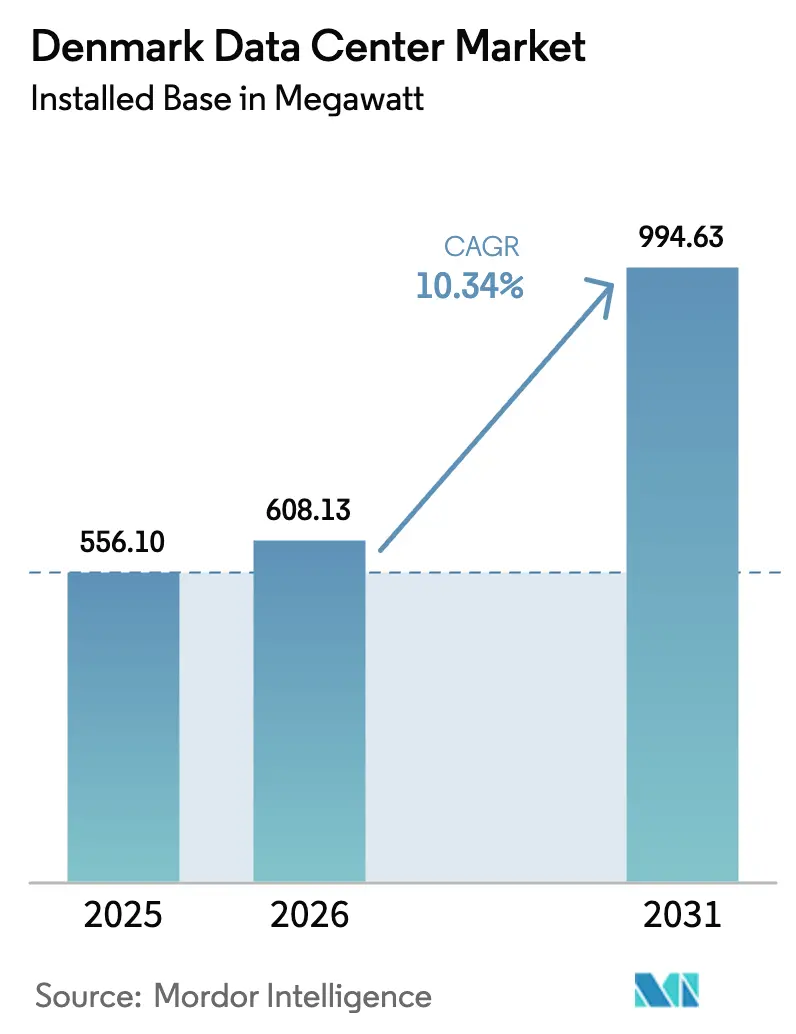
| Base Year Market Size (2025) | 556.10 megawatt |
| Market Volume (2026) | 608.13 megawatt |
| Market Volume (2031) | 994.63 megawatt |
| Growth Rate (2026 - 2031) | 10.34% CAGR |
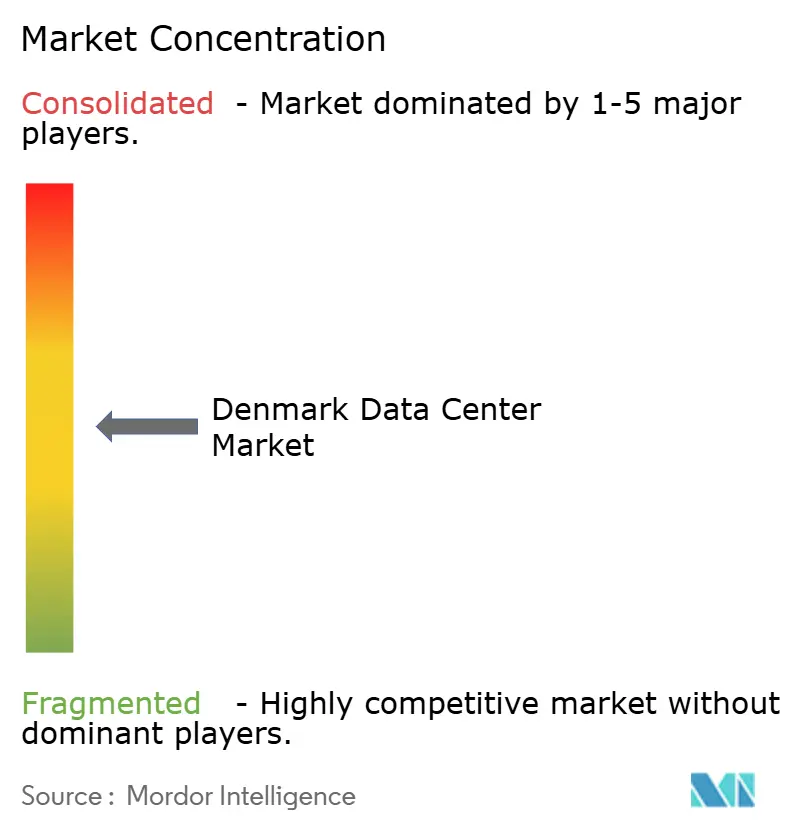
| Market Concentration | Medium |
Major Players *Disclaimer: Major Players sorted in no particular order Image © Mordor Intelligence. Reuse requires attribution under CC BY 4.0. | |
Denmark Data Center Market Analysis by Mordor Intelligence
The Denmark data center market size in terms of installed base is projected to expand from 556.10 megawatt in 2025 and 608.13 megawatt in 2026 to 994.63 megawatt by 2031, registering a CAGR of 10.34% between 2026 to 2031. Rapid green-field builds in West Denmark, strong sovereign support for AI infrastructure, and mandatory heat-reuse rules are reshaping capital-allocation patterns. Hyperscale cloud providers are internalizing capacity to secure renewable-energy power purchase agreements, while colocation specialists are upgrading existing halls to liquid-cooling systems to host GPU clusters for large language models. Nationwide 5G and FTTP coverage, coupled with three new submarine-cable routes, is shortening latency paths and bringing edge workloads closer to users. At the same time, Denmark’s fast-track permitting regime and 22% corporate income tax rate draw foreign investors, even as looming grid congestion forces operators to co-design projects with Energinet. The interplay of these forces underpins the double-digit trajectory of the Denmark data center market through 2031.
Key Report Takeaways
- By data-center size, large facilities led with a 39.14% of installed load in 2025, whereas hyperscale buildouts are forecast to grow at a 11.12% CAGR through 2031.
- By tier type, tier 3 installations accounted for 49.15% of the Denmark data center market share in 2025, while tier 4 capacity is expected to post the fastest expansion at an 11.43% CAGR through 2031.
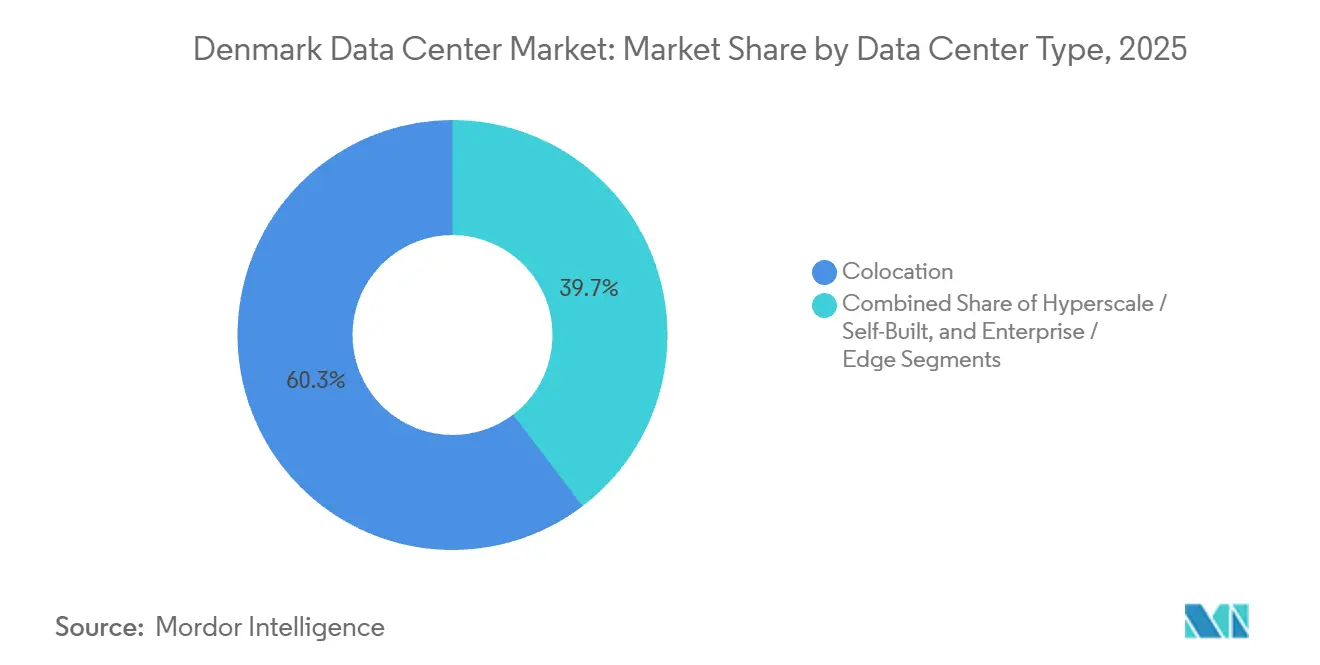
- By data-center type, colocation accounted for 60.35% of installed load in 2025, yet hyperscale and self-built projects are projected to grow at a 11.56% CAGR during 2026-2031.
- By end user, IT and ITES accounted for 58.61% of installed load in 2025, while BFSI workloads are anticipated to register a 12.59% CAGR by 2031.
- By hotspot, Copenhagen retained a 59.29% share in 2025; however, the rest-of-Denmark campuses are poised to climb at an 11.78% CAGR over the forecast horizon.
Note: Market size and forecast figures in this report are generated using Mordor Intelligence’s proprietary estimation framework, updated with the latest available data and insights as of 2026.
Denmark Data Center Market Trends and Insights
Driver Impact Analysis*
| Driver | (~) % Impact on CAGR Forecast | Geographic Relevance | Impact Timeline |
|---|---|---|---|
| Cloud and AI-Driven Hyperscale Expansion | +2.8% | National, with concentration in Esbjerg, Skive, and Greater Copenhagen | Medium term (2-4 years) |
| Renewable-Power Advantage and Heat-Reuse Mandates | +2.1% | National, with early gains in Copenhagen, Ballerup, Esbjerg | Long term (≥ 4 years) |
| 5G and Nationwide FTTP Enabling Edge Demand | +1.5% | National, with urban edge deployments in Copenhagen, Aarhus, Odense | Short term (≤ 2 years) |
| Government Tax Incentives and Fast-Track Permitting | +1.3% | National, particularly West Denmark (Esbjerg, Varde) | Medium term (2-4 years) |
| Nordic Sovereign Green Bond Funding for Cooling Innovation | +0.9% | National, with spillover to Sweden and Norway | Long term (≥ 4 years) |
| Cross-Border Grid-Balancing Agreements Reducing Curtailment Risk | +0.7% | National, with emphasis on North Sea offshore wind integration zones | Long term (≥ 4 years) |
| Source: Mordor Intelligence | |||


Cloud and AI-Driven Hyperscale Expansion
Microsoft’s multi-billion-dollar West Denmark program, the country’s largest foreign investment in 36 years, anchors a new Azure region due in 2026 and parallel builds in Esbjerg and Varde. Each site secures 100% carbon-free PPAs from offshore wind farms, reflecting hyperscalers’ preference for direct control of energy sourcing and latency routes. Digital Realty’s Copenhagen campus now hosts the Gefion AI supercomputer, equipped with 1,528 Nvidia H100 GPUs, positioning Denmark as a Nordic model for large-language-model training.[1]Digital Realty Trust Inc., “Digital Realty Copenhagen Campus,” digitalrealty.comDomestic newcomer Thylander is targeting Phase 1 delivery of a 200 MW campus in Esbjerg during 2026, marking the first Danish-owned hyperscale platform and signaling a strategic shift toward local ownership of critical workloads. CA Group’s planned 100 MW AI-ready center at GreenLab Skive couples waste-heat export, on-site storage, and industrial symbiosis to unlock grid flexibility. These moves illustrate why hyperscale megawatts are expanding faster than the overall Denmark data center market.
Renewable-Power Advantage and Heat-Reuse Mandates
A July 2025 decision to scrap Denmark’s district-heating price cap lets operators negotiate market-based tariffs for surplus heat, turning what was once a cost center into a revenue stream. atNorth’s DEN01 in Ballerup will channel recovered heat to Vestforbrænding, warming 8,000 homes by 2028 and demonstrating the appeal of direct-liquid-cooling designs. Microsoft already heats 6,000 homes from its Høje-Taastrup campus, while Meta’s Odense site delivers 100,000 MWh annually, showing that heat export is now a license-to-operate requirement rather than a sustainability add-on. Denmark’s stricter transposition of the EU Energy Efficiency Directive obliges sites above 500 kW to publish an Energy Reuse Factor, accelerating investment in higher-grade thermal capture solutions. As municipalities increasingly insist on integrated heat networks, developers that cannot demonstrate circular-economy credentials risk delayed permits or lost bids.
5G and Nationwide FTTP Enabling Edge Demand
By end-2025 Denmark achieved 100% population coverage with 5G and 97% Very High Capacity Network fiber reach, lowering round-trip latency for edge and IoT applications. GlobalConnect’s 2,600 km super-fiber loop linking Sweden, Denmark, and Germany enables sub-10-millisecond paths between Copenhagen and Hamburg, favoring micro-data-center deployments in logistics corridors. The COBRA subsea cable delivers sub-9-millisecond latency to Amsterdam using G.654.D fiber that supports 400G and 800G optics, a key enabler for high-frequency trading. DE-CIX Copenhagen, operational in January 2025, further reduces IP transit costs for regional ISPs, thereby driving incremental rack demand in edge-optimized halls. Collectively, these upgrades foster a distributed build pattern that complements rather than cannibalizes hyperscale campuses.
Government Tax Incentives and Fast-Track Permitting
Denmark’s 22% corporate income tax and R&D allowances of up to 25% on qualifying spend provide one of Western Europe’s friendliest fiscal packages. The Danish Business Authority fast-tracks strategic investments above EUR 100 million, trimming approval cycles from 18 to fewer than 12 months for projects demonstrating renewable-energy integration and local hiring. Thylander’s Esbjerg plan and CA Group’s Skive facility both leveraged municipal data center zoning and pre-approved environmental baselines to compress time-to-build.[2] Danish Business Authority, “Investment Incentives and Fast-Track Permitting,” danishbusinessauthority.dkThese incentives encourage a shift in capital pipelines away from Sweden and Norway, where permitting steps remain more fragmented.
Restraints Impact Analysis*
| Restraint | (~) % Impact on CAGR Forecast | Geographic Relevance | Impact Timeline |
|---|---|---|---|
| Looming Grid Capacity Deficit and Offshore Wind Delays | -1.4% | National, with acute bottlenecks in Greater Copenhagen and North Jutland | Medium term (2-4 years) |
| Strict Excess-Heat Price-Cap Rules Limiting ROI | -0.8% | National, with historical impact in Copenhagen and Odense (rule removed July 2025) | Short term (≤ 2 years) |
| Scarcity of Data-Center-Skilled Labour | -0.6% | National, with spillover talent competition from Sweden and Norway | Medium term (2-4 years) |
| Rising Land Prices in Greater Copenhagen | -0.5% | Greater Copenhagen, Ballerup, Høje-Taastrup | Short term (≤ 2 years) |
| EU Taxonomy Reporting Raising Financing Hurdles | -0.4% | National, with emphasis on operators seeking green-bond financing | Long term (≥ 4 years) |
| Source: Mordor Intelligence | |||
Looming Grid Capacity Deficit and Offshore Wind Delays
Energinet warns that without DKK 40 billion (USD 5.7 billion) of transmission upgrades by 2028, connection queues for large projects will exceed 24 months.[3]Energinet, “Grid Investment Plan 2025-2028,” energinet.dkDemand stems from both the electrification of transport and the 400 MW data-center pipeline. Construction delays on North Sea turbines have pushed several gigawatts of green power to post-2027 timelines, intensifying competition for available megawatts. Hyperscalers with deep capital pools can fund on-site batteries and peak-shaving assets, but smaller colocation vendors may face prohibitive costs, potentially shifting workloads to Sweden or Norway, where spare grid headroom is larger.
Scarcity of Data-Center-Skilled Labor
Danish operators lack certified personnel experienced in liquid cooling, GPU cluster power distribution, and ISO 27001 Tier 4 operations. atNorth’s DEN01 took 12 months to staff despite premium pay, and CA Group expects to recruit from Germany and Poland for specialized roles. Universities in Aarhus and Aalborg are scaling up vocational programs, but the first sizable cohort will graduate only in 2028, extending the talent pinch for another 2 to 3 years.
*Our forecasts treat driver/restraint impacts as directional, not additive. The impact forecasts reflect baseline growth, mix effects, and variable interactions.
Segment Analysis
By Data Center Size: Hyperscale Leads New Megawatts
Large facilities held 39.14% of the Denmark data center market share in 2025. However, the Denmark data center market size allocated to hyperscale campuses is projected to grow at a 11.12% CAGR through 2031, driven by Thylander’s 200 MW Esbjerg and CA Group’s 100 MW Skive projects. Digital Realty and STACK Infrastructure still dominate the large-facility tier, but both face price pressure as hyperscalers negotiate wholesale rates below USD 80 per kW.
Growth beyond 2026 is skewed toward building above 50 MW because GPU-dense AI clusters require liquid-cooling systems and on-site 132-kV grid feeds. Operators in the medium tier (1-10 MW) are pivoting toward edge and hybrid cloud services, while sub-1 MW sites, such as AtlasEdge Copenhagen, focus on disaster recovery racks and telecom aggregation nodes. The resulting barbell pattern explains why hyperscale megawatts outpace every other size band despite their smaller count of individual sites.


By Tier Type: Compliance Pulls Demand To Tier 4
Tier 3 halls accounted for 49.15% of the installed load in 2025, yet upcoming regulations are routing fresh contracts toward 2N+1 designs. The Denmark data center market size earmarked for Tier 4 halls is forecast to widen at an 11.43% CAGR, reflecting BFSI policies that call for 99.999% uptime and georedundant power feeds. Colocation suppliers are selectively upgrading existing Tier 3 blocks with extra generators and isolation breakers to compete. Many have begun pre-wiring galleries for direct-to-chip liquid cooling and adding second-site control rooms to certify to Tier 4 without disrupting live workloads.
The Denmark data center market share for Tier 1 and Tier 2 is shrinking because operators struggle to meet NIS2-mandated incident reporting and partitioning requirements within legacy envelopes. ISO 27001 audits are also uncovering operational gaps, prompting enterprises to exit older leases before their terms end and consolidate into more resilient footprints. Rising electricity taxes on inefficient plants further erode the economics of low-tier facilities, accelerating site closures in Copenhagen’s inner suburbs.
By Data Center Type: Self-Builds Gain Ground
Colocation still accounts for 60.35% of 2025 megawatts, but the Denmark data center market, tied to self-built and hyperscale estates, is growing fastest at a 11.56% CAGR. Microsoft, Google, and Meta all prefer vertically integrated campuses so they can capture heat-export revenues and fine-tune grid-stability services. Their investment committees also view direct ownership as insurance against supply-chain shocks, reducing dependence on third-party fit-out schedules.
Colocation incumbents are replying with powered-shell and build-to-suit offers. STACK’s COP02 masterplan allows either wholesale leases or single-tenant halls, while Digital Realty has launched AI-ready pods within its Copenhagen campus. Enterprise and edge operators expand more slowly, yet in absolute terms add more racks because of the larger 2025 base. Some are negotiating flexible five-year blocks that convert to private suites once the load passes predefined thresholds.
By End User: BFSI Outperforms
IT and ITES workloads accounted for 58.61% of the installed load in 2025, but BFSI is the fastest-growing sector, expected to post a 12.59% CAGR through 2031. Danske Bank’s migration of 16,600 servers to AWS, alongside strict DORA resilience rules, has led peers to seek Tier 4 colocation within Danish borders. E-commerce marketplaces are layering real-time inventory engines onto GPU farms housed in colocation wings, expanding average rack density from 6 kW to more than 12 kW as order-fulfillment windows shrink to same-day delivery. Media and entertainment platforms are adopting 8K streaming pilots that require edge POPs in Odense and Aalborg, creating new demand for sub-10-millisecond packet paths that existing hyperscale campuses cannot satisfy on their own.
Government and research institutions are another expanding cohort. DeiC’s interactive HPC expansion will make GPU cycles available as a national utility, enabling public agencies to run computer-vision workloads for traffic monitoring and offshore-wind inspection without purchasing dedicated hardware. Manufacturing groups centered in Central Jutland are trialing digital twins and closed-loop process controls that depend on deterministic network latency, pushing telecom carriers toward multi-access edge sites clustered around industrial parks. Healthcare and logistics operators lag in absolute megawatts but are accelerating pilot projects that combine data-sovereign private clouds with burst capacity on Denmark-based hyperscale regions, signaling that even conservative verticals are advancing beyond on-premises silos.
Geography Analysis
Copenhagen owned 59.29% of 2025 capacity, yet land shortages and grid queues constrain the development of new plots. Consequently, the Denmark data center market size in the rest of Denmark is projected to expand at an 11.78% CAGR, compared with Copenhagen’s 9.8%. Esbjerg, Skive, and Herning benefit from lower land prices and direct fiber to Germany, although they lack the submarine cable density of the capital. Colocation providers that need sub-10-millisecond access to financial districts will continue to cluster in Ballerup and Høje-Taastrup, but mega-campuses will trend westward.
West Denmark’s share of the Denmark data center market size is on track to climb rapidly as Microsoft, Thylander, and CA Group deploy more than 350 MW of incremental IT load between 2026 and 2030. Esbjerg, in particular, offers direct terrestrial fiber to Hamburg and Frankfurt, 220-kV grid interconnects, and North Sea wind-farm PPAs that lock in long-term price certainty. Thylander’s campus alone is expected to export enough residual heat to warm 25,000 homes, giving local authorities a strong incentive to expedite permits.
Central Jutland and Zealand fall between these poles. Aarhus and Odense court regional enterprises with mid-sized halls that bundle managed services, but their growth trajectory depends on how quickly Energinet can reinforce 132-kV lines and whether municipalities roll out district-heating tie-ins. Overall, the geographic map of the Denmark data center market shows a two-node model; Copenhagen for peering density, West Denmark for hyperscale capacity.
Competitive Landscape
Denmark hosts a moderately fragmented operator roster. Digital Realty and STACK Infrastructure together operate roughly 70 MW of commissioned IT load, representing about 12% of 2025 installed capacity. atNorth, Bulk Infrastructure, and Prime Data Centers lead the forward pipeline, with combined announcements totaling more than 400 MW. Domestic entrant Thylander challenges historic foreign dominance with a 200 MW Esbjerg campus that introduces local ownership and a tighter integration with municipal utilities. This evolving mix keeps supplier bargaining power balanced, preventing any single vendor from dictating wholesale pricing.
Hyperscalers continue to favor self-builds. Microsoft’s West Denmark investment secures exclusive grid connections and tailored PPAs, while Google’s Fredericia center leverages 100% renewable power and heat-export economics. Meta, conversely, froze further Odense expansion to divert capital toward AI-optimized GPU estates, underscoring the strategic pivot underway across Big Tech portfolios. Their collective decisions ripple downstream, guiding where fiber routes, transformer yards, and talent pipelines emerge over the next five years.
Colocation specialists adapt by emphasizing compliance and circular-economy credentials. Digital Realty’s Gefion supercomputer suite is ISO 27001 and SOC 2 certified, and atNorth’s DEN01 employs direct liquid cooling to achieve a sub-1.2 PUE. Smaller providers lacking capital for Tier 4 retrofits or liquid-cooling upgrades face consolidation pressure, especially as NIS2 rules mandate distinct emergency and cyber coordinators for critical sites. Many are already exploring joint ventures with energy utilities or telecom carriers to secure funding for modernization without ceding operating contro
Denmark Data Center Industry Leaders
Apple Inc.
Microsoft Corporation
Google LLC
Meta Platforms Inc.
Digital Realty Trust Inc.
- *Disclaimer: Major Players sorted in no particular order

Recent Industry Developments
- January 2026: CA Group confirmed a flexible 100 MW AI data center at GreenLab Skive, fully integrated with SymbiosisNet for heat-reuse and grid services, targeting completion in 2027.
- January 2026: DeiC began enlarging its Interactive HPC footprint with a GPU-rich hall slated for late-spring 2026 start-up at the University of Southern Denmark.
- December 2025: UpCloud activated a new cloud region in Ballerup, adding retail colocation capacity for sub-10-millisecond Copenhagen access.
- November 2025: atNorth signed a Vestforbrænding agreement to supply excess heat from its 22.5 MW DEN01 facility, warming 8,000 homes from 2028 onward.


Denmark Data Center Market Report Scope
The data center market encompasses the infrastructure, services, and technologies that support the storage, management, and processing of data. This market includes various data center sizes, tier classifications, types, end-user industries, and hotspots, reflecting the diverse needs of businesses and organizations operating in the country.
The Denmark Data Center Market Report is Segmented by Data Center Size (Small, Medium, Large, and Hyperscale), Tier Type (Tier 1 and 2, Tier 3, and Tier 4), Data Center Type (Hyperscale/Self-Built, Enterprise/Edge, and Colocation), End User (BFSI, IT and ITES, E-Commerce, Government, Manufacturing, Media and Entertainment, Telecom, and Other End Users), and Hotspot (Copenhagen, and Rest of Denmark). The Market Forecasts are Provided in Terms of IT Load Capacity (Megawatt).
| Small |
| Medium |
| Large |
| Hyperscale |
| Tier 1 and 2 |
| Tier 3 |
| Tier 4 |
| Hyperscale / Self-Built | ||
| Enterprise / Edge | ||
| Colocation | Non-Utilized | |
| Utilized | Retail Colocation | |
| Wholesale Colocation | ||
| BFSI |
| IT and ITES |
| E-Commerce |
| Government |
| Manufacturing |
| Media and Entertainment |
| Telecom |
| Other End Users |
| Copenhagen |
| Rest of Denmark |
| By Data Center Size | Small | ||
| Medium | |||
| Large | |||
| Hyperscale | |||
| By Tier Type | Tier 1 and 2 | ||
| Tier 3 | |||
| Tier 4 | |||
| By Data Center Type | Hyperscale / Self-Built | ||
| Enterprise / Edge | |||
| Colocation | Non-Utilized | ||
| Utilized | Retail Colocation | ||
| Wholesale Colocation | |||
| By End User | BFSI | ||
| IT and ITES | |||
| E-Commerce | |||
| Government | |||
| Manufacturing | |||
| Media and Entertainment | |||
| Telecom | |||
| Other End Users | |||
| By Hotspot | Copenhagen | ||
| Rest of Denmark | |||


Market Definition
- IT LOAD CAPACITY - The IT load capacity or installed capacity, refers to the amount of energy consumed by servers and network equipments placed in a rack installed. It is measured in megawatt (MW).
- ABSORPTION RATE - It denotes the extend to which the data center capacity has been leased out. For instance, a 100 MW DC has leased out 75 MW, then absorption rate would be 75%. It is also referred as utilization rate and leased-out capacity.
- RAISED FLOOR SPACE - It is an elevated space build over the floor. This gap between the original floor and the elevated floor is used to accommodate wiring, cooling, and other data center equipment. This arrangement assist in having proper wiring and cooling infrastructure. It is measured in square feet (ft^2).
- DATA CENTER SIZE - Data Center Size is segmented based on the raised floor space allocated to the data center facilities. Mega DC - # of Racks must be more than 9000 or RFS (raised floor space) must be more than 225001 Sq. ft; Massive DC - # of Racks must be in between 9000 and 3001 or RFS must be in between 225000 Sq. ft and 75001 Sq. ft; Large DC - # of Racks must be in between 3000 and 801 or RFS must be in between 75000 Sq. ft and 20001 Sq. ft; Medium DC # of Racks must be in between 800 and 201 or RFS must be in between 20000 Sq. ft and 5001 Sq. ft; Small DC - # of Racks must be less than 200 or RFS must be less than 5000 Sq. ft.
- TIER TYPE - According to Uptime Institute the data centers are classified into four tiers based on the proficiencies of redundant equipment of the data center infrastructure. In this segment the data center are segmented as Tier 1,Tier 2, Tier 3 and Tier 4.
- COLOCATION TYPE - The segment is segregated into 3 categories namely Retail, Wholesale and Hyperscale Colocation service. The categorization is done based on the amount of IT load leased out to potential customers. Retail colocation service has leased capacity less than 250 kW; Wholesale colocation services has leased capacity between 251 kW and 4 MW and Hyperscale colocation services has leased capacity more than 4 MW.
- END CONSUMERS - The Data Center Market operates on a B2B basis. BFSI, Government, Cloud Operators, Media and Entertainment, E-Commerce, Telecom and Manufacturing are the major end-consumers in the market studied. The scope only includes colocation service operators catering to the increasing digitalization of the end-user industries.
| Keyword | Definition |
|---|---|
| Rack Unit | Generally referred as U or RU, it is the unit of measurement for the server unit housed in the racks in the data center. 1U is equal to 1.75 inches. |
| Rack Density | It defines the amount of power consumed by the equipment and server housed in a rack. It is measured in kilowatt (kW). This factor plays a critical role in data center design and, cooling and power planning. |
| IT Load Capacity | The IT load capacity or installed capacity, refers to the amount of energy consumed by servers and network equipment placed in a rack installed. It is measured in megawatt (MW). |
| Absorption Rate | It denotes how much of the data center capacity has been leased out. For instance, if a 100 MW DC has leased out 75 MW, then the absorption rate would be 75%. It is also referred to as utilization rate and leased-out capacity. |
| Raised Floor Space | It is an elevated space built over the floor. This gap between the original floor and the elevated floor is used to accommodate wiring, cooling, and other data center equipment. This arrangement assists in having proper wiring and cooling infrastructure. It is measured in square feet/meter. |
| Computer Room Air Conditioner (CRAC) | It is a device used to monitor and maintain the temperature, air circulation, and humidity inside the server room in the data center. |
| Aisle | It is the open space between the rows of racks. This open space is critical for maintaining the optimal temperature (20-25 °C) in the server room. There are primarily two aisles inside the server room, a hot aisle and a cold aisle. |
| Cold Aisle | It is the aisle wherein the front of the rack faces the aisle. Here, chilled air is directed into the aisle so that it can enter the front of the racks and maintain the temperature. |
| Hot Aisle | It is the aisle where the back of the racks faces the aisle. Here, the heat dissipated from the equipment’s in the rack is directed to the outlet vent of the CRAC. |
| Critical Load | It includes the servers and other computer equipment whose uptime is critical for data center operation. |
| Power Usage Effectiveness (PUE) | It is a metric which defines the efficiency of a data center. It is calculated by: (𝑇𝑜𝑡𝑎𝑙 𝐷𝑎𝑡𝑎 𝐶𝑒𝑛𝑡𝑒𝑟 𝐸𝑛𝑒𝑟𝑔𝑦 𝐶𝑜𝑛𝑠𝑢𝑚𝑝𝑡𝑖𝑜𝑛)/(𝑇𝑜𝑡𝑎𝑙 𝐼𝑇 𝐸𝑞𝑢𝑖𝑝𝑚𝑒𝑛𝑡 𝐸𝑛𝑒𝑟𝑔𝑦 𝐶𝑜𝑛𝑠𝑢𝑚𝑝𝑡𝑖𝑜𝑛). Further, a data center with a PUE of 1.2-1.5 is considered highly efficient, whereas, a data center with a PUE >2 is considered highly inefficient. |
| Redundancy | It is defined as a system design wherein additional component (UPS, generators, CRAC) is added so that in case of power outage, equipment failure, the IT equipment should not be affected. |
| Uninterruptible Power Supply (UPS) | It is a device that is connected in series with the utility power supply, storing energy in batteries such that the supply from UPS is continuous to IT equipment even during utility power is snapped. The UPS primarily supports the IT equipment only. |
| Generators | Just like UPS, generators are placed in the data center to ensure an uninterrupted power supply, avoiding downtime. Data center facilities have diesel generators and commonly, 48-hour diesel is stored in the facility to prevent disruption. |
| N | It denotes the tools and equipment required for a data center to function at full load. Only "N" indicates that there is no backup to the equipment in the event of any failure. |
| N+1 | Referred to as 'Need plus one', it denotes the additional equipment setup available to avoid downtime in case of failure. A data center is considered N+1 when there is one additional unit for every 4 components. For instance, if a data center has 4 UPS systems, then for to achieve N+1, an additional UPS system would be required. |
| 2N | It refers to fully redundant design wherein two independent power distribution system is deployed. Therefore, in the event of a complete failure of one distribution system, the other system will still supply power to the data center. |
| In-Row Cooling | It is the cooling design system installed between racks in a row where it draws warm air from the hot aisle and supplies cool air to the cold aisle, thereby maintaining the temperature. |
| Tier 1 | Tier classification determines the preparedness of a data center facility to sustain data center operation. A data center is classified as Tier 1 data center when it has a non-redundant (N) power component (UPS, generators), cooling components, and power distribution system (from utility power grids). The Tier 1 data center has an uptime of 99.67% and an annual downtime of <28.8 hours. |
| Tier 2 | A data center is classified as Tier 2 data center when it has a redundant power and cooling components (N+1) and a single non-redundant distribution system. Redundant components include extra generators, UPS, chillers, heat rejection equipment, and fuel tanks. The Tier 2 data center has an uptime of 99.74% and an annual downtime of <22 hours. |
| Tier 3 | A data center having redundant power and cooling components and multiple power distribution systems is referred to as a Tier 3 data center. The facility is resistant to planned (facility maintenance) and unplanned (power outage, cooling failure) disruption. The Tier 3 data center has an uptime of 99.98% and an annual downtime of <1.6 hours. |
| Tier 4 | It is the most tolerant type of data center. A Tier 4 data center has multiple, independent redundant power and cooling components and multiple power distribution paths. All IT equipment are dual powered, making them fault tolerant in case of any disruption, thereby ensuring interrupted operation. The Tier 4 data center has an uptime of 99.74% and an annual downtime of <26.3 minutes. |
| Small Data Center | Data center that has floor space area of ≤ 5,000 Sq. ft or the number of racks that can be installed is ≤ 200 is classified as a small data center. |
| Medium Data Center | Data center which has floor space area between 5,001-20,000 Sq. ft, or the number of racks that can be installed is between 201-800, is classified as a medium data center. |
| Large Data Center | Data center which has floor space area between 20,001-75,000 Sq. ft, or the number of racks that can be installed is between 801-3,000, is classified as a large data center. |
| Massive Data Center | Data center which has floor space area between 75,001-225,000 Sq. ft, or the number of racks that can be installed is between 3001-9,000, is classified as a massive data center. |
| Mega Data Center | Data center that has a floor space area of ≥ 225,001 Sq. ft or the number of racks that can be installed is ≥ 9001 is classified as a mega data center. |
| Retail Colocation | It refers to those customers who have a capacity requirement of 250 kW or less. These services are majorly opted by small and medium enterprises (SMEs). |
| Wholesale Colocation | It refers to those customers who have a capacity requirement between 250 kW to 4 MW. These services are majorly opted by medium to large enterprises. |
| Hyperscale Colocation | It refers to those customers who have a capacity requirement greater than 4 MW. The hyperscale demand primarily originates from large-scale cloud players, IT companies, BFSI, and OTT players (like Netflix, Hulu, and HBO+). |
| Mobile Data Speed | It is the mobile internet speed a user experiences via their smartphones. This speed is primarily dependent on the carrier technology being used in the smartphone. The carrier technologies available in the market are 2G, 3G, 4G, and 5G, where 2G provides the slowest speed while 5G is the fastest. |
| Fiber Connectivity Network | It is a network of optical fiber cables deployed across the country, connecting rural and urban regions with high-speed internet connection. It is measured in kilometer (km). |
| Data Traffic per Smartphone | It is a measure of average data consumption by a smartphone user in a month. It is measured in gigabyte (GB). |
| Broadband Data Speed | It is the internet speed that is supplied over the fixed cable connection. Commonly, copper cable and optic fiber cable are used in both residential and commercial use. Here, optic cable fiber provides faster internet speed than copper cable. |
| Submarine Cable | A submarine cable is a fiber optic cable laid down at two or more landing points. Through this cable, communication and internet connectivity between countries across the globe is established. These cables can transmit 100-200 terabits per second (Tbps) from one point to another. |
| Carbon Footprint | It is the measure of carbon dioxide generated during the regular operation of a data center. Since, coal, and oil & gas are the primary source of power generation, consumption of this power contributes to carbon emissions. Data center operators are incorporating renewable energy sources to curb the carbon footprint emerging in their facilities. |


Research Methodology
Mordor Intelligence follows a four-step methodology in all our reports.
- Step-1: Identify Key Variables: In order to build a robust forecasting methodology, the variables and factors identified in Step-1 are tested against available historical market numbers. Through an iterative process, the variables required for market forecast are set and the model is built on the basis of these variables.
- Step-2: Build a Market Model: Market-size estimations for the forecast years are in nominal terms. Inflation is not a part of the pricing, and the average selling price (ASP) is kept constant throughout the forecast period for each country.
- Step-3: Validate and Finalize: In this important step, all market numbers, variables and analyst calls are validated through an extensive network of primary research experts from the market studied. The respondents are selected across levels and functions to generate a holistic picture of the market studied.
- Step-4: Research Outputs: Syndicated Reports, Custom Consulting Assignments, Databases & Subscription Platforms


