North America Satellite Attitude And Orbit Control System Market Size and Share
Market Overview
| Study Period | 2020 - 2031 |
|---|---|
| Forecast Data Period | 2026 - 2031 |
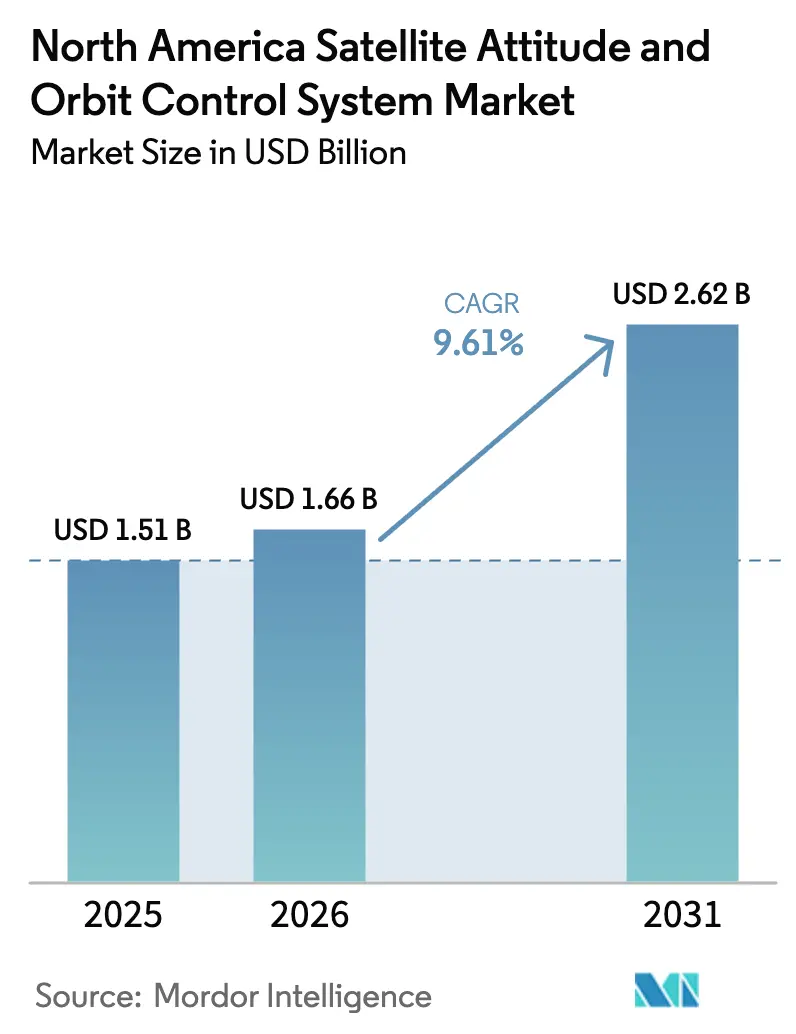
| Base Year Market Size (2025) | USD 1.51 Billion |
| Market Size (2026) | USD 1.66 Billion |
| Market Size (2031) | USD 2.62 Billion |
| Growth Rate (2026 - 2031) | 9.61% CAGR |
| Market Concentration | Medium |
Major Players *Disclaimer: Major Players sorted in no particular order Image © Mordor Intelligence. Reuse requires attribution under CC BY 4.0. | |
North America Satellite Attitude And Orbit Control System Market Analysis by Mordor Intelligence
The North America satellite attitude and orbit control system (AOCS) market size in 2026 is estimated at USD 1.66 billion, growing from 2025 value of USD 1.51 billion with 2031 projections showing USD 2.62 billion, growing at 9.61% CAGR over 2026-2031. Robust LEO-broadband constellation roll-outs, a decisive pivot toward resilient Department of Defense (DoD) space architectures, and accelerating adoption of AI-enabled autonomous control platforms collectively underpin growth momentum. Operators prioritize software-defined designs, driving strong demand for modular, radiation-hardened hardware that can be re-tasked in orbit. At the same time, localization strategies spurred by export-control regulations favor North American suppliers. Heightened cybersecurity standards, reaction-wheel reliability challenges, and the rising cost of radiation-hardened components temper the outlook but also create niches for innovators emphasizing secure, hybrid propulsion-attitude solutions. New launch providers shortening cycle times further stimulate satellite replenishment rates and sustain volume demand for agile control subsystems.
Key Report Takeaways
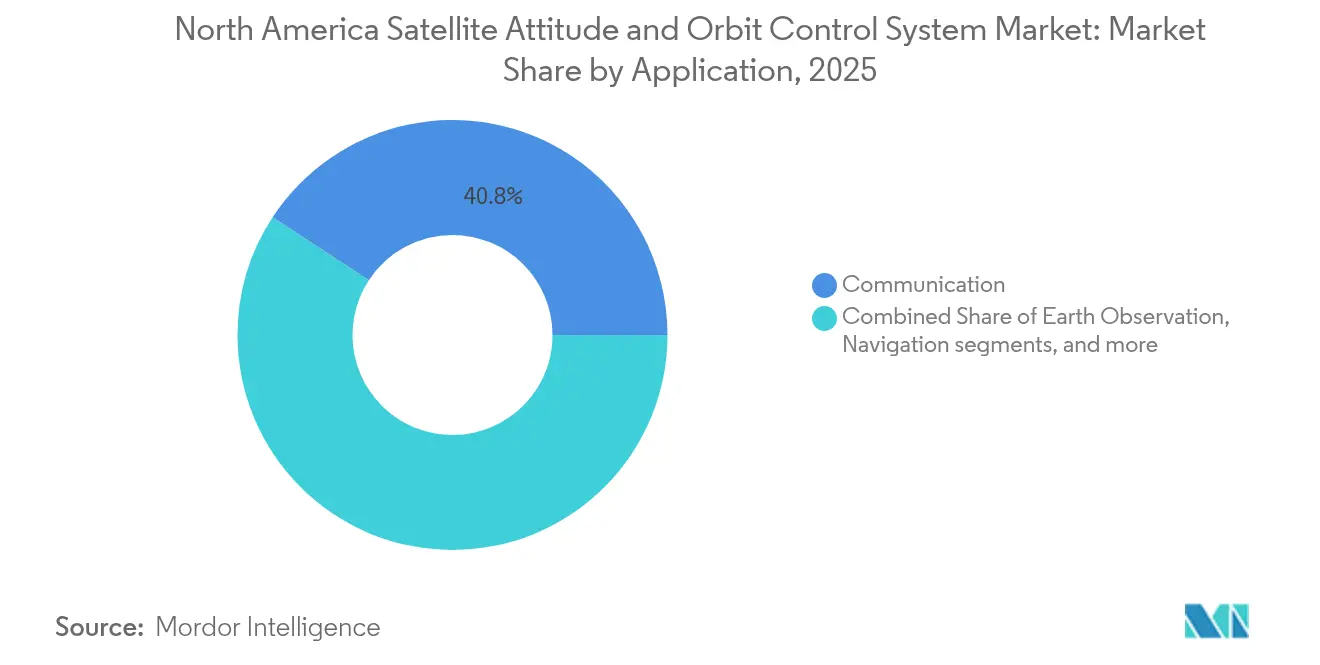
- By application, communication held 40.78% of the North America satellite AOCS market share in 2025; Earth observation is on course for a 10.39% CAGR through 2031.
- By satellite mass, the 100 to 500 kg class led with a 44.10% share of the North American satellite AOCS market size in 2025, while 10 to 100 kg platforms are set to expand at a 10.54% CAGR by 2031.
- By orbit, LEO had a 44.89% share in 2025; MEO is projected to grow fastest, at a 10.62% CAGR through 2031.
- By end user, commercial operators commanded a 50.98% share in 2025; military and government demand is forecasted to rise at a 10.24% CAGR to 2031.
- The United States accounted for 89.65% of the regional revenue in 2025 and is expected to grow at a CAGR of 9.86% through 2031.
Note: Market size and forecast figures in this report are generated using Mordor Intelligence’s proprietary estimation framework, updated with the latest available data and insights as of 2026.
North America Satellite Attitude And Orbit Control System Market Trends and Insights
Drivers Impact Analysis*
| Driver | (~)% Impact on CAGR Forecast | Geographic Relevance | Impact Timeline |
|---|---|---|---|
| Surge in LEO-broadband constellation launches | +2.1% | North America, spillover to global markets | Medium term (2-4 years) |
| Growing DoD demand for resilient, agile AOCS | +1.8% | United States, Canadian defense cooperation | Long term (≥ 4 years) |
| Miniaturized, COTS-based AOCS for CubeSats | +1.5% | North America, expanding to allied markets | Short term (≤ 2 years) |
| AI-enabled autonomous attitude algorithms | +1.2% | United States and Canada technology hubs | Medium term (2-4 years) |
| Rapid-response launch services shortening lead-times | +0.9% | United States launch corridors, Mexico emerging | Short term (≤ 2 years) |
| On-orbit servicing requirements for life extension | +0.8% | United States and Canada space programs | Long term (≥ 4 years) |
| Source: Mordor Intelligence | |||


Surge in LEO-broadband Constellation Launches
Mega-constellations such as Starlink, which surpassed 5,000 satellites in orbit, and Project Kuiper, licensed for 3,236 units, redefine procurement economics for the North America satellite AOCS market.[1]SpaceX, “Starlink Mission Updates,” spacex.com Unit costs for basic attitude packages have fallen below USD 50,000 owing to COTS component use and standardized interfaces that favor high-volume builds. Operators mandate autonomous collision-avoidance logic capable of executing thousands of maneuvers annually, shifting design priorities from 15-year life to rapid field replacement. Demand therefore centers on lightweight reaction wheels, compact cold-gas thrusters, and machine-learning guidance software able to function with minimal ground contact.
Growing DoD Demand for Resilient, Agile AOCS
The Space Development Agency’s Transport Layer and the US Space Force’s Resilient GPS initiatives require satellites that can reposition quickly and maintain mesh-network integrity under contested conditions. Specifications emphasize higher delta-V budgets, encrypted command links, and anti-jamming margins, steering procurement toward domestic vendors with ITAR-compliant supply chains. These defense programs underwrite premium pricing for radiation-hardened sensors and flight computers, expanding the total accessible value for qualified suppliers despite competitive cost pressure from commercial customers.
Miniaturized, COTS-based AOCS for CubeSats
The North American market for miniaturized, Commercial Off-The-Shelf (COTS) AOCS in CubeSats is expanding due to increased commercial, defense, and academic demand. These systems enable low-cost, rapid deployment of small satellite missions. CubeSat proliferation across universities, startups, and government labs accelerates the uptake of sub-USD 25,000 attitude control packages delivering sub-0.1-degree pointing. Reaction wheels under 50 mm diameter, magnetic torquers, and avionics-on-chip designs yield mass-production economies, expanding addressable volume for small-sat constellations and the broader North America satellite AOCS market. COTS components reduce development time and costs while allowing flexible mission design and technology updates. Improvements in miniaturized sensors, reaction wheels, and star trackers support the market growth. The increasing focus on Earth observation, communication, and scientific CubeSat constellations drives AOCS development. Government space commercialization initiatives and university programs further contribute to market expansion.
AI-enabled Autonomous Attitude Algorithms
The demand for AI-enabled autonomous attitude algorithms stems from the need for enhanced autonomy, precision, and reliability in satellite operations. In North America, complex missions and restricted ground communication windows necessitate onboard decision-making capabilities using machine learning. Recent flight heritage demonstrates Kalman-filter variants leveraging onboard AI to maintain attitude in GPS-denied zones, mitigating spoofing threats critical to defense operations.[2]IEEE Staff, “AI-Enhanced Kalman Filters for Attitude Estimation,” ieeexplore.ieee.org Predictive maintenance algorithms detect reaction-wheel bearing wear, extending service life and cutting insurance costs. Edge processing on radiation-tolerant FPGAs supports real-time maneuvering without ground latency, a prerequisite for deep-space and congested-orbit missions. AI algorithms improve real-time fault detection, adaptive control, and attitude optimization, minimizing ground station dependency and enhancing operational efficiency. The growth in constellation management, deep-space missions, and defense applications drives the implementation of AI-based AOCS solutions to achieve resilience, adaptability, and intelligent mission planning.
Restraints Impact Analysis*
| Restraint | (~)% Impact on CAGR Forecast | Geographic Relevance | Impact Timeline |
|---|---|---|---|
| High qualification and radiation-hardening costs | −1.4% | North America, particularly defense programs | Medium term (2-4 years) |
| Reaction-wheel reliability concerns/in-orbit failures | −1.1% | Global, with North American mission impacts | Short term (≤ 2 years) |
| Supply-chain exposure to ITAR/export-control rules | −0.8% | United States and allied nations | Long term (≥ 4 years) |
| Emerging cybersecurity mandates for flight software | −0.6% | North America, expanding globally | Medium term (2-4 years) |
| Source: Mordor Intelligence | |||
High Qualification and Radiation-hardening Costs
The high costs of qualification and radiation hardening constrain the North American AOCS market, especially for miniaturized and Commercial Off-The-Shelf (COTS) based systems. Space environments require components to meet strict radiation tolerance, thermal stability, and reliability standards, which increase testing and certification expenses. Achieving space-grade assurance multiplies component cost by 10–50× versus terrestrial equivalents, with reaction-wheel assemblies priced up to USD 500,000 and radiation testing queues stretching to 12 months.[3]NASA, “Hubble Space Telescope Servicing History,” nasa.govThese expenses delay time-to-market for disruptive entrants and constrain R&D budgets, particularly for smaller firms attempting to penetrate defense supply chains with novel parts. These requirements reduce the cost benefits of COTS hardware, restricting its use in long-duration or deep-space missions. Budget constraints and extended development cycles at smaller companies and research institutions impede innovation and market growth for advanced AOCS solutions.
Reaction-wheel Reliability Concerns/In-orbit Failures
Reliability issues and in-orbit failures of reaction wheels constrain the North American AOCS market growth. While these components are essential for precise attitude control, they frequently experience mechanical wear, bearing degradation, and electrical malfunctions during extended missions. Historical failures on platforms like Kepler and Hubble illustrate mission-critical vulnerabilities that raise insurer scrutiny and force redundancy-heavy designs. Bearing out-gassing, lubricant breakdown, and mechanical wear drive interest in magnetic torquers and hybrid chemical-propulsion fine-pointing, though performance parity remains mission-dependent. These failures can compromise pointing accuracy or cause complete mission failure, particularly in satellites without backup control systems. The requirements for improved durability, fault-tolerant designs, and predictive maintenance increase development complexity and costs, limiting their adoption in CubeSats and small satellite platforms.
*Our forecasts treat driver/restraint impacts as directional, not additive. The impact forecasts reflect baseline growth, mix effects, and variable interactions.
Segment Analysis
By Application: Communication Drives Volume, Earth Observation Accelerates
Communication payloads dominated revenue with a 40.78% North America satellite AOCS market share in 2025, a position cemented by thousands of broadband satellites requiring identical, highly replaceable control units. Meanwhile, Earth observation posted a 10.39% CAGR forecast, reflecting a surge in environmental monitoring, precision agriculture, and defense imaging contracts. Navigation programs such as the Resilient GPS effort inject specialized demand for anti-jamming pointing solutions, whereas space-science and technology-demonstration flights favor bespoke designs with superior precision.
Overall, communication’s scale advantage underwrites cost-reduction roadmaps, yet Earth observation’s premium on pointing accuracy sustains higher margins. The communication segment benefits from a procurement model that values commodity pricing and rapid turn-arounds, pushing suppliers to fine-tune assembly lines for a 100-unit monthly cadence. By contrast, Earth observation operators justify greater per-unit spend, incorporating star-tracker redundancy and autonomous formation-flying algorithms. Regulatory spectrum shifts, including the FCC’s 17.3–17.8 GHz allocation, intensify pointing accuracy requirements, reinforcing Earth observation as the technology catalyst for advanced sensor fusion in AOCS units.


By Satellite Mass: Mid-Range Dominance, Small Satellite Acceleration
Satellites in the 100 to 500 kg bracket retained 44.10% of the North America satellite AOCS market size in 2025, balancing payload capacity with manageable launch cost. However, the 10 to 100 kg class is forecast to register a 10.54% CAGR as CubeSat constellations transition from research to revenue operations. Units under 10 kg remain mostly academic but pioneer ultra-compact torquers and micro-cold-gas thrusters that scale upward after validation. Conversely, spacecraft exceeding 1,000 kg chiefly serve GEO communications and NASA science missions, driving bespoke multi-sensor control packages. Small-sat growth leverages economies of standardized bus designs, allowing firms such as Blue Canyon Technologies to market plug-and-play attitude kits that integrate reaction wheels, star trackers, and flight software on a single board. Mid-mass platforms retain strategic relevance for defense programs prioritizing survivability and payload power budgets, underscoring the dual-speed nature of demand across the North America satellite AOCS market.
By Orbit Class: LEO Leadership, MEO Momentum Building
LEO deployments captured a 44.89% share in 2025, reflecting broadband mega-constellation scale and the DoD proliferated architecture doctrine. MEO platforms, buoyed by navigation augmentation and low-latency regional broadband use-cases, are projected to expand at a 10.62% CAGR by 2031. GEO systems continue to secure long-lived broadcast missions but face strategic reevaluation as software-defined payloads and phased-array antennas improve LEO/MEO competitiveness. LEO AOCS designs focus on autonomous debris avoidance and high-rate slews necessary for laser inter-satellite links. MEO systems in harsher radiation belts require additional shielding and component derating, translating into higher bill-of-materials yet fewer launches per year. Hybrid fleets incorporating LEO and MEO nodes illustrate operator efforts to balance coverage, latency, and capex.

By End User: Commercial Scale, Government Growth
Commercial operators held 50.98% revenue in 2025, leveraging private capital and venture financing to accelerate constellation timelines. Government and military buyers, however, are projected for a 10.24% CAGR, propelled by Space Force and Canadian defense programs emphasizing secure, redundant networks. Academic institutions and non-profit consortia remain small but influential early adopters of experimental AOCS concepts, frequently partnering with industry to mature innovations before large-scale rollout. Commercial demand shapes volume manufacturing norms, pressing suppliers to price below USD 50,000 per control package in lot sizes exceeding 1,000 units. Although less frequent, government contracts carry higher margins and stringent performance thresholds, such as encrypted command auth and kinetic-threat maneuverability, sustaining a balanced portfolio for established primes and agile NewSpace firms.
Geography Analysis
The US commanded 89.65% of 2025 regional spending and is forecast for a 9.86% CAGR to 2031, supported by NASA R&D outlays, Space Force procurement, and a dense constellation of component suppliers. Policy tools such as launch tax incentives and expanded test-range capacity bolster domestic competitiveness while ITAR compliance shields defense segments from overseas encroachment. US companies also benefit from deep venture capital pools funding start-ups focused on AI-driven AOCS software and hybrid propulsion.
Canada contributes a meaningful though smaller share, leveraging its heritage in robotics and government-backed Earth-observation missions. Procurement collaborations with US programs, exemplified by Honeywell reaction wheels on MDA’s AURORA platform for Telesat’s Lightspeed, reinforce cross-border technology flows. Federal programs supporting Arctic communications and climate monitoring maintain steady demand for precision pointing solutions and fuel domestic R&D grants focused on radiation-tolerant hardware.
Mexico presently accounts for a nascent slice of aggregate investment but aspires to integrate into the North American satellite AOCS market supply chain through aerospace special-economic zones. Government incentives targeting subsystem manufacturing attract suppliers seeking cost-effective labor while remaining within USMCA trade boundaries. Indigenous mission demand is modest, centering on disaster-response imaging and rural broadband. Yet, the assembly skill base under development could position Mexico as a subcontractor for reaction-wheel or star-tracker components in the medium term.
Competitive Landscape
Traditional primes, including Honeywell International Inc., Northrop Grumman Corporation, and L3Harris Technologies, Inc., retain entrenched positions through legacy flight heritage, comprehensive qualification databases, and multiyear DoD contracts. They emphasize vertically integrated production and proprietary radiation-hardened microelectronics. NewSpace entrants such as Blue Canyon Technologies and Impulse Space counter with modular, COTS-centric offerings, carving share in commercial constellations by slashing lead times from 18 months to under 6 months and cutting per-unit cost by 50%.
Strategic differentiators now hinge on software-defined functionality allowing on-orbit reconfiguration. Firms delivering secure over-the-air updates and AI-driven fault-detection logs attract commercial and government clients. Cyber-hardened flight software adhering to emerging zero-trust standards represents a lucrative adjacency, rewarding suppliers investing in DevSecOps pipelines. M&A activity targets niche capability integration, particularly in edge computing and hybrid thruster-attitude assemblies.
Reaction-wheel reliability issues have catalyzed partnerships between propulsion start-ups and control-system vendors to co-develop combined-function actuators, hedging against single-point mechanical failures. As component-level commoditization intensifies, customer stickiness increasingly rests on analytics portals, operational uptime guarantees, and seamless constellation management dashboards.
North America Satellite Attitude And Orbit Control System Industry Leaders
Honeywell International Inc.
Northrop Grumman Corporation
L3Harris Technologies, Inc.
The Boeing Company
Blue Canyon Technologies LLC (RTX Corporation)
- *Disclaimer: Major Players sorted in no particular order


Recent Industry Developments
- September 2025: The US Space Force awarded early design contracts to Astranis, Axient, L3Harris, and Sierra Space under the Resilient GPS LEAP segment
- July 2025: NASA’s Space Technology Mission Directorate released a “Standing Announcement of Collaboration Opportunity (ACO)” that will remain open for five years and enable appendices every 6-12 months to address evolving space-tech needs, encouraging industry/academic participation in advanced space subsystems (including control/navigation) in North America.
- December 2024: Honeywell International Inc. selected by MDA Space Ltd. to provide Reaction Wheel Assemblies, 3-Axis Space Rate Sensors, and Magnetometer Units for the Aurora line of satellites supporting the Telesat Corporation Lightspeed LEO constellation.


North America Satellite Attitude And Orbit Control System Market Report Scope
| Communication |
| Earth Observation |
| Navigation |
| Space Observation |
| Others |
| Below 10 kg |
| 10 to 100 kg |
| 100 to 500 kg |
| 500 to 1000 kg |
| Above 1000 kg |
| Geostationary Earth Orbit (GEO) |
| Low Earth Orbit (LEO) |
| Medium Earth Orbit (MEO) |
| Commercial |
| Military and Government |
| Other |
| United States |
| Canada |
| Mexico |
| By Application | Communication |
| Earth Observation | |
| Navigation | |
| Space Observation | |
| Others | |
| By Satellite Mass | Below 10 kg |
| 10 to 100 kg | |
| 100 to 500 kg | |
| 500 to 1000 kg | |
| Above 1000 kg | |
| By Orbit Class | Geostationary Earth Orbit (GEO) |
| Low Earth Orbit (LEO) | |
| Medium Earth Orbit (MEO) | |
| By End User | Commercial |
| Military and Government | |
| Other | |
| By Geography | United States |
| Canada | |
| Mexico |


Market Definition
- Application - Various applications or purposes of the satellites are classified into communication, earth observation, space observation, navigation, and others. The purposes listed are those self-reported by the satellite’s operator.
- End User - The primary users or end users of the satellite is described as civil (academic, amateur), commercial, government (meteorological, scientific, etc.), military. Satellites can be multi-use, for both commercial and military applications.
- Launch Vehicle MTOW - The launch vehicle MTOW (maximum take-off weight) means the maximum weight of the launch vehicle during take-off, including the weight of payload, equipment and fuel.
- Orbit Class - The satellite orbits are divided into three broad classes namely GEO, LEO, and MEO. Satellites in elliptical orbits have apogees and perigees that differ significantly from each other and categorized satellite orbits with eccentricity 0.14 and higher as elliptical.
- Propulsion tech - Under this segment, different types of satellite propulsion systems have been classified as electric, liquid-fuel and gas-based propulsion systems.
- Satellite Mass - Under this segment, different types of satellite propulsion systems have been classified as electric, liquid-fuel and gas-based propulsion systems.
- Satellite Subsystem - All the components and subsystems which includes propellants, buses, solar panels, other hardware of satellites are included under this segment.
| Keyword | Definition |
|---|---|
| Attitude Control | The orientation of the satellite relative to the Earth and the sun. |
| INTELSAT | The International Telecommunications Satellite Organization operates a network of satellites for international transmission. |
| Geostationary Earth Orbit (GEO) | Geostationary satellites in Earth orbit 35,786 km (22,282 mi) above the equator in the same direction and at the same speed as the earth rotates on its axis, making them appear fixed in the sky. |
| Low Earth Orbit (LEO) | Low Earth Orbit satellites orbit from 160-2000km above the earth, take approximately 1.5 hours for a full orbit and only cover a portion of the earth’s surface. |
| Medium Earth Orbit (MEO) | MEO satellites are located above LEO and below GEO satellites and typically travel in an elliptical orbit over the North and South Pole or in an equatorial orbit. |
| Very Small Aperture Terminal (VSAT) | Very Small Aperture Terminal is an antenna that is typically less than 3 meters in diameter |
| CubeSat | CubeSat is a class of miniature satellites based on a form factor consisting of 10 cm cubes. CubeSats weigh no more than 2 kg per unit and typically use commercially available components for their construction and electronics. |
| Small Satellite Launch Vehicles (SSLVs) | Small Satellite Launch Vehicle (SSLV) is a three-stage Launch Vehicle configured with three Solid Propulsion Stages and a liquid propulsion-based Velocity Trimming Module (VTM) as a terminal stage |
| Space Mining | Asteroid mining is the hypothesis of extracting material from asteroids and other asteroids, including near-Earth objects. |
| Nano Satellites | Nanosatellites are loosely defined as any satellite weighing less than 10 kilograms. |
| Automatic Identification System (AIS) | Automatic identification system (AIS) is an automatic tracking system used to identify and locate ships by exchanging electronic data with other nearby ships, AIS base stations, and satellites. Satellite AIS (S-AIS) is the term used to describe when a satellite is used to detect AIS signatures. |
| Reusable launch vehicles (RLVs) | Reusable launch vehicle (RLV) means a launch vehicle that is designed to return to Earth substantially intact and therefore may be launched more than one time or that contains vehicle stages that may be recovered by a launch operator for future use in the operation of a substantially similar launch vehicle. |
| Apogee | The point in an elliptical satellite orbit which is farthest from the surface of the earth. Geosynchronous satellites which maintain circular orbits around the earth are first launched into highly elliptical orbits with apogees of 22,237 miles. |


Research Methodology
Mordor Intelligence follows a four-step methodology in all our reports.
- Step-1: Identify Key Variables: In order to build a robust forecasting methodology, the variables and factors identified in Step-1 are tested against available historical market numbers. Through an iterative process, the variables required for market forecast are set and the model is built on the basis of these variables.
- Step-2: Build a Market Model: Market-size estimations for the historical and forecast years have been provided in revenue and volume terms. For sales conversion to volume, the average selling price (ASP) is kept constant throughout the forecast period for each country, and inflation is not a part of the pricing.
- Step-3: Validate and Finalize: In this important step, all market numbers, variables and analyst calls are validated through an extensive network of primary research experts from the market studied. The respondents are selected across levels and functions to generate a holistic picture of the market studied.
- Step-4: Research Outputs: Syndicated Reports, Custom Consulting Assignments, Databases & Subscription Platforms.


