Market Overview
| Study Period | 2020 - 2031 |
|---|---|
| Forecast Data Period | 2026 - 2031 |
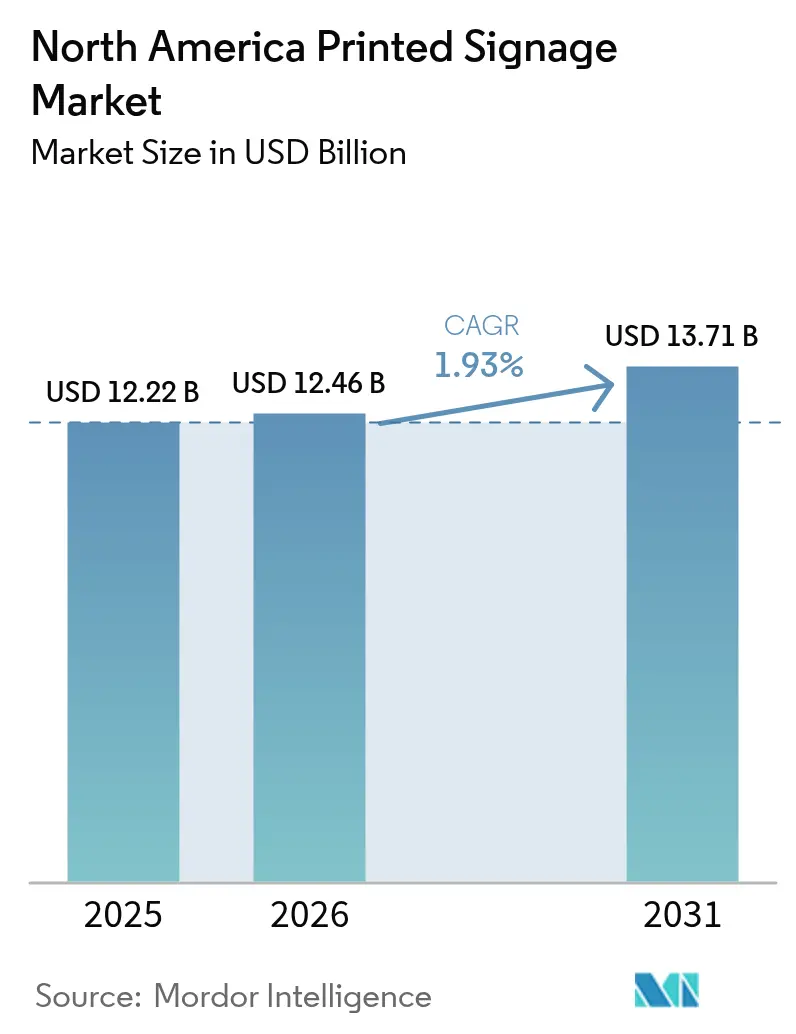
| Base Year Market Size (2025) | USD 12.22 Billion |
| Market Size (2026) | USD 12.46 Billion |
| Market Size (2031) | USD 13.71 Billion |
| Growth Rate (2026 - 2031) | 1.93% CAGR |
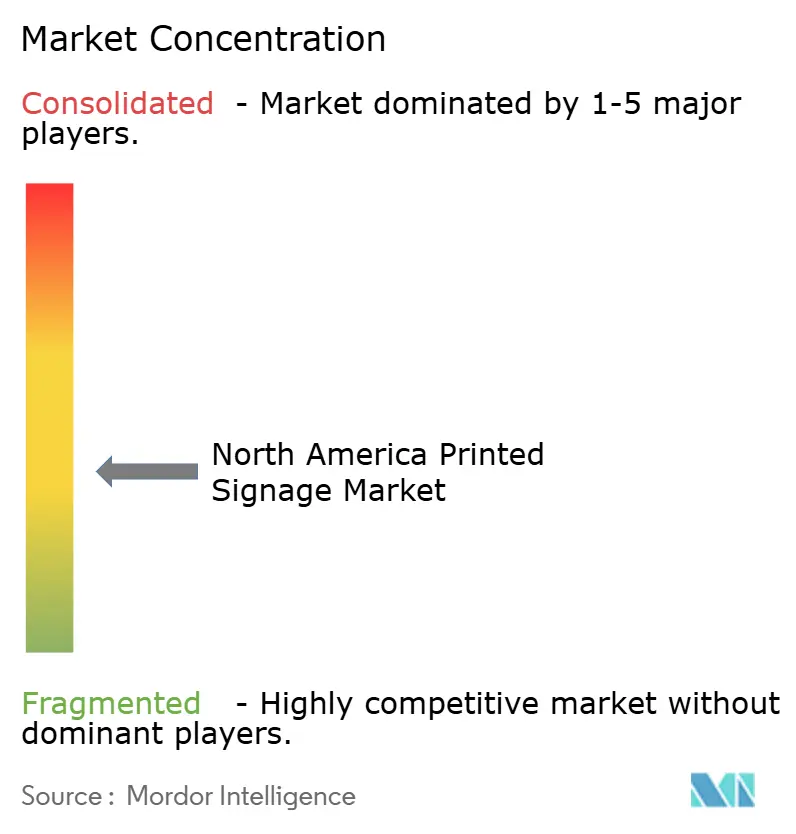
| Market Concentration | Medium |
Major Players *Disclaimer: Major Players sorted in no particular order Image © Mordor Intelligence. Reuse requires attribution under CC BY 4.0. | |
North America Printed Signage Market Analysis by Mordor Intelligence
The North America printed signage market size is projected to expand from USD 12.22 billion in 2025 and USD 12.46 billion in 2026 to USD 13.71 billion by 2031, registering a 1.93% CAGR between 2026 to 2031. Retailers continue to rely on cost-effective, short-run graphics that blend QR codes with omnichannel campaigns, even as out-of-home media owners convert premium static inventory to digital. PVC and plastic composites dominate outdoor jobs because of durability, while fabric substrates gain traction as brands pivot to recyclable, flame-retardant soft signage. UV-LED inkjet systems lower energy use by about 70% and comply with tightened VOC limits, prompting widespread hardware upgrades. Competitive pressure intensifies as franchise networks, independent printshops, and vertically integrated substrate suppliers battle on turnaround speed, substrate breadth, and sustainable offerings.
Key Report Takeaways
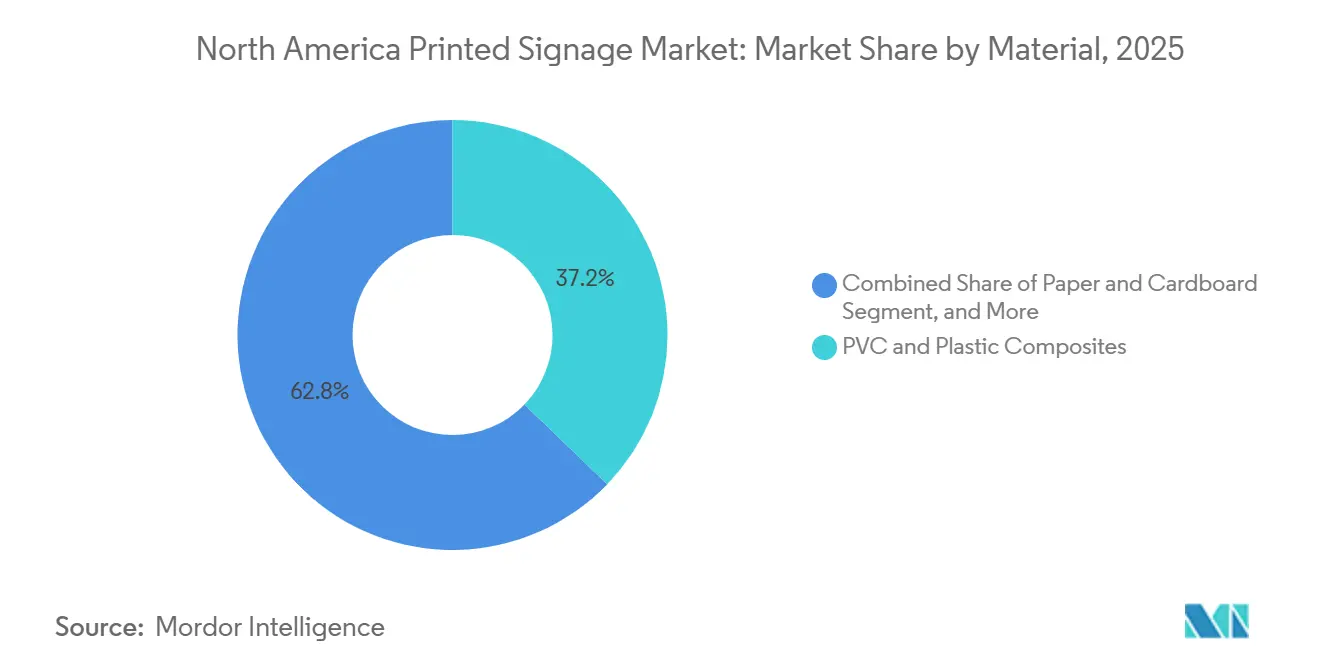
- By material, PVC and plastic composites led the North America printed signage market with 37.21% share in 2025, while fabric and textile substrates are projected to grow at a 2.91% CAGR through 2031.
- By application type, indoor signage accounted for 62.98% share of the printed signage market size in 2025; outdoor signage is advancing at a 2.31% CAGR through 2031.
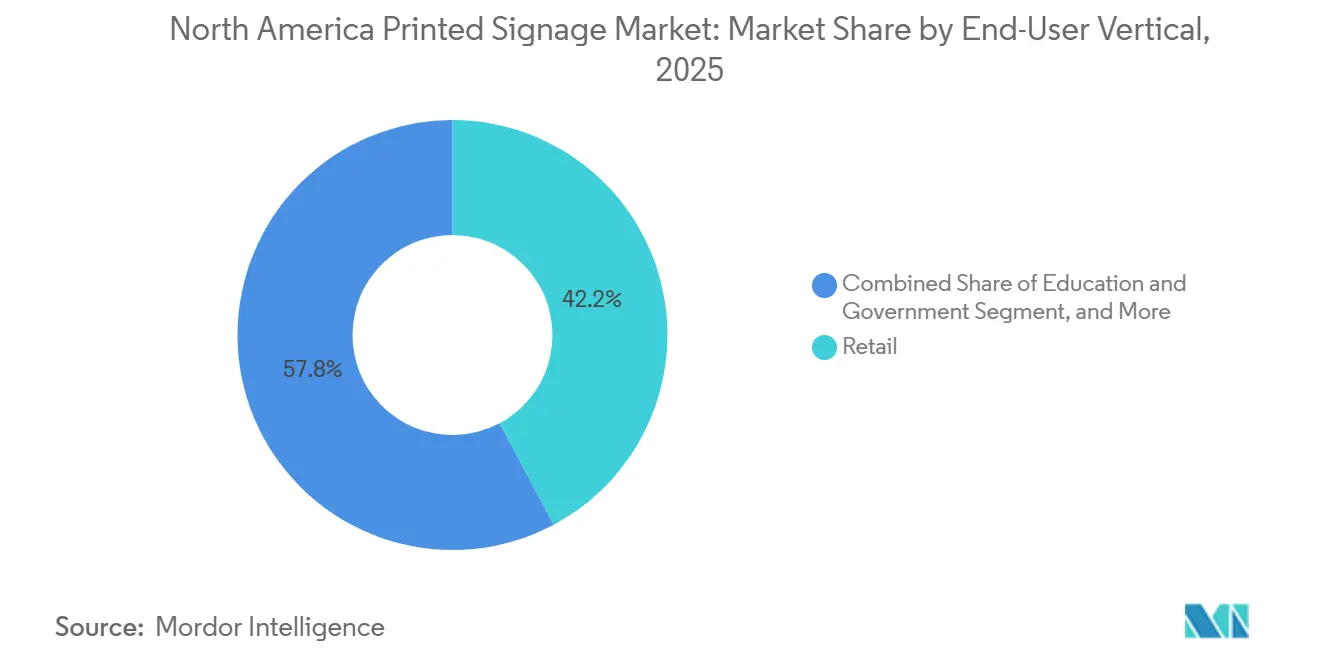
- By end-user vertical, retail held 42.19% of the North America printed signage market share in 2025, whereas sports and leisure is projected to expand at a 3.32% CAGR through 2031.
- By printing technology, inkjet captured 53.56% share in 2025 and is forecast to grow at a 2.71% CAGR through 2031.
- By country, the United States commanded 71.32% share in 2025 and Mexico is forecast to record the fastest growth at a 2.54% CAGR over 2026-2031.
Note: Market size and forecast figures in this report are generated using Mordor Intelligence’s proprietary estimation framework, updated with the latest available data and insights as of 2026.
North America Printed Signage Market Trends and Insights
Drivers Impact Analysis*
| Driver | (~) % Impact on CAGR Forecast | Geographic Relevance | Impact Timeline |
|---|---|---|---|
| Cost Effectiveness of Printed Signage | +0.6% | United States, Canada, Mexico | Medium term (2-4 years) |
| High Demand from Retail Industry | +0.5% | United States, Canada | Short term (≤ 2 years) |
| Flexibility and Customization of Large-Format Printing | +0.4% | United States, Canada | Medium term (2-4 years) |
| Resurgence of Out-of-Home Advertising Post-Pandemic | +0.3% | United States, Canada | Short term (≤ 2 years) |
| Retailers' Push for QR-Linked Phygital Campaigns | +0.2% | United States, Canada | Short term (≤ 2 years) |
| Short-Run Sustainable Packaging Print Spill-Over | +0.1% | United States, Canada | Long term (≥ 4 years) |
| Source: Mordor Intelligence | |||
Cost Effectiveness of Printed Signage
Printed graphics avoid software fees and network costs, making them the preferred medium for campaigns lasting four to twelve weeks. A backlit fabric kit priced from USD 98 to USD 1,746 carries no recurring expense, and LED backlighting consumes roughly 70% less power than fluorescent systems, cutting energy bills for 24-hour retailers. Short-run digital presses now profitably produce 50-500 units, enabling regional tests without large capital outlays. Static formats still captured 65.6% of North American out-of-home spend in 2024, underscoring advertiser confidence in printed media for broad brand awareness. The resulting total-cost-of-ownership advantage sustains demand even as digital screens proliferate.
High Demand from the Retail Industry
Brick-and-mortar outlets generated 80% of U.S. retail transactions in 2025, underpinning the printed signage market.[1]National Retail Federation, “Consumer View: In-Store Shopping Trends,” nrf.com Point-of-purchase displays placed within three to five touchpoints of the shelf lift conversions measurably, prompting retailers to order graphics that embed QR codes linking to loyalty apps and mobile checkout. Retail media networks growing about 20% annually allocate part of their budgets to printed assets that reinforce digital impressions in-store. Remodel programs stimulate fresh requirements for wayfinding, wall murals, and category headers, while shoppers value the permanence of static graphics alongside dynamic screens. These trends position retail as the anchor vertical for continued volume.
Flexibility and Customization of Large-Format Printing
UV-LED inkjet platforms print on aluminum composite, corrugated plastic, and foam board without pre-coating or trimming, and deliver within 48 hours.[2]HP Inc., “LED Backlit Fabric Display Cost Guide,” hp.com Water-based UV chemistries from Fujifilm eliminate the ventilation systems required by solvent setups, lowering facility costs and easing compliance with air-quality rules. Dye-sublimated fabrics offer wrinkle-resistant, flame-retardant graphics that meet NFPA 701 standards and comply with trade show and corporate safety codes. Variable-data capability enables store-specific pricing or localized messages within a single run, minimizing inventory waste. Combined, these technical gains feed sustained growth in the printed signage market.
Resurgence of Out-of-Home Advertising Post-Pandemic
North American out-of-home revenue climbed 4.5% year over year in Q3 2025 as commuter volumes normalized. Municipalities still issue tenders for printed bus-shelter posters and vehicle wraps in neighborhoods that restrict illuminated screens. Lamar Advertising operated more than 362,000 displays in Q3 2025, retaining printed inventory in secondary markets where digital economics are weaker. Advertisers favor static formats for long-duration brand campaigns that suffer creative fatigue on fast-rotating digital loops. This rebound adds incremental opportunities for the printed signage market across transportation and local outdoor venues.
Restraints Impact Analysis*
| Restraint | (~) % Impact on CAGR Forecast | Geographic Relevance | Impact Timeline |
|---|---|---|---|
| Rising Adoption of Digital Signage | -0.5% | United States, Canada | Short term (≤ 2 years) |
| Supply Chain Volatility in Specialty Substrates | -0.3% | United States, Canada, Mexico | Medium term (2-4 years) |
| Rising Environmental Regulations on VOC Emissions | -0.2% | United States, Canada | Medium term (2-4 years) |
| Skilled Labor Gap in Wide-Format Printshops | -0.1% | United States, Canada | Long term (≥ 4 years) |
| Source: Mordor Intelligence | |||
Rising Adoption of Digital Signage
Digital formats captured 34.4% of 2024 out-of-home spend, supported by programmatic platforms that swap creative hourly and verify impressions via mobile pings. Lamar Advertising reported digital billboards earning five times the revenue of static units in Q3 2025, accelerating conversions in prime corridors.[3]Printing United Alliance, “State of the Industry Report 2025,” printing.org Retailers deploy in-store screens that personalize offers by weather or inventory in real time, eroding the value of premium printed placements. The margin gap and content agility continue to divert advertising dollars away from traditional graphics in high-traffic zones.
Supply Chain Volatility in Specialty Substrates
PVC resin prices spiked in 2024 after Gulf Coast disruptions, while coated fabric lead times lengthened as mills prioritized apparel over print media [4]Lamar Advertising Company, “Q3 2025 Earnings Release,” lamar.com This volatility forces print shops to raise inventory levels, tying up working capital and compressing margins. Contract bids for transit agencies and national retailers become riskier when substrate costs fluctuate, nudging buyers toward digital alternatives with predictable hardware depreciation. Until supply stability returns, material uncertainty will weigh on the printed signage market.
*Our forecasts treat driver/restraint impacts as directional, not additive. The impact forecasts reflect baseline growth, mix effects, and variable interactions.
Segment Analysis
By Material: Durability Drives PVC Dominance
PVC and plastic composites commanded 37.21% of the North America printed signage market share in 2025. The substrates resist UV radiation, moisture, and temperature swings, making them the default for billboards, building wraps, and transit shelters. Fabric media, though smaller today, is projected to outpace the overall printed signage market at a 2.91% CAGR through 2031, buoyed by recycled polyester and flame-retardant nylon that meet NFPA 701 standards. Paperboard retains indoor relevance for shelf talkers and header cards where recyclability trumps longevity. Metal, wood, and rigid boards fill premium niches such as architectural letters or rustic restaurant menus. Vendor innovation is evident in Fujifilm’s Aquafuze water-based UV inks, which print on PVC, fabric, and rigid panels without solvent emissions. Fisher Textiles doubled its GREENGUARD-certified dye-sublimation range, helping corporate buyers meet indoor air-quality mandates.
Brands increasingly specify PVC-free films and bio-based laminates to reduce greenhouse gas footprints, pressuring suppliers to develop closed-loop options. HP Latex technology, which cures water-based ink with heat rather than UV light, appeals to urban print shops seeking ozone-free production. As sustainability guidelines tighten, material choice will remain a decisive competitive lever across the printed signage industry.


By Product: Banners Lead, Backlit Displays Accelerate
Banners, flags, and backdrops accounted for 31.12% of the North America printed signage market size in 2025. Versatility across indoor promotions, outdoor events, and trade shows secures their role as the volume cornerstone. Backlit displays are the fastest-growing product, set to grow at a 3.28% CAGR through 2031, as LED illumination slashes energy use by nearly 70% and enables 24-hour visibility in storefront windows and transit shelters. Point-of-purchase units remain vital for packaged-goods marketers seeking shelf-edge influence, while printed billboards remain relevant along rural highways where digital infrastructure is uneconomical. Hybrid offerings now let clients refresh messaging by adding digitally printed overlays or QR panels to a static base, marrying speed with cost efficiency.
Corporate interior graphics benefit from UV-LED presses that image directly onto foam board and aluminum composite in one pass, eliminating lamination steps. Transit agencies continue to procure weather-resistant posters for bus shelters and vehicle wraps that deliver long dwell-time branding. This diverse product mix underpins stable revenue for participants across the printed signage market.
By Application Type: Indoor Signage Anchors Demand
Indoor installations captured 62.98% share of printed signage market size in 2025, reflecting retailers’ heavy investment in point-of-purchase displays, wayfinding, wall murals, and category tags. Multiple substrate options and the ability to deliver high-resolution finishes help brands differentiate in competitive aisles. Outdoor printed signage is projected to grow at a 2.31% CAGR through 2031 as sports venues, transit systems, and restaurants require rugged graphics for sponsorships and directional messaging.
Stricter VOC caps introduced by the U.S. Environmental Protection Agency in 2025, set at 350 g L⁻¹ for screen printing and 600 g L⁻¹ for digital coatings, forced widespread adoption of UV-LED and water-based inks Facilities that invested early now leverage compliance as a selling point. Zoning codes that restrict illuminated signs in residential districts also preserve a role for static outdoor graphics, sustaining volume even amid digital encroachment.
By End-User Vertical: Retail Anchors, Sports and Leisure Surges
Retail environments accounted for 42.19% of the North America printed signage market in 2025, buoyed by the fact that 80% of U.S. transactions still occurred in physical stores. Chains rely on shelf talkers, window clings, and end-cap headers that weave QR codes into loyalty programs, mobile checkout, and product-review pages, creating a measurable lift in conversion without the network fees tied to digital screens. Remodel cycles add steady demand for wall murals and directional graphics, while omnichannel retail media networks reserve budget slices for static assets that extend “phygital” storytelling from phone to shelf. Banking, insurance, and government offices maintain a baseline flow of branch décor, ATM surrounds, and compliance notices that require high-quality substrates and precise color standards.
Sports and leisure is the fastest-growing vertical, forecast to post a 3.32% CAGR through 2031 as stadium renovations, esports arenas, and collegiate venues specify NFPA 701-certified fabric backdrops, backlit sponsor logos, and dimensional lettering. Transportation fleets and transit authorities also invest in durable wraps and shelter posters to reach commuters daily, while quick-service restaurants refresh roadside banners and drive-thru boards on seasonal schedules. Entertainment studios and streaming services continue ordering theatrical one-sheets, experiential pop-up graphics, and red-carpet step-and-repeat walls to sustain pre-launch buzz. This balanced mix of cost-sensitive retail work and premium venue installations gives printshops diversified revenue streams, insulating the printed signage market from sudden shifts in any single sector.
By Printing Technology: Inkjet Consolidates Leadership
Inkjet systems captured 53.56% of the North America printed signage market share in 2025 and are projected to expand at a 2.71% CAGR through 2031, widening the gap over screen, toner, and offset alternatives. UV-LED units cure instantly, cut energy use by roughly 70%, and print directly on rigid PVC, aluminum composite, and corrugated plastic without pre-coating, reducing turnaround from days to hours and aligning with the latest VOC caps that took effect in 2025. White-ink layers, relief textures, and variable-data capability allow premium pricing on everything from retail shelf strips to architectural wayfinding panels, while automated roll-to-roll feeders and robotic off-loaders free operators to manage multiple presses at once. Screen printing remains the choice for very long runs that require heavy ink lay-down or specialty fluorescents, yet its labor intensity and extended setup windows make it less competitive for short-run, quick-change jobs that dominate the printed signage market.
Toner-based electrophotography has niche appeal for indoor posters and counter cards that require exact color matching across regional campaigns, but the technology’s limited media range and narrow print width limit broader adoption. Hybrid shops increasingly pair toner for small formats with UV-LED inkjet for wide graphics, streamlining job routing inside a single facility. Water-based UV chemistries, recently commercialized by several manufacturers, eliminate the ventilation systems solvent setups require and unlock mixed-use urban locations constrained by strict air-quality rules. As suppliers roll out wider, faster inkjet engines, some exceeding 300 m² hr⁻, printshops gain the throughput to compete with digital signage refresh cycles while retaining the tactile value of static graphics. These efficiency gains, paired with compliance benefits, ensure inkjet’s dominant position in the printed signage market size discussion over the forecast horizon.
Geography Analysis
The United States controlled 71.32% of regional revenue in 2025, thanks to the world’s largest concentration of retail space and 9.13 billion USD in out-of-home advertising spend that year. Federal VOC ceilings, effective January 2025, accelerated the shift to UV-LED and water-based chemistries, favoring operators with the balance sheet to upgrade presses. Franchise chains such as FASTSIGNS and Signarama leverage thousands of outlets to offer same-day service and broad substrate menus, reinforcing U.S. leadership in the printed signage market.
Canada’s print sector cut VOC output to 23 kilotons by 2023, down from 55 kilotons in 2005, after Environment and Climate Change Canada introduced flexible emissions-permit schemes and trading mechanisms. Cross-border tariff elimination under the United States-Mexico-Canada Agreement lets Canadian shops import machinery cheaply, and export finished graphics, creating a two-way flow that sustains material variety and competitive pricing. Retail and arena upgrades in major metros like Toronto and Vancouver fuel demand for indoor soft signage and arena sponsorship backdrops.
Mexico is forecast to be the fastest-growing country segment at a 2.54% CAGR through 2031. Nearshoring has spurred industrial construction, while printing machinery exports to the United States reached USD 1.085 billion in 2024 under USMCA provisions. Retail chain expansion and quick-service restaurant rollouts generate bilingual signage orders, though substrate lead times and fewer UV-LED installations temper growth. Firms able to bridge Spanish-language creative, rapid turnaround, and compliant inks stand to capture share as the printed signage market expands southward.
Competitive Landscape
The printed signage market in North America remains moderately fragmented, with the five largest participants capturing roughly half of total revenue, and no single company controlling more than one-third of the market. Franchise networks such as FASTSIGNS, Signarama, Image360, and SpeedPro leverage national branding, shared procurement, and prescribed workflows to deliver fast turnarounds for small and mid-sized businesses. National out-of-home operators, Lamar Advertising, Clear Channel Outdoor, and Outfront Media, still procure printed posters for secondary markets even as they migrate premier sites to programmatic digital screens. Vertically integrated material suppliers like Avery Dennison and 3M Company reinforce their positions by bundling graphic films, laminates, and technical support, allowing print shops to simplify sourcing and meet rising sustainability mandates. Independent regional shops hold the balance of share by offering location-specific installation services and niche capabilities such as vehicle wraps, fabric lightboxes, and architectural lettering.
Strategic activity centers on scale, technology, and sustainability. Lamar Advertising and Outfront Media continue to convert high-traffic corridors to digital boards, freeing capacity for printed jobs in rural or zoning-restricted zones and pressuring suppliers tied to legacy volume. Avery Dennison is investing in low-VOC adhesive chemistries and recycled PET face stocks, while Fisher Textiles broadened its GREENGUARD Gold certified fabric catalog to win corporate indoor projects. Franchise groups are upgrading to UV-LED inkjet presses that cut energy use by about 70% and meet the 2025 VOC caps without costly ventilation retrofits. Several operators are also piloting carbon-neutral shipping programs to secure preferred-vendor status on retailer sustainability scorecards.
Digital-first aggregators, including online portals that pool national demand and route jobs to underutilized presses, are adding pricing pressure by standardizing quotes and shortening lead times. The skilled-labor gap is prompting independent shops to adopt automated cutters, robotic off-loaders, and real-time job tracking to maintain throughput with lean crews. Competitive advantage is shifting toward providers that can pair substrate breadth with data-driven services like QR-code analytics, enabling measurable return on printed campaigns. As brands set recycled-content thresholds and carbon reduction targets, suppliers offering PVC-free films, water-based inks, and closed-loop take-back programs are gaining share. Overall, the mix of technology adoption, sustainability differentiation, and franchise scale keeps rivalry high while still leaving room for specialists that solve complex local requirements.
North America Printed Signage Industry Leaders
Avery Dennison Corporation
James Printing and Signs Inc.
Kelly Signs Inc.
FASTSIGNS International Inc.
Clear Channel Outdoor Holdings, Inc.
- *Disclaimer: Major Players sorted in no particular order

Recent Industry Developments
- January 2026: U.S. Environmental Protection Agency finalized National Emission Standards for Hazardous Air Pollutants, capping VOC content in printing coatings and accelerating UV-LED adoption.
- December 2025: Lamar Advertising posted USD 585.5 million Q3 2025 revenue, with digital boards earning five times static units, triggering faster digital rollouts.
- November 2025: Outfront Media reported USD 467.5 million Q3 2025 sales, with digital formats rising to 35.4% of revenue and plans to exit low-margin static contracts.
- October 2025: Avery Dennison’s Graphics and Reflectives segment grew at a low single-digit rate, citing tariff-driven margin compression.


North America Printed Signage Market Report Scope
The North America Printed Signage Market Report is Segmented by Material (Paper and Cardboard, PVC and Plastic Composites, Fabric and Textile, Metal Sheets and Foils, Wood and Rigid Boards), Product (Billboards, Backlit Displays, Point-of-Purchase Displays, Banners, Flags and Backdrops, Corporate Graphics, Exhibition and Trade-Show Materials, Transit and Street Furniture, Other Products), Application Type (Indoor, Outdoor), End-User Vertical (Retail, BFSI, Transportation and Logistics, Sports and Leisure, Entertainment and Media, Education and Government, Other End-User Verticals), Printing Technology (Screen Printing, Inkjet Printing, Toner-Based, Other Technologies), and Geography (United States, Canada, Mexico). Market Forecasts are Provided in Terms of Value (USD).
By Material
| Paper and Cardboard |
| PVC and Plastic Composites |
| Fabric and Textile |
| Metal Sheets and Foils |
| Wood and Rigid Boards |
By Product
| Billboards |
| Backlit Displays |
| Point-of-Purchase (POP) Displays |
| Banners, Flags and Backdrops |
| Corporate Graphics, Exhibition and Trade-Show Materials |
| Transit and Street Furniture |
| Other Products |
By Application Type
| Indoor Printed Signage |
| Outdoor Printed Signage |
By End-User Vertical
| Retail |
| BFSI |
| Transportation and Logistics |
| Sports and Leisure |
| Entertainment and Media |
| Education and Government |
| Other End-User Verticals |
By Printing Technology
| Screen Printing |
| Inkjet Printing |
| Toner-Based (Electrophotography) |
| Other Printing Technologies |
By Country
| United States |
| Canada |
| Mexico |
| By Material | Paper and Cardboard |
| PVC and Plastic Composites | |
| Fabric and Textile | |
| Metal Sheets and Foils | |
| Wood and Rigid Boards | |
| By Product | Billboards |
| Backlit Displays | |
| Point-of-Purchase (POP) Displays | |
| Banners, Flags and Backdrops | |
| Corporate Graphics, Exhibition and Trade-Show Materials | |
| Transit and Street Furniture | |
| Other Products | |
| By Application Type | Indoor Printed Signage |
| Outdoor Printed Signage | |
| By End-User Vertical | Retail |
| BFSI | |
| Transportation and Logistics | |
| Sports and Leisure | |
| Entertainment and Media | |
| Education and Government | |
| Other End-User Verticals | |
| By Printing Technology | Screen Printing |
| Inkjet Printing | |
| Toner-Based (Electrophotography) | |
| Other Printing Technologies | |
| By Country | United States |
| Canada | |
| Mexico |


Key Questions Answered in the Report
How large will North America printed signage revenue be by 2031?
It is projected to reach USD 13.71 billion, reflecting a 1.93% CAGR from 2026 to 2031.
Which substrate will grow the fastest over the next five years?
Fabric and textile media are forecast to expand at a 2.91% CAGR as brands seek recyclable, flame-retardant soft signage.
Why does retail remain the top buyer of printed graphics?
In-store shopping still accounts for 80% of transactions, and point-of-purchase displays with QR codes convert foot traffic into mobile purchases.
How are VOC regulations shaping equipment investment?
U.S. and Canadian caps on coating VOCs are pushing printshops toward UV-LED and water-based inkjet presses that eliminate solvent emissions.
What differentiates UV-LED inkjet from older screen systems?
UV-LED units cure instantly, cut energy use by about 70%, and print directly on rigid panels, enabling same-day turnaround and lower operating costs.
Which country shows the highest growth potential?
Mexico, aided by nearshoring and USMCA tariff relief, is expected to post a 2.54% CAGR through 2031 for printed signage orders.
Page last updated on:


