
North America Inspection Services Market Size and Share
Market Overview
| Study Period | 2021 - 2032 |
|---|---|
| Forecast Data Period | 2027 - 2032 |
| Base Year Market Size (2026) | USD 34.82 Billion |
| Market Size (2027) | USD 36.98 Billion |
| Market Size (2032) | USD 49.58 Billion |
| Growth Rate (2027 - 2032) | 6.04 % |
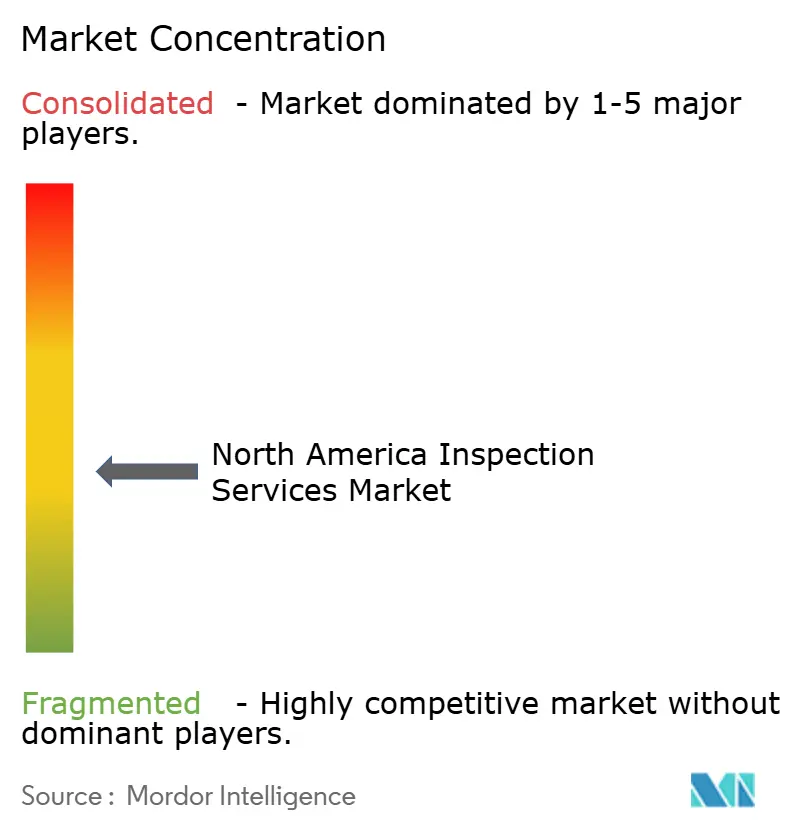
| Market Concentration | Medium |
Major Players *Disclaimer: Major Players sorted in no particular order Image © Mordor Intelligence. Reuse requires attribution under CC BY 4.0. | |
North America Inspection Services Market Analysis by Mordor Intelligence
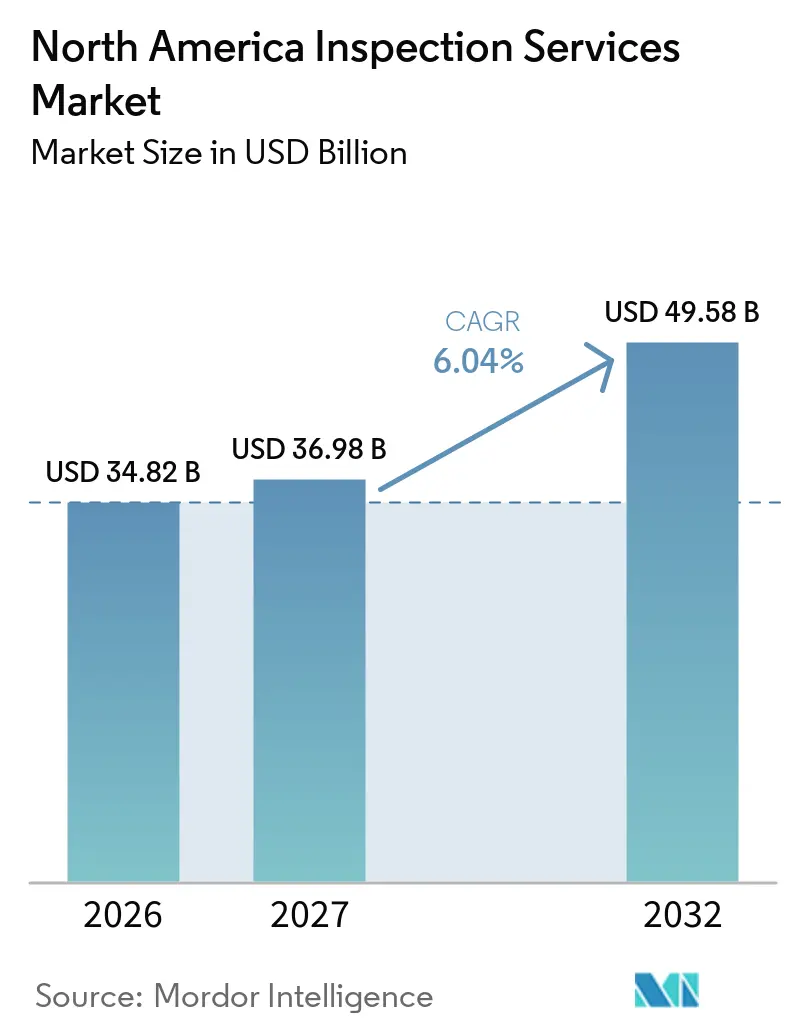
The North America Inspection Services Market size is expected to grow from USD 34.82 billion in 2026 to USD 36.98 billion in 2027 and is forecast to reach USD 49.58 billion by 2032 at 6.04% CAGR over 2027-2032.
The North America inspection services market is supported by statutory inspection requirements, renewal work across aging assets, and wider use of continuous verification tools. Mandatory work provides a steadier demand base than discretionary industrial spending, particularly in regulated energy, transportation, food, pharmaceutical, and aviation operations. The United States remains the central demand center because of its concentration of regulated facilities, pipeline networks, public infrastructure, and energy-transition projects. Canada has stable demand from resource industries and infrastructure oversight, while Mexico gains work from new manufacturing sites and supplier qualification needs. Providers are responding through acquisitions, specialized capabilities, digital reporting, and recurring compliance relationships.
Key Report Takeaways
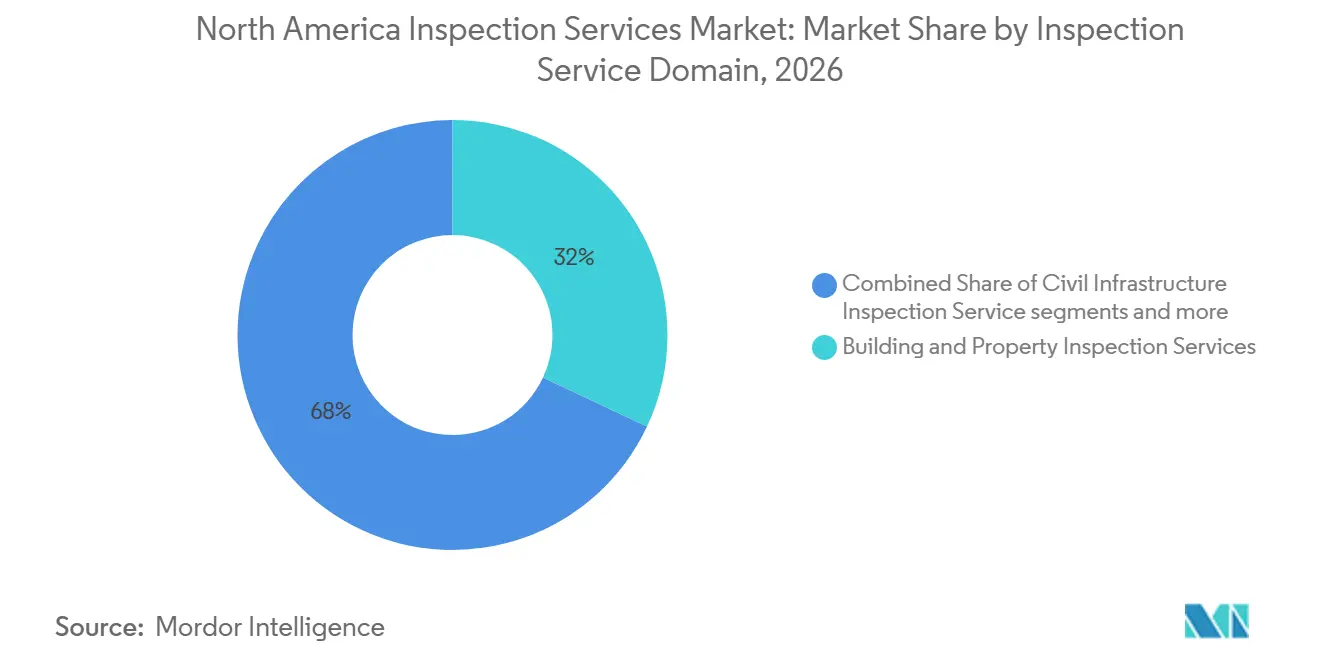
- By inspection service domain, building and property inspection services held 32% of the North America inspection services market share in 2026, while civil infrastructure inspection services recorded the highest projected CAGR at 7.1% through 2032.
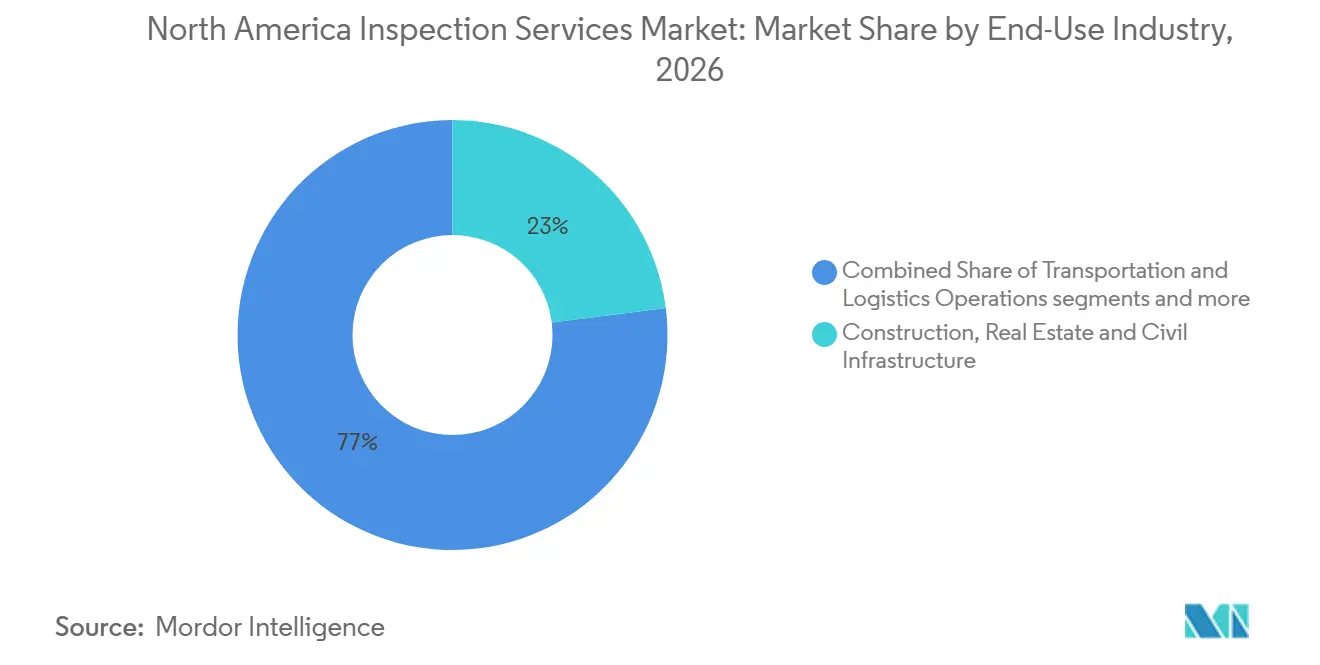
- By end-use industry, construction, real estate, and civil infrastructure accounted for 23% of the North America inspection services market size in 2026, while power generation, renewable energy, and utilities are forecast to grow at a 6.5% CAGR through 2032.
- By geography, the United States held 78% of the regional revenue in 2026, while Mexico is expected to expand at a 9% CAGR through 2032.
Note: Market size and forecast figures in this report are generated using Mordor Intelligence’s proprietary estimation framework, updated with the latest available data and insights as of January 2026.
Market Trends and Insights
Drivers Impact Analysis of North America Inspection Services Market*
| Driver | (~) % Impact on CAGR Forecast | Geographic Relevance | Impact Timeline |
|---|---|---|---|
| Stringent Regulatory and Standards Compliance | +1.5% | National, with the greatest effect in federally regulated energy, aviation, food, and pharmaceutical sectors | Long term (≥ 4 years) |
| Aging Industrial and Public Infrastructure | +1.3% | National, concentrated in the Northeast and Midwest United States, and major Canadian corridor cities. | Long term (≥ 4 years) |
| Outsourcing of Specialized Inspection Capabilities | +1% | National, with growing use in mid-market manufacturing, energy, and the USMCA corridor | Medium term (2-4 years) |
| EV, Battery, Semiconductor, and Clean-Energy Asset Complexity | +0.9% | The United States Southeast and Midwest gigafactory belt and the United States-Mexico semiconductor corridor | Medium term (2-4 years) |
| Digital Inspection, AI, Robotics, and Remote-Delivery Adoption | +0.7% | National, with early use in oil and gas, power, and data-center infrastructure | Short term (≤ 2 years) |
| Nearshoring-Driven Supplier Qualification in Mexico | +0.5% | Mexico's industrial clusters in Monterrey, Querétaro, and Guadalajara, and the United States-Mexico border corridor | Short term (≤ 2 years) |
| Source: Mordor Intelligence | |||
Stringent Regulatory and Standards Compliance
Compliance requirements create a durable demand floor for the North America inspection services market. In fiscal year 2025, OSHA conducted 30,273 inspections through programmed, complaint-driven, and fatality-related activities.[1] These programs cover hazards that include respirable silica, combustible dust, and chemical processing. PHMSA requires hazardous-liquid pipeline patrols at frequencies that can reach 26 times each year.[2] The May 2025 proposal on repair criteria and the August 2025 Periodic Standards Update II also reinforce the need for documented integrity assessments. These regulatory obligations support recurring demand for workplace safety inspections, pipeline integrity verification, equipment condition assessments, and corrective-action monitoring. Operators must maintain inspection records, demonstrate compliance with applicable standards, and address identified deficiencies, creating opportunities for providers that offer both field inspections and documentation support.[3] The need for qualified personnel and technically reliable assessment methods further favors inspection firms with specialized expertise in industrial facilities, energy infrastructure, and hazardous operating environments.
Aging Industrial and Public Infrastructure
The North America inspection services market also benefits from maintenance and rehabilitation needs across public assets. ASCE gave the United States infrastructure a C grade in 2025, its highest grade to date, but identified a USD 3.7 trillion gap between planned investment and the needs required to restore assets to good condition. The assessment retained D-range grades for nine categories, including aviation, dams, energy, and roads. Federal bridge standards require inspection of eligible publicly owned bridges, while structures in fair condition can later require preservation and rehabilitation work. The Bridge Formula Program had apportioned USD 21.2 billion through fiscal year 2025 for 12,306 projects. This spending creates demand for pre-construction assessment, conformance checks, and post-rehabilitation documentation.
Outsourcing and Cross-Border Supplier Qualification
Organizations are moving specialized inspection work to external providers when internal laboratories and certifications are costly to maintain. This supports a larger role for firms that combine testing, inspection, calibration, and forensic services. SGS completed its acquisition of Applied Technical Services in January 2026, and the acquired business is expected to contribute USD 460 million in 2026 sales. The transaction reflects client demand for a single provider across multiple compliance tasks. Manufacturers also use third-party credentials to support supplier status with automotive and aerospace original equipment manufacturers. In Mexico, new industrial clusters increase the need for supplier audits, process checks, and conformity assessment. This work gives qualified providers a path to serve cross-border supply chains as they develop.
EV, Battery, Semiconductor, and Clean-Energy Asset Complexity
New battery, semiconductor, renewable-energy, and data-center assets require more specialized inspection methods than conventional production facilities. Battery operations use methods such as computed tomography scanning, acoustic emission, and eddy-current array testing for sensitive components. Electric vehicle battery plants in the Midwest and Southeast are commissioning in-line inspection systems that can support long-term service contracts. Safety and recycling requirements add inspection points across the battery lifecycle. The North America inspection services market also gains from wind blade inspection, solar thermal imaging, and battery storage commissioning work. Remote tools, robotics, analytics, and digital reporting can help certified personnel cover more assets while maintaining evidence trails. These methods are especially relevant where workforce availability constrains field capacity.
Restraints Impact Analysis of North America Inspection Services Market*
| Restraint | (~) % Impact on CAGR Forecast | Geographic Relevance | Impact Timeline |
|---|---|---|---|
| Price Competition and Commoditization of Standardized Inspection Work | -0.8% | National, with the greatest pressure in building inspection and general manufacturing audits | Long term (≥ 4 years) |
| Shortage of Certified Inspectors and Advanced Laboratory Specialists | -0.7% | National, most acute in NDT-intensive oil and gas, nuclear, aerospace, and fast-growing locations | Long term (≥ 4 years) |
| High Cost of Advanced Inspection Equipment and Data Infrastructure | -0.5% | National, with greater pressure on small and mid-sized independent providers | Medium term (2-4 years) |
| Unclear Evidentiary Acceptance of Remote and AI-Assisted Findings | -0.4% | National, with early regulatory clarity concentrated in pharmaceutical and food applications | Short term (≤ 2 years) |
| Source: Mordor Intelligence | |||
Price Competition and Cost Pressures in Standard Work
Routine property inspections, standard NDT screening, and periodic integrity checks face persistent price competition. Entry barriers are lower in these assignments, and clients can change providers with limited disruption. Smaller operators can compete for volume by offering lower prices, even when labor costs rise. Large providers seek to protect margins by combining field work with analytics, digital reporting, and condition-monitoring subscriptions. Those bundled offerings are harder for regional firms to replicate at scale. The North America inspection services market, therefore, has differing pricing conditions between standardized work and high-complexity assignments.
Shortage of Certified Inspectors and Advanced Laboratory Specialists
The available supply of qualified personnel can limit the North America inspection services market even when asset owners require more work. The American Society for Nondestructive Testing reported that nearly 30% of certified NDT personnel are older than 55. Advanced methods such as phased-array ultrasonic testing and eddy-current array testing require multi-year certification pathways. Inspection providers also face high costs for advanced equipment, laboratory systems, and data infrastructure. Remote and AI-assisted findings may not receive consistent evidentiary acceptance across all regulated uses. Firms can respond by investing in training and tools that allow certified specialists to supervise broader teams. The pace of that investment affects how much demand can be converted into completed assignments.
*Our forecasts treat driver/restraint impacts as directional, not additive. The impact forecasts reflect baseline growth, mix effects, and variable interactions.
North America Inspection Services Market Segment Analysis
Building and property inspection services held 32% of the North America inspection services market share in 2026. The North America inspection services market has a recurring base in residential and commercial transactions where lenders require property-condition assessments. It also benefits from building-envelope, energy-code, and fire-safety checks for commercial properties. Owners of larger portfolios increasingly require ongoing documentation for resilience requirements and insurance reviews. These needs can lift assignment values above those of a single pre-sale inspection. UL Solutions launched ULTRUS Records for Buildings in North America in June 2026 to centralize inspection records and corrective-action management for multi-site portfolios. The North America inspection services market is moving from isolated field events toward ongoing compliance administration.
Civil infrastructure inspection services are forecast to grow at a 7.1% CAGR through 2032. The North America inspection services market size for this service domain is supported by bridge construction and rehabilitation activity under federal programs. The Bridge Formula Program had apportioned USD 21.2 billion for 12,306 projects through fiscal year 2025. The North America inspection services industry includes stable mid-tier demand from manufactured product and production-process inspection services and vehicle and mobile asset inspection services under original equipment manufacturer quality requirements. Commodity, cargo, and trade inspection services are projected to grow at a 7.5% CAGR through 2032. Its expansion is linked to supplier documentation and origin-verification needs across North American trade flows. The North America inspection services market, therefore, extends its customer base beyond construction and property activity.

By End-Use Industry:
Construction Anchors Demand While Utilities Grow FasterConstruction, real estate, and civil infrastructure accounted for 23% of the North America inspection services market size in 2026. Its position reflects mandatory checks across planning, construction, commissioning, and asset management. Institutional asset owners also request periodic condition monitoring to support insurance reviews and sustainability reporting. This end-use group includes a broad set of projects rather than a single construction cycle. The resulting mix provides recurring assignments across property and civil assets. Its scale gives providers an established volume base for related digital reporting and compliance services.
Power generation, renewable energy, and utilities are projected to grow at a 6.5% CAGR through 2032. Wind blade inspection, solar photovoltaic thermal imaging, and battery energy storage commissioning have created a specialized service area. Sky Climber Renewables offers drone inspection, ultrasonic testing, and thermal imaging for wind and solar assets through ISO-certified processes. Oil and gas remain an inspection-intensive end use because revised technical standards can require operators to reassess integrity programs. Healthcare, pharmaceuticals, life sciences, agriculture, food and beverage, mining, and quarrying add distinct inspection requirements.
Geography Analysis
United States Inspection Services Market
The United States held 78% of the North America inspection services market share in 2026 and is forecast to grow at a 7.2% CAGR through 2032. Its scale comes from inspection programs overseen by OSHA, FDA, EPA, PHMSA, FAA, and the Nuclear Regulatory Commission. The United States also has the region’s largest stock of regulated infrastructure and energy assets. Infrastructure rehabilitation adds project-stage verification to this mandate-driven base. Semiconductor facilities, electric vehicle battery plants, renewable projects, and data centers require increasingly specialized methods. Power generation, renewable energy, and data-center assignments are expected to play a larger role in the country’s growth through 2032.
Canada Inspection Services Market
Canada has a stable inspection base in oil sands activity, conventional hydrocarbon extraction, pipeline integrity programs, and infrastructure assessment. Health Canada’s 2025 alignment of formaldehyde limits for composite wood products with the United States EPA thresholds reinforces common compliance expectations. Transport Canada’s Part IX drone framework supports remote inspection activity for rail, bridge, and pipeline corridors. Shared standards can simplify service delivery for companies working across borders. Providers with bilingual accreditation are well-positioned for integrated contracts. These conditions support continuity rather than rapid expansion in Canadian demand.
Mexico Inspection Services Market
Mexico is expected to record a 9% CAGR through 2032, the highest rate among the three geographies. New automotive, electronics, aerospace, and medical-device facilities in Monterrey, Querétaro, and Guadalajara need supplier qualification, in-process inspection, and conformity assessment. These facilities use standards such as ISO 9001, IATF 16949, and AS9100. SGS Mexico reinforced its Accredited Inspection Unit operations in April 2026 under Mexican accreditation to support NOM conformity assessment. The North America inspection services market gains from first-time inspection requirements as manufacturing capacity expands. Mexico’s growth provides a defined opportunity for firms with accredited local teams and cross-border customer relationships.
Competitive Landscape
The North America inspection services market exhibits a medium level of market concentration. SGS, Bureau Veritas, Intertek, UL Solutions, Acuren, and MISTRAS Group compete alongside regional specialists. SGS closed its Applied Technical Services acquisition in January 2026. The acquired business is expected to add USD 460 million in 2026 sales. The transaction extends SGS’s industrial capability across testing, inspection, calibration, and forensics. It also supports the company’s objective of increasing its North American sales footprint.
Acuren completed its merger with NV5 Global in August 2025. The combined organization reported more than USD 2 billion in revenue, more than 11,000 employees, and over 230 locations. This creates a larger domestic competitor for global service providers. MISTRAS won a contract in December 2025 for NDT services at Woodside’s USD 17.5 billion Louisiana LNG terminal project. The scope includes radiography, magnetic-particle testing, ultrasonic thickness testing, and leak testing.
Competitive strategies increasingly favor recurring, technology-enabled service relationships over isolated inspection contracts. UL Solutions launched its building compliance software for North American multi-site portfolios in June 2026. MISTRAS also partnered with Batchelor & Kimball in September 2025 to provide inspection and quality assurance services for data-center construction. Areas without a decisive leader include evidence acceptance for AI-supported work, supplier qualification for nearshored manufacturing, and remote inspection standards. The North America inspection services market remains open to firms that pair qualified personnel with accepted digital methods.
North America Inspection Services Industry Leaders
-
SGS SA
-
Intertek Group plc
-
Bureau Veritas SA
-
UL Solutions Inc.
-
TÜV SÜD AG
- *Disclaimer: Major Players sorted in no particular order
North America Inspection Services Market Companies Covered in this Report
- SGS SA
- Intertek Group plc
- Bureau Veritas SA
- UL Solutions Inc.
- TÜV SÜD AG
- TÜV Rheinland AG
- Applus+ Services SA
- Eurofins Scientific SE
- DEKRA SE
- DNV AS
- TÜV NORD GROUP
- ALS Limited
- Element Materials Technology Group Ltd.
- MISTRAS Group, Inc.
- Baker Hughes Company
- Acuren
- TEAM, Inc.
- Eddyfi Technologies
- FPrimeC Solutions Inc.
- CSA Group Testing and Certification Inc.
- NTS (National Technical Systems)
Recent Industry Developments in North America Inspection Services Market
- April 2026: UL Solutions Inc. entered a definitive agreement to acquire the electrical and electronics business of Eurofins Scientific SE at an enterprise value of EUR 575 million (USD 676.4 million), expanding UL Solutions’ inspection and testing capabilities across consumer and industrial electronics in North America.
- January 2026: SGS SA closed the acquisition of Applied Technical Services, a North American provider of testing, inspection, calibration, and forensics, expected to contribute USD 460 million in 2026 sales, achieving 80% of SGS’s Strategy 27 target to more than double North American sales between 2023 and 2027.
- August 2025: Acuren Corporation completed its merger with NV5 Global, Inc. at an enterprise value of USD 1.7 billion, creating a North American TICC and engineering services entity with over USD 2 billion in combined revenue and more than 11,000 employees across 230+ locations.
North America Inspection Services Market Report Scope
The North America Inspection Services Market Report is Segmented by Inspection Service Domain (Building and Property Inspection Services, Civil Infrastructure Inspection Services, and More), by End-Use Industry (Construction, Real Estate and Civil Infrastructure, Households and Individual Consumers, and More), and by Geography (United States, Canada, and Mexico). The Market Forecasts are Provided in Terms of Value (USD).
Segmentation Overview
| Building and Property Inspection Services | Residential, Commercial and Institutional Building Inspections |
| Structural, Building Envelope, MEP and Fire-Safety Inspections | |
| Property Condition, Construction and Handover Inspections | |
| Civil Infrastructure Inspection Services | Roads, Bridges, Tunnels and Rail Track Infrastructure |
| Dams, Civil Water Infrastructure and Other Civil Engineering Structures | |
| Industrial Facilities and Fixed Asset Inspection Services | Industrial Plants and Installed Process Equipment |
| Pressure Vessels, Pipelines and Storage Tanks | |
| Energy Generation and Utility Systems | |
| Other Stationary Industrial Equipment | |
| Manufactured Product and Production-Process Inspection Services | Raw Material and Component Inspection |
| In-Process Manufacturing Inspection | |
| Finished-Product and Production-Process Conformity Inspection | |
| Transportation Vehicle and Mobile Asset Inspection Services | Road Vehicles and Commercial Fleets |
| Rail Rolling Stock | |
| Aircraft and Aviation Assets | |
| Ships and Other Marine Vessels | |
| Other Mobile Transportation Assets | |
| Commodity, Cargo and Trade Inspection Services | Bulk and Containerized Cargo Inspection |
| Traded Commodity Inspection | |
| Consignment Condition, Quantity and Quality Verification | |
| Loading, Unloading and Custody-Transfer Inspection | |
| Other Operational Site and Process Inspection Services | Physical Hygiene and Workplace Safety Inspection |
| Agricultural Site Inspection | |
| Other Operational Compliance Inspection |
| Oil and Gas, Including Petroleum Refining and Petrochemicals |
| Power Generation, Renewable Energy and Utilities |
| Manufacturing and Industrial Processing (Excluding Industries Separately Classified) |
| Construction, Real Estate and Civil Infrastructure |
| Transportation and Logistics Operations |
| Mining and Quarrying |
| Agriculture, Food and Beverage |
| Wholesale, Retail and Commodity Trading |
| Healthcare, Pharmaceuticals and Life Sciences |
| Households and Individual Consumers |
| Other Commercial Services and Public Institutions |
| United States |
| Canada |
| Mexico |
| By Inspection Service Domain | Building and Property Inspection Services | Residential, Commercial and Institutional Building Inspections |
| Structural, Building Envelope, MEP and Fire-Safety Inspections | ||
| Property Condition, Construction and Handover Inspections | ||
| Civil Infrastructure Inspection Services | Roads, Bridges, Tunnels and Rail Track Infrastructure | |
| Dams, Civil Water Infrastructure and Other Civil Engineering Structures | ||
| Industrial Facilities and Fixed Asset Inspection Services | Industrial Plants and Installed Process Equipment | |
| Pressure Vessels, Pipelines and Storage Tanks | ||
| Energy Generation and Utility Systems | ||
| Other Stationary Industrial Equipment | ||
| Manufactured Product and Production-Process Inspection Services | Raw Material and Component Inspection | |
| In-Process Manufacturing Inspection | ||
| Finished-Product and Production-Process Conformity Inspection | ||
| Transportation Vehicle and Mobile Asset Inspection Services | Road Vehicles and Commercial Fleets | |
| Rail Rolling Stock | ||
| Aircraft and Aviation Assets | ||
| Ships and Other Marine Vessels | ||
| Other Mobile Transportation Assets | ||
| Commodity, Cargo and Trade Inspection Services | Bulk and Containerized Cargo Inspection | |
| Traded Commodity Inspection | ||
| Consignment Condition, Quantity and Quality Verification | ||
| Loading, Unloading and Custody-Transfer Inspection | ||
| Other Operational Site and Process Inspection Services | Physical Hygiene and Workplace Safety Inspection | |
| Agricultural Site Inspection | ||
| Other Operational Compliance Inspection | ||
| By End-Use Industry | Oil and Gas, Including Petroleum Refining and Petrochemicals | |
| Power Generation, Renewable Energy and Utilities | ||
| Manufacturing and Industrial Processing (Excluding Industries Separately Classified) | ||
| Construction, Real Estate and Civil Infrastructure | ||
| Transportation and Logistics Operations | ||
| Mining and Quarrying | ||
| Agriculture, Food and Beverage | ||
| Wholesale, Retail and Commodity Trading | ||
| Healthcare, Pharmaceuticals and Life Sciences | ||
| Households and Individual Consumers | ||
| Other Commercial Services and Public Institutions | ||
| By Geography | United States | |
| Canada | ||
| Mexico | ||
Key Questions Answered in the Report
What is the projected value of North America inspection services by 2032?
The sector is forecast to reach USD 49.58 billion by 2032, growing from USD 36.98 billion in 2027 at a 6.04% CAGR.
Which inspection service domain has the largest revenue base?
Building and property inspection services led with 32% share in 2026, supported by transaction, safety, and compliance checks.
Why does infrastructure create demand for inspection providers?
Bridge and other public-asset programs require assessment, conformance checks, and post-rehabilitation documentation.
Which country is expected to grow most rapidly?
Mexico is forecast to grow at a 9% CAGR through 2032 as manufacturing capacity raises supplier qualification and conformity needs.
What constrains expansion among service providers?
A limited supply of certified NDT staff, high equipment costs, and inconsistent acceptance of remote evidence can restrict completed work.