
Market Overview
| Study Period | 2021 - 2031 |
|---|---|
| Forecast Data Period | 2026 - 2031 |
| Historical Data Period | 2021 - 2024 |
| Growth Rate | 4.44 % |
| Market Concentration | Medium |
Major Players *Disclaimer: Major Players sorted in no particular order Image © Mordor Intelligence. Reuse requires attribution under CC BY 4.0. | |
North America Directional Drilling Services Market Analysis by Mordor Intelligence
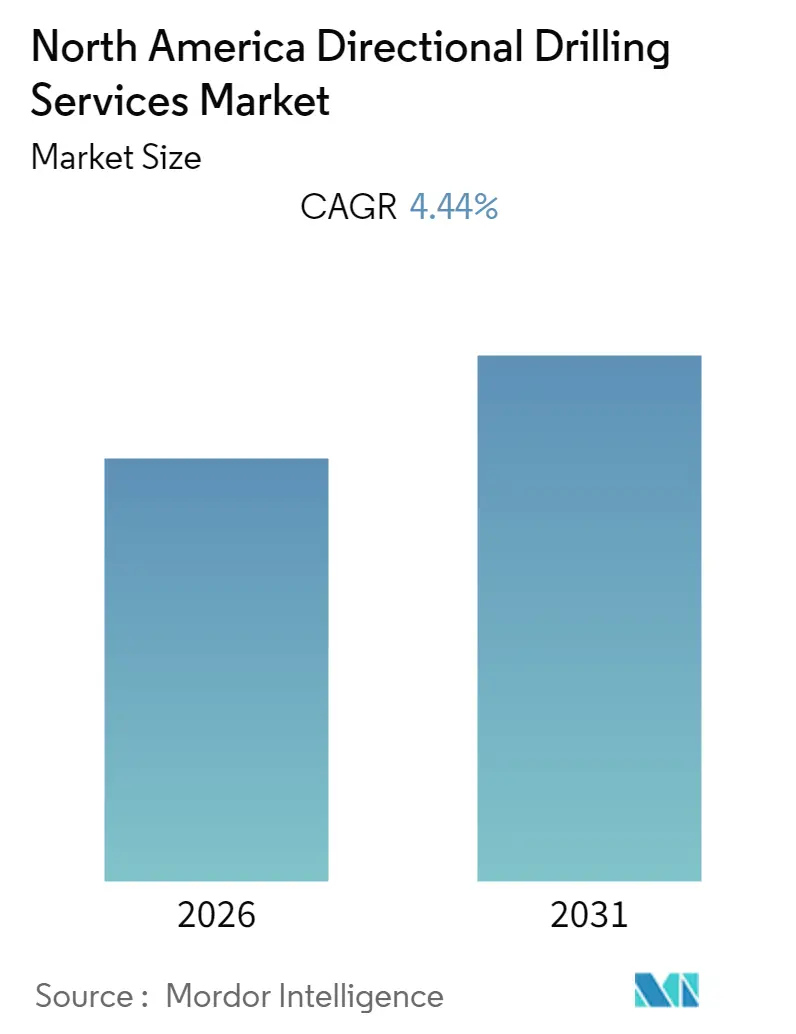
The North America Directional Drilling Services Market size is expected to grow from USD 6.87 billion in 2025 to USD 7.18 billion in 2026 and is forecast to reach USD 8.92 billion by 2031 at 4.44% CAGR over 2026-2031.
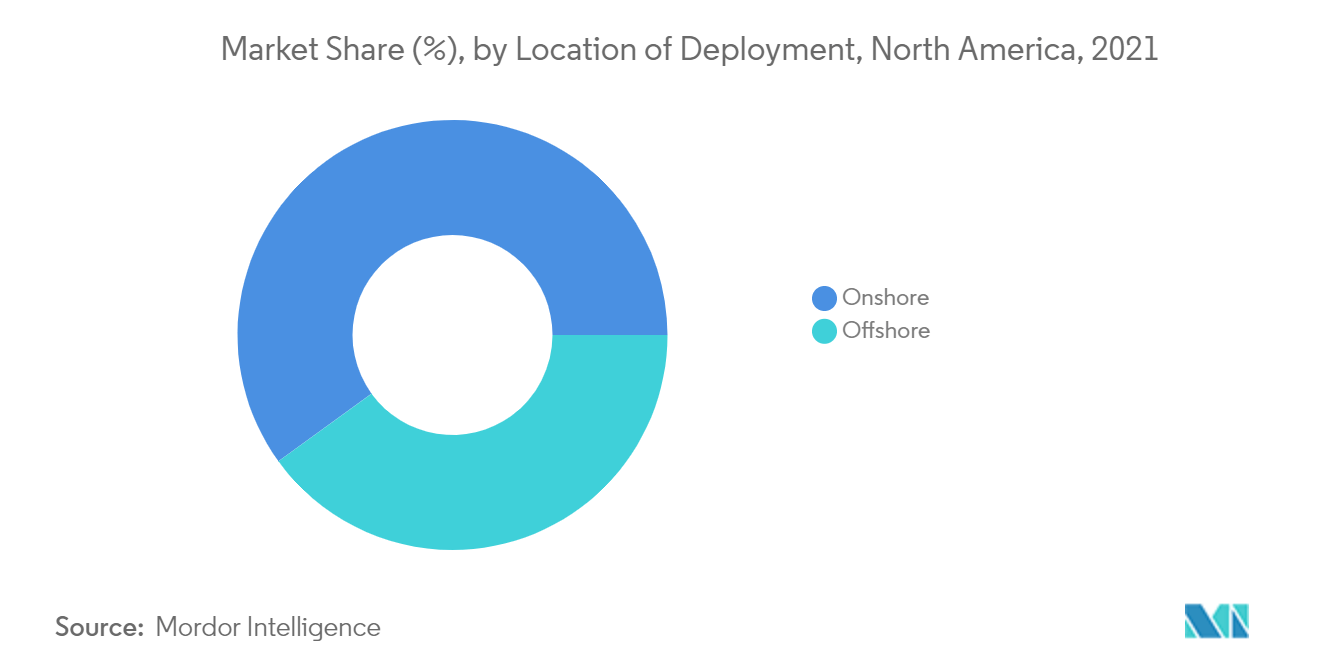
- Offshore segment is expected to witness significant growth during the forecast period, owing the cost of operation in the offshore locations declining significantly over the past few years. This factor is encouraging the industry to step up its expenditure gradually in the future and drive the directional drilling services market in North American region.
- Factors, such as technological improvements and increasing viability of deepwater and ultra-deepwater projects, several new markets, such as Gulf of Mexico is actively promoting the development of deepwater and ultra-deepwater reserves. This, in turn, is expected to create significant opportunities for the operating countries in the near future.
- United States is expected to continue its dominance for directional drilling services market in North American region during the forecast period.
Note: Market size and forecast figures in this report are generated using Mordor Intelligence’s proprietary estimation framework, updated with the latest available data and insights as of 2026.
North America Directional Drilling Services Market Trends and Insights
Offshore Segment Expected to Witness Significant Demand
- Directional drilling services are significantly used in the offshore sector, because majority of the wells in the offshore sector are drilled from a single drilling rig in order to save costs. Also, the extended reach wells and horizontal wells are usually used to develop the offshore oil and gas fields, mainly due to the required number of platforms can be reduced. The demand for directional drilling services in the offshore sector are expected to witness significant growth during the forecast period, mainly driven by increasing investments in the sector and upcoming exploration and production activities in the offshore segment.
- As of 2021, the offshore oil and gas industry accounted for about 15.2% of the United States' crude oil production. The Gulf of Mexico is the major offshore oil and gas producing region in North America.
- The offshore oil and gas drilling sector had been subdued in the past few years, mainly due to the crude oil price being lower than the breakeven price of several offshore oil and gas fields. As a result, the demand for directional drilling has been negatively impacted.
- The brent crude oil prices started showing signs of improvement after mid-2016 and remained well above USD 60 per barrel throughout 2018 (except December 2018). This, coupled with the cost reduction program of upstream oil and gas companies, resulted in gaining the confidence of investors for final investment decisions for projects, which got canceled during the low commodity price environment.
- With the rising number of maturing onshore oilfields in the recent years, there has been growth in the offshore exploration and production (E&P) activities. The Permian Basin of United States is the most important basin in terms of crude oil production in the country, although the production from old wells has started to decline, and there is little scope for new discovery in these areas. As a result, the oil and gas industry is shifting toward deeper regions in search of oil and gas, in order to meet the increasing demand.
- Therefore, based on the above-mentioned factors, offshore segment is expected to witness a significant growth in the North America directional drilling services market during the forecast period.


United States to Dominate the Market
- The United States, as of 2021, was the largest producer of oil and gas across the globe. In the United States, there are more than 900,000 active oil and gas wells, and more than 130,000 have been drilled since 2010. The United States has one of the largest technically-recoverable shale gas reserves, and the second-largest tight oil reserves in the world. The technological development in the hydraulic fracturing and low breakeven prices have supported the oil and gas directional drilling activities in the region.
- According to the United States Geological Survey (USGS), over 46 billion barrels of oil, 280 trillion cubic feet of gas, and 20 billion barrels of natural gas liquids are trapped in the low-permeability shale formations of the United States, as of 2021. To fulfil the increasing demand for oil and gas, these fields are likely to be explored and produced.
- The oil and gas companies in the country have successfully deployed their technologies, also to exploit the shale reserves in the country and achieve the ambitious goal of becoming a net exporter of energy in the coming years. Each unconventional well, on an average, is being drilled with longer lateral well sections, or laterals, and more hydraulic fracturing stages per lateral length.
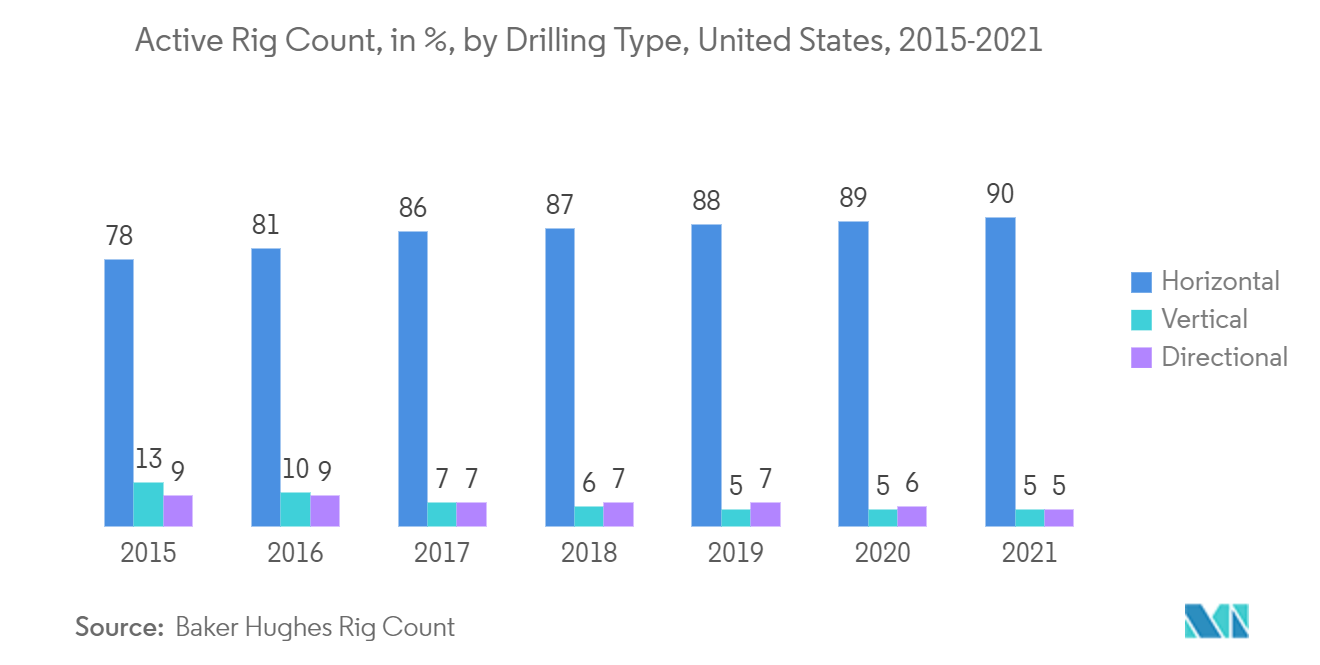
- Modern hydraulic fracturing, combined with horizontal drilling, allows multiple wells to be drilled from a single spot. This practice not only increases the drainage area significantly but also reduces the required surface drilling area above, by as much as 90%, in turn, reducing the cost of drilling per barrel of oil produced.
- The combination of horizontal drilling and hydraulic fracturing increased the production of crude oil, lease condensate, and natural gas in the country over the past few years. Hydraulically fractured horizontal wells have accounted for most of all the new wells drilled and completed across the country.
- Advancements in hydraulic fracturing and horizontal completions have made shale gas wells more profitable. Shale gas is estimated to account for about 46% of the total natural gas supply in the United States, by 2035. Horizontal drilling is often used for shale gas reserves, with lateral lengths up to 20,000 feet within the shale. Thus, the increasing demand for unconventional reserves, such as shale plays and tight oil, is expected to boost the demand for directional drilling, during the forecast period.
- Therefore, based on the above-mentioned factors, United States is exoected to dominate the North America directional drilling services market during the forecast period.
Regulatory Landscape
In North America, the Bureau of Safety and Environmental Enforcement (BSEE) anchors compliance for well construction and well control across offshore and onshore segments. In January 2026, BSEE updated its B-PINCs (Procedures, Instructions, Notices, and Corrections) for Subpart G well operations, mandating API Standard 53, Fourth Edition, for BOP system design, maintenance, and testing. This shapes equipment selection and service procedures for offshore directional drilling campaigns.
The reporting and recordkeeping requirements under the 2023 well control rule are set to take effect on August 10, 2026, reducing duplicative submissions and improving traceability of safety events. At the federal level, the EPA is pursuing Clean Air Act Section 112 updates related to methane and hazardous air pollutant emissions at oil and gas production facilities as of April 2026, which can increase monitoring and documentation intensity. HDD activity remains governed by a decentralized state and provincial framework with common thresholds such as EPA Method 9095 (Paint Filter Test), while FERC provides guidance for HDD monitoring, inadvertent return response, and contingency planning for pipeline crossings.
Value Chain Analysis
The North America directional drilling value chain starts with upstream supply of specialized tubulars, motors, bits, electronics, and sensors, and extends into tool assembly, calibration, and testing. Field deployment then relies on measurement-while-drilling (MWD) and logging-while-drilling (LWD), rotary steerable systems (RSS) or conventional BHA solutions, plus real-time wellbore placement support.
Value is increasingly captured in the integration layer, where service companies combine downhole hardware with surface software, automation, and continuous telemetry to reduce nonproductive time and maintain wells within target zones. Downstream activities include wellsite operations, interpretation and reporting, tool maintenance and repair cycles, and consumables and waste management for drilling fluids and cuttings, where environmental standards for mud disposal and methane capture act as a gating item. For offshore work in particular, BSEE-aligned well control practices, including API Standard 53 references in the January 2026 guidance, reinforce structured maintenance, testing, and recordkeeping across contractors, OEMs, and operators, affecting procurement cycles and service delivery models. Baker Hughes' post-acquisition strategy to harmonize product and technology platforms is also a factor in coordinating supply chain, manufacturing, and engineering practices.
Competitive Landscape
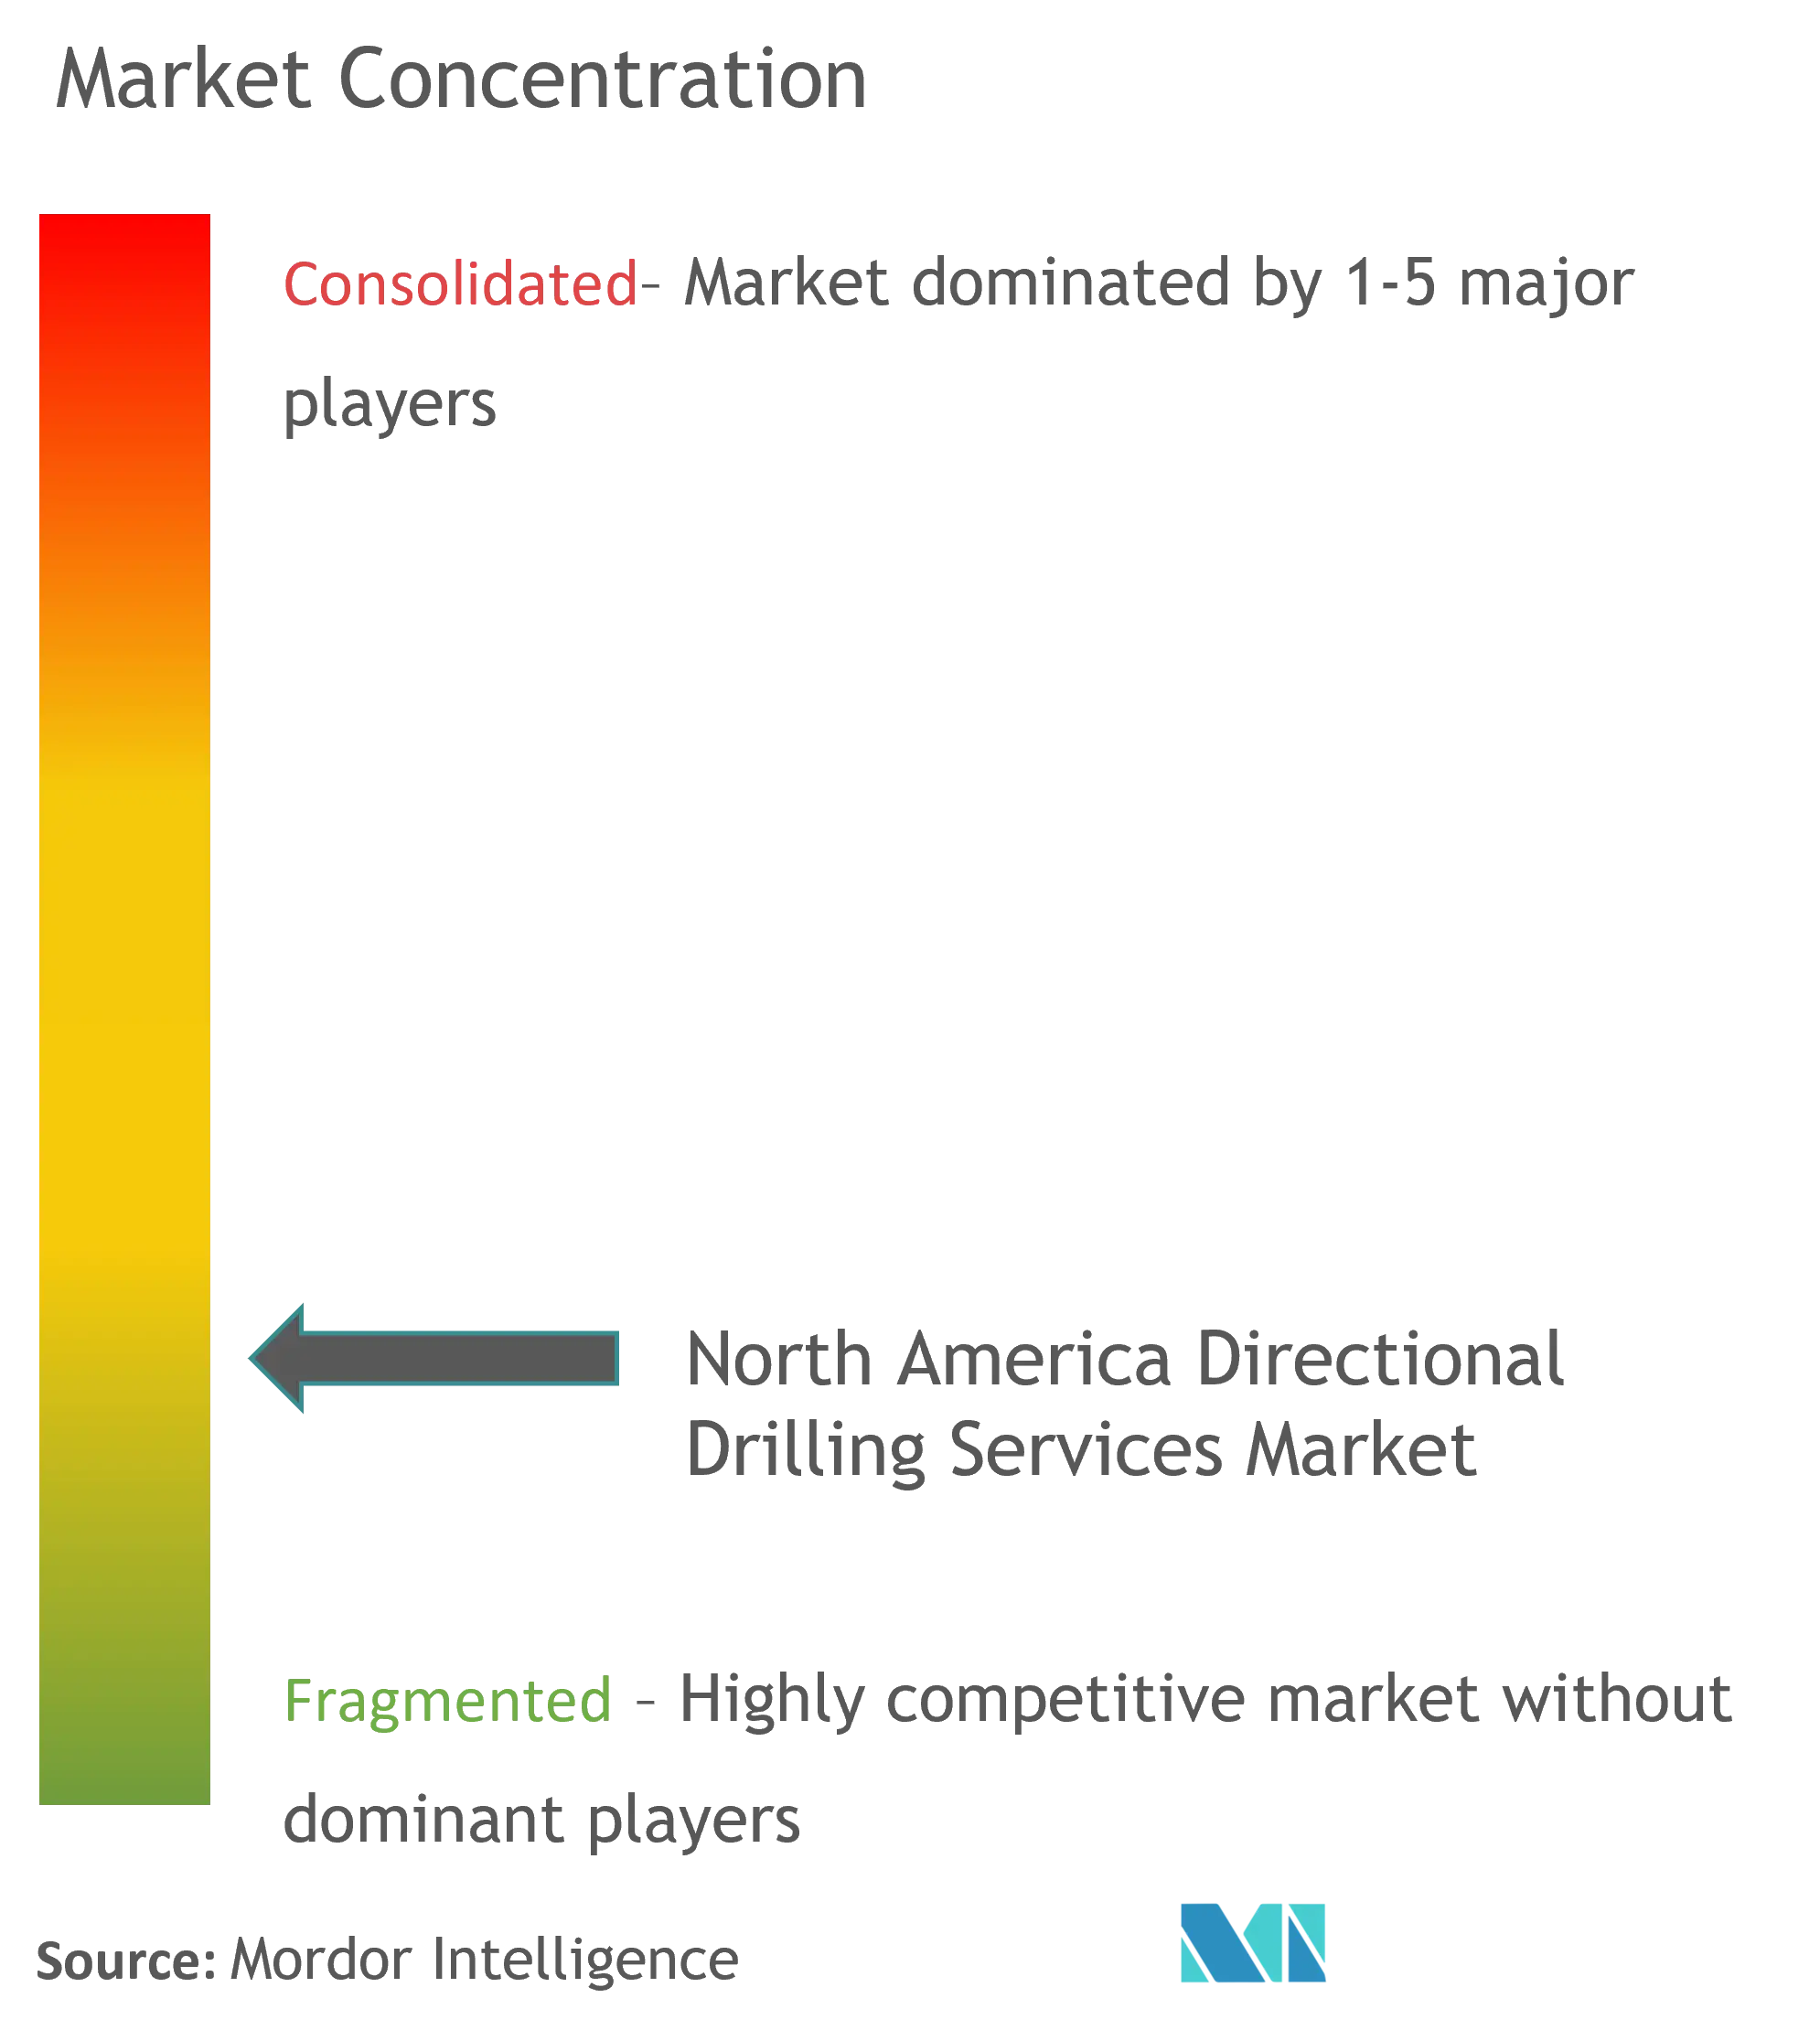
The North America directional drilling services market is moderately fragmented. Some of the major players include Schlumberger NV, Weatherford International PLC, Halliburton Company, Baker Hughes Company, and KLX Energy Services Holdings, Inc.
North America Directional Drilling Services Industry Leaders
Weatherford International plc
Halliburton Company
Baker Hughes Co
KLX Energy Services Holdings, Inc.
Schlumberger NV
- *Disclaimer: Major Players sorted in no particular order

Market Opportunities and Future Outlook
Onshore, shale operators in the Permian Basin are expanding horizontal well programs, with longer laterals and higher stage counts driving demand for directional drilling services, reliable MWD and LWD, and automation-enabled drilling workflows. In 2026, Halliburton's April 2026 acquisition of Sekal AS accelerates drilling automation capabilities for North American onshore programs, particularly around digital drilling autonomy.
Weatherford's July 2026 acquisition of NCS Multistage expands its well completions portfolio, while Baker Hughes' July 2026 acquisition of Chart Industries broadens gas infrastructure, carbon capture and storage, and geothermal capabilities. Together, these moves increase the scope for integrated directional drilling solutions across adjacent energy and infrastructure needs.
Recent Industry Developments
- April 2026: Halliburton acquired Sekal AS from Sumitomo Corporation to accelerate drilling automation services. The acquisition strengthens Halliburton's digital autonomy portfolio for automated drilling in the North American market and supports integrated services growth and competitive differentiation.
- March 2026: Halliburton achieved world’s first fully closed-loop automated geological well placement in offshore Guyana with ExxonMobil. The breakthrough uses LOGIX and DrillTronics to pioneer automated well placement, signaling scalable automation success and accelerating adoption of automated workflows in North American offshore projects.
- January 2026: Halliburton launched HyperSteer MX directional drill bit. The new matrix-body bit targets high-flow, abrasive environments, enhancing performance and durability and supporting product differentiation in North American drilling services.


Research Methodology Framework and Report Scope
Market Definition and Coverage
For this study, we define the North America directional drilling services market as the revenue earned from providing directional wellbore planning and execution services, including tools and crews used to drill deviated and horizontal sections for oil and gas wells in North America.
Scope exclusions: We exclude drilling rigs and rig rental, well completion services, seismic work, and general oilfield logistics that are billed outside directional drilling service lines.
Segmentation Overview
- Location of Deployment
- Onshore
- Offshore
- Type
- Rotary Steerable System (RSS)
- Conventional
- Geography
- United States
- Canada
- Rest of North America
Data Sources, Market Sizing, and Validation
Desk Research
Desk work starts with building a clear activity baseline for onshore and offshore drilling, since directional service demand is tied to how many wells get drilled and how complex the well paths are. We rely on public and official sources such as the US Energy Information Administration, Baker Hughes rig count updates, Bureau of Safety and Environmental Enforcement releases for offshore activity signals, and Canada Energy Regulator publications to anchor the drilling outlook.
We also review company filings and investor presentations for pricing commentary, utilization themes, and service mix, which are then checked against technical society papers and peer-reviewed petroleum engineering journals for directional drilling performance trends. When needed, our analysts also use paid subscriptions for company financials and intelligence, and for shipment-level import and export checks on select tools, so assumptions can be cross-checked against external signals. The sources listed here are illustrative and not exhaustive, and many other public references are used for data collection, validation, and research clarification.
Primary Interviews and Surveys
Primary work is used to pressure-test the desk model and close gaps around service pricing, tool adoption, and the split between conventional and rotary steerable jobs across basins. We spoke with a mix of service operations leaders, drilling engineers, procurement teams, and field managers across the United States and Canada. Their input was then used to confirm volume drivers, utilization ranges, and realistic pricing behavior.
Distribution of primary research fieldwork respondents
| Company type | Respondent position |
|---|---|
| Top tier: 33% | CXOs: 13% |
| Mid tier: 47% | Functional/Unit leaders: 43% |
| Smaller Players: 20% | Managers: 44% |
Market-Sizing & Forecasting
Market sizing is built using top-down and bottom-up logic in a way that can be repeated each update. The top-down side reconstructs directional service demand from the active drilling pool by linking wells drilled and footage trends to directional service intensity, followed by applying service rate ranges that fit the onshore and offshore job mix.
To keep the totals realistic, the model is checked with selective bottom-up approximations, such as sampled pricing per day or per foot multiplied by expected job volumes, and channel checks on how often rotary steerable systems are used versus conventional motor-based drilling. Key inputs we track include rig counts and drilling activity, horizontal well share, average lateral lengths, drilling days per well as a proxy for complexity, the portion of offshore wells that require directional packages, and service pricing movement linked to utilization. Where a supplier roll-up cannot be completed for smaller operators or private activity, gaps are handled using basin-level averages tied to drilling intensity and the closest comparable operating conditions.
For forecasting, scenario analysis is used because directional service demand moves with operator budgets and commodity-driven drilling programs. We build a base case and then adjust around it using variables like expected rig changes, lateral length progression, and adoption of rotary steerable tools. Those ranges are checked against what interviewees see as feasible capacity and pricing behavior over the next few years.
Data Validation & Update Cycle
Validation is done through several checks so the outputs stay connected to real activity. Our analysts compare the modeled market values against independent signals like rig counts, well counts, footage trends, and the direction of disclosed service revenue in company updates, and then investigate large jumps before the numbers are finalized.
A second analyst reviews the assumptions, math, and year-to-year movements, followed by a final pass focused on unit consistency, currency handling, and whether onshore and offshore totals still align with known activity patterns. The report is refreshed annually, and interim updates are triggered if material events shift drilling activity or service pricing. After that, the impacted assumptions are rechecked through follow-up outreach.
Mordor Intelligence's North America Directional Drilling Services Market Size Compared With Other Published Estimates
Published market sizes for directional drilling services in North America can differ even when the topic name looks similar. The gaps usually come from what is counted as a service, which years are treated as the base, and how drilling activity and pricing are translated into revenue.
Rig counts, horizontal well intensity, and shifts in service pricing are used as practical checks, and those signals keep Mordor Intelligence's 2025 market size aligned to directional drilling service billings, rather than equipment sales or broader oilfield work that can be bundled into some totals.
Benchmark comparison
| Source | Market Size | Gaps in Research Methodology |
|---|---|---|
| Mordor Intelligence | USD 6.87 B (2025) | |
| Industry Research Publisher A | USD 5.80 B (2024) | This figure appears to use an earlier base year and a less explicit service definition, which can miss the latest pricing uplift from longer laterals and higher rotary steerable usage in active basins. |
| Consultancy Brief B | USD 6.00 B (2025) | This estimate reads closer to a combined directional drilling view where some tool or system revenues may be blended with services, and the onshore versus offshore weighting is not clearly shown. |
The spread across the values is mainly explained by service scope and by how activity and pricing are converted into revenue totals. With inputs that can be traced back to drilling intensity and validated pricing ranges, the final number stays balanced and repeatable in future refreshes.


Key Questions Answered in the Report
What is the current North America Directional Drilling Services Market size?
The North America Directional Drilling Services Market is projected to register a CAGR of 4.44% during the forecast period (2026-2031)
Who are the key players in North America Directional Drilling Services Market?
Weatherford International plc, Halliburton Company, Baker Hughes Co, KLX Energy Services Holdings, Inc. and Schlumberger NV are the major companies operating in the North America Directional Drilling Services Market.
What years does this North America Directional Drilling Services Market cover?
The report covers the North America Directional Drilling Services Market historical market size for years: 2020, 2021, 2022, 2023, 2024 and 2025. The report also forecasts the North America Directional Drilling Services Market size for years: 2026, 2027, 2028, 2029, 2030 and 2031.
Page last updated on:


 Your data is secure and never sold or shared.


