
Land Drilling Rig Market Size and Share
Market Overview
| Study Period | 2021 - 2031 |
|---|---|
| Market Size (2026) | USD 62.03 Billion |
| Market Size (2031) | USD 63.38 Billion |
| Growth Rate (2026 - 2031) | 0.43 % |
| Fastest Growing Market | Asia Pacific |
| Largest Market | North America |
| Market Concentration | Medium |
Major Players *Disclaimer: Major Players sorted in no particular order Image © Mordor Intelligence. Reuse requires attribution under CC BY 4.0. | |
Land Drilling Rig Market Analysis by Mordor Intelligence
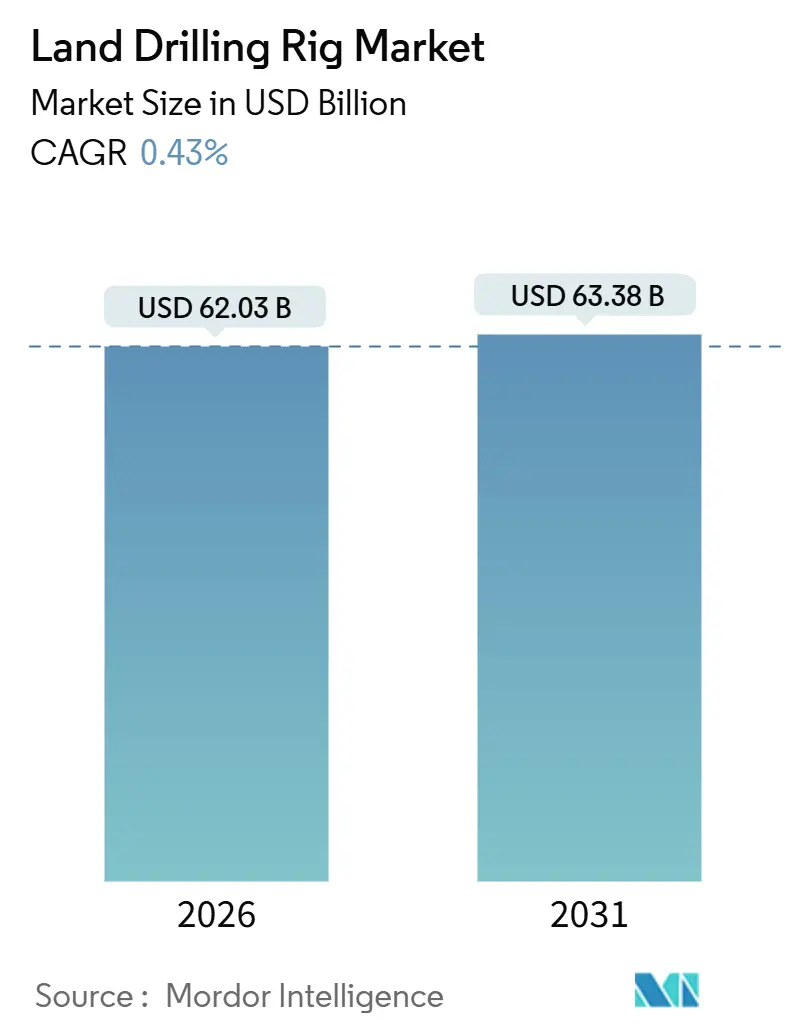
The Land Drilling Rig Market size is estimated at USD 62.03 billion in 2026, and is expected to reach USD 63.38 billion by 2031, at a CAGR of 0.43% during the forecast period (2026-2031).
Demand stability masks an ongoing shift toward super-spec technology, stricter emissions rules, and divergent regional capital-spending patterns that collectively reshape contractor economics. North American operators continue to retire legacy mechanical fleets in favor of high-horsepower AC rigs that shorten spud-to-TD cycles and cut fuel burn, while Middle Eastern national oil companies (NOCs) expand government-backed fleets to secure unconventional gas supply. Corporate net-zero targets are nudging dayrate premiums for rigs equipped with dual-fuel engines, selective catalytic reduction, and automated pipe-handling systems. Meanwhile, geothermal and natural-hydrogen pilot wells are opening nascent but fast-growing avenues for land drilling contractors willing to tailor equipment to corrosive fluids and hard-rock environments. Competitive intensity remains pronounced as super-spec supply is concentrated among a handful of North American contractors, yet regional fragmentation persists where NOCs favor domestic providers.
Key Report Takeaways
- By rig type, mobile and wheel-mounted platforms captured 40.8% of 2025 revenue, whereas walking super-spec rigs are advancing at a 0.8% CAGR through 2031.
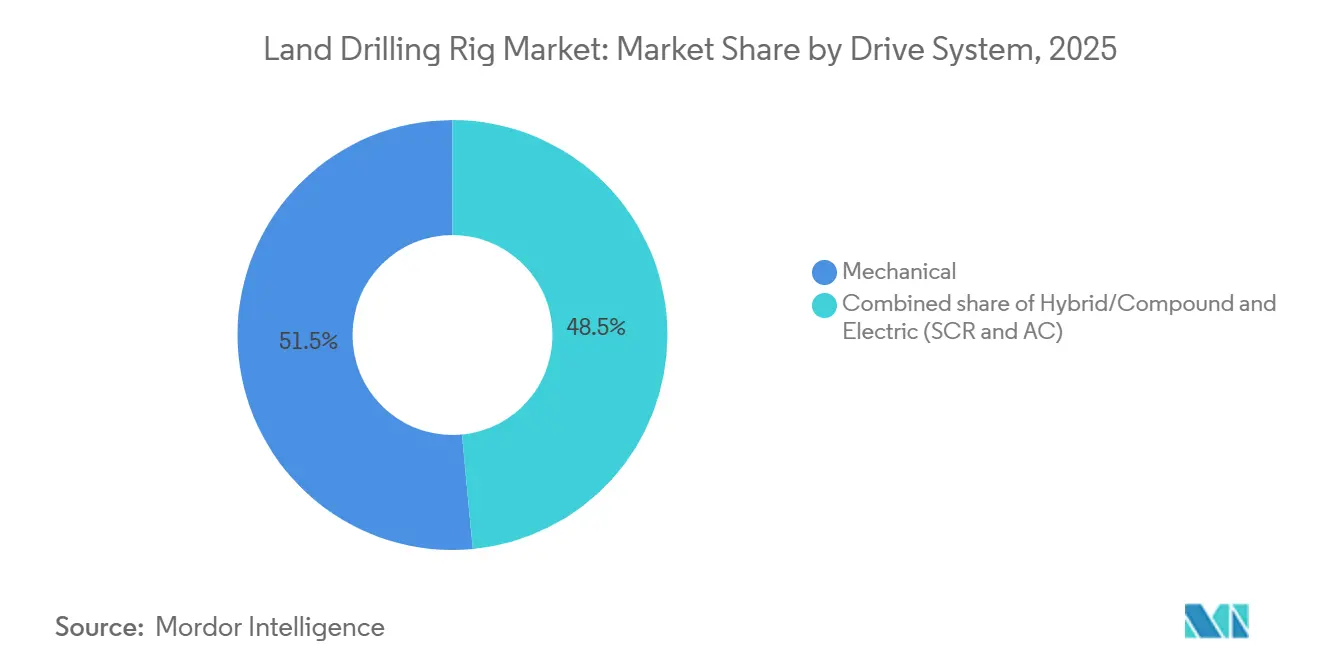
- By drive system, mechanical rigs held 51.5% of the 2025 value, while electric SCR and AC architectures are posting the segment’s fastest 0.7% CAGR as emissions scrutiny intensifies.
- By horsepower, 1,000-1,499 HP units accounted for 60.7% of deployments in 2025; however, rigs above 1,500 HP lead growth with a 1.0% CAGR on the strength of deeper Permian and Middle Eastern wells.
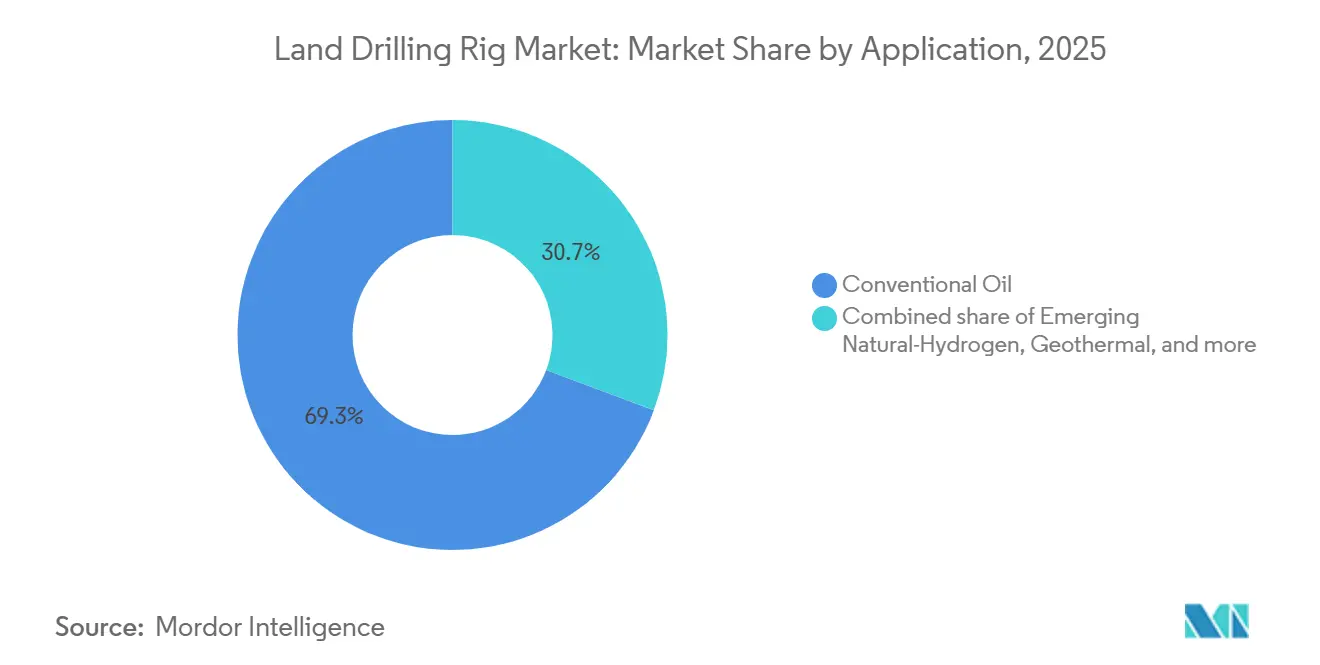
- By application, conventional oil drilling maintained 69.3% of 2025 activity, yet natural-hydrogen programs are rising at a 15.5% CAGR from a small base.
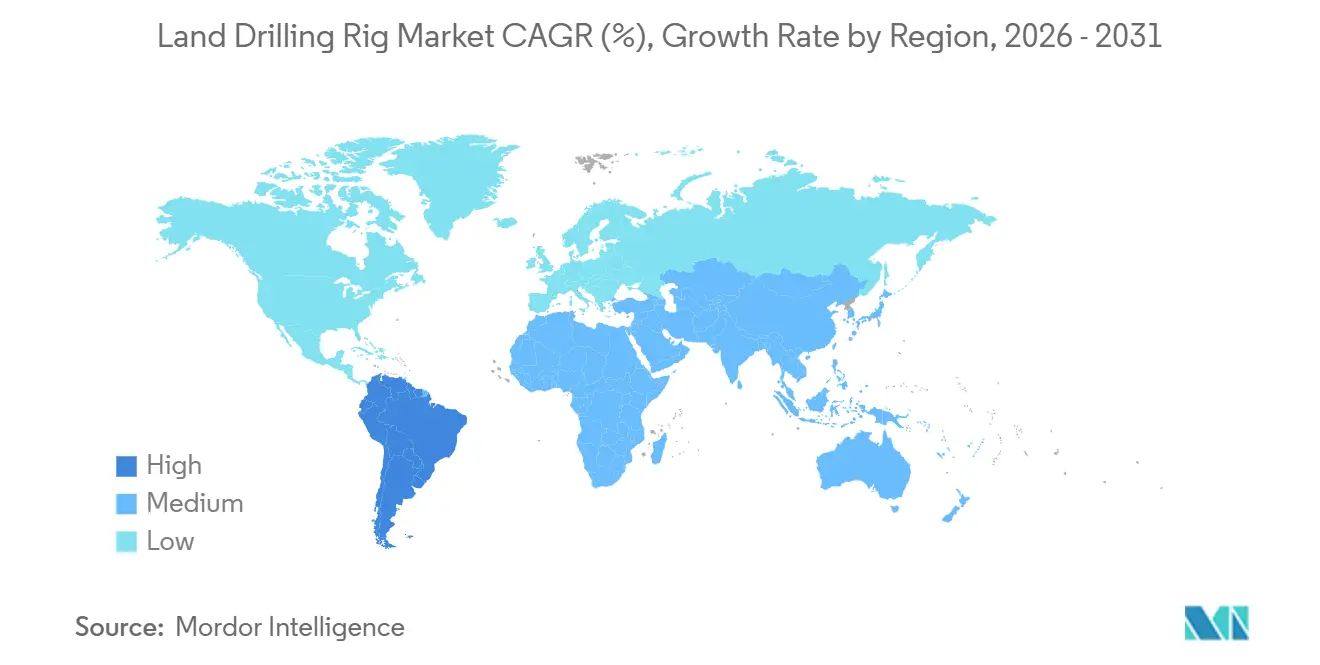
- By geography, North America generated 49.9% of the 2025 market value, but Asia-Pacific is the fastest-growing region at a 1.3% CAGR, fueled by India’s geothermal push and Australia’s tight-gas projects.
- The five largest contractors, Nabors Industries, Helmerich & Payne, Patterson-UTI Energy, Precision Drilling, and ADNOC Drilling, collectively controlled roughly 45% of global active rigs in 2025.
Note: Market size and forecast figures in this report are generated using Mordor Intelligence’s proprietary estimation framework, updated with the latest available data and insights as of January 2026.
Market Trends and Insights
Drivers Impact Analysis of Land Drilling Rig Market*
| Driver | (~) % Impact on CAGR Forecast | Geographic Relevance | Impact Timeline |
|---|---|---|---|
| ≥1,500 HP super-spec adoption | +0.20% | North America, Middle East | Medium term (2-4 years) |
| Shale and other unconventional reserves | +0.10% | North America, Argentina, Australia | Long term (≥ 4 years) |
| Revival of MENA onshore CAPEX | +0.15% | Middle East, North Africa | Short term (≤ 2 years) |
| Low-emission gas/LNG-powered rig engines | +0.05% | Global, early adoption in North America | Medium term (2-4 years) |
| Fully automated digital rigs | +0.10% | North America, Middle East, Asia-Pacific | Medium term (2-4 years) |
| Geothermal & natural-hydrogen programs | +0.08% | North America, Europe, Asia-Pacific | Long term (≥ 4 years) |
| Source: Mordor Intelligence | |||
≥1,500 HP super-spec adoption
Super-spec platforms above 1,500 HP now dominate complex unconventionals, enabling laterals beyond 15,000 feet and trimming total-depth times by up to 30% versus legacy units.[1] FlexRig fleets in the United States logged average day rates of USD 28,500 in 2025, a USD 3,000 premium justified by 7,500-psi pumps and 750-ton top drives. About 60% of U.S. deployments went to the Permian Basin, where deeper Wolfcamp zones require higher torque. ADNOC Drilling mirrored the trend, adding 12 super-spec rigs for the high-pressure Jafurah gas play. High upfront capex, often above USD 25 million per rig, continues to limit ownership to well-capitalized operators.
Shale and other unconventional reserves
Unconventional drilling has switched from appraisal to factory mode, reinforcing baseline demand for the land drilling rigs market.[2] Argentina’s Vaca Muerta delivered 500,000 barrels per day by late 2025, up 56% in two years, as YPF and partners drilled deeper liquids-rich sections using 1,200-1,500 HP rigs. The United States still accounted for 40% of global unconventional activity, benefiting from takeaway capacity and pro-drilling infrastructure. Australia is emerging as a tight-gas frontier, where Santos is deploying automated rigs in the Cooper Basin to curb labor exposure. Regulatory incentives such as Argentina’s RIGI tax-stability regime are accelerating foreign participation, whereas U.S. federal lease issuance faces legal headwinds.
Revival of MENA onshore CAPEX
Middle Eastern NOCs scheduled USD 130 billion in upstream spend through 2026, dedicating roughly one-third to onshore drilling. Saudi Aramco alone committed USD 7 billion to Jafurah gas, deploying high-spec rigs built for 10,000-psi reservoirs.[3] ADNOC Drilling grew its fleet to 118 units in 2024 and secured multiyear contracts in the Rub’ al Khali, where ambient desert heat demands enhanced cooling systems. Kuwait’s 5-year Burgan contract with KCA Deutag embedded performance clauses tied to rate-of-penetration metrics. Low breakeven prices below USD 30 per barrel help shield the region from oil-price volatility.
Low-emission gas/LNG-powered rig engines
Dual-fuel and field-gas powertrains are gaining momentum as methane regulations tighten. Caterpillar shipped 85 Tier 4 Final engines to North American contractors in 2025.[4] Permian operators slash daily fuel costs by USD 1,500-2,000 when substituting flared gas for diesel, cutting flaring volumes by 20%. Nabors retrofitted 12 rigs for seamless diesel-gas switching, while pilot LNG-powered units entered service in Argentina and Australia to address remote-fuel logistics. Upcoming U.S. methane rules create further incentives, though enforcement timelines remain subject to litigation.
Restraints Impact Analysis of Land Drilling Rig Market*
| Restraint | (~) % Impact on CAGR Forecast | Geographic Relevance | Impact Timeline |
|---|---|---|---|
| Global shift to renewables | -0.15% | Global, pronounced in Europe and North America | Long term (≥ 4 years) |
| Oil-price volatility & capital discipline | -0.12% | Global, most acute in North America | Short term (≤ 2 years) |
| ESG financing & insurance hurdles | -0.08% | North America, Europe | Medium term (2-4 years) |
| Expanding no-drill buffer zones | -0.05% | North America, Europe | Medium term (2-4 years) |
| Source: Mordor Intelligence | |||
Global shift to renewables
Renewables attracted USD 623 billion in investment during 2024, overtaking upstream hydrocarbon spend for a third straight year. The IEA’s Net-Zero scenario sees oil demand peaking in 2025 and sliding 25% by 2035, implying structural pressure on drilling programs. TotalEnergies now directs 40% of its capex toward power and renewables, retreating from North Sea wildcats. Investor activism deepened in 2024 as BlackRock and Vanguard voted against drilling expansions, citing climate risk. Middle Eastern NOCs remain insulated, but North American independents are repurposing rigs toward geothermal, where commercial scale is still years away.
Oil-price volatility & capital discipline
WTI traded between USD 70 and USD 85 during 2024-2025, levels that fund maintenance drilling yet seldom justify fleet additions. Mega-mergers, including ExxonMobil-Pioneer, prioritize inventory depth over incremental rigs, signaling a strategic shift to manufacturing efficiency. U.S. Lower 48 rig counts slipped to 588 in late 2025 even as production rose 3%, evidencing productivity-led growth. Companies such as ConocoPhillips returned USD 14 billion to shareholders in 2024, diverting cash from exploration. Declining drilled-but-uncompleted (DUC) inventories underscore the new capital-discipline paradigm.
*Our forecasts treat driver/restraint impacts as directional, not additive. The impact forecasts reflect baseline growth, mix effects, and variable interactions.
Land Drilling Rig Market Segment Analysis
By Rig Type:
Mobility Versus Automation EconomicsWalking super-spec rigs lifted the land drilling rigs market share for high-tech platforms by adding 0.8% CAGR, even though mobile and wheel-mounted units still generated 40.8% of 2025 revenue. Walking systems cut move times from three days to eight hours, saving up to USD 200,000 per relocation and boosting pad-drilling economics. These benefits appeal most to Permian operators completing 6-12 wells per pad, increasing demand for drilling rig efficiency. Capital intensity above USD 28 million per unit limits their spread in emerging regions, where dayrate premiums must offset financing costs.
At the other end, conventional truck-mounted fleets persist in Argentina, Colombia, and parts of Africa, where dispersed wells, shallow targets, and lower safety standards favor minimal capex. California’s new Tier 4 engine rules effectively ban diesel-only mechanical rigs for new programs, accelerating retirements in the San Joaquin Basin. The Middle East is importing the walking concept; ADNOC moved four units into Jafurah in 2024, validating international demand beyond North America. As super-spec supply tightens, contractors with mixed fleets retain pricing power in conventional work.
By Drive System:
Electric Transition AcceleratesMechanical rigs represented 51.5% of the 2025 land drilling rigs market size, but electric SCR and AC drives are expanding at a 0.7% clip under regulatory and fuel-savings pressure. Electric platforms cut diesel usage by roughly 15% per foot drilled, translating to USD 2,000-3,000 in daily savings at current fuel prices. They also enable regenerative braking during tripping, lowering operating costs further.
Adoption patterns vary by geography. Canada, with challenging winters and shorter drilling windows, is converting slowly; only 55% of Precision Drilling’s 181-rig fleet is electric. China still runs 70% mechanical rigs, though COSL has pilots underway in the Tarim Basin to meet PetroChina methane goals. Lifecycle economics favor full electrification because maintenance expenses fall 18-22% thanks to fewer moving parts, according to an SPE 2024 study. Hybrid diesel-electric setups are bridging the gap where grid or field gas is patchy.

By Horsepower Rating:
Super-Spec Premium PersistsRigs in the 1,000-1,499 HP window captured 60.7% of the 2025 land drilling rigs market share, servicing mid-depth horizontals across global shale and tight-oil plays. Yet units exceeding 1,500 HP are rising fastest, growing at 1.0% CAGR as deeper laterals and higher mud weights become common in Wolfcamp, Bone Spring, and Jafurah wells. Nabors achieved USD 32,000-35,000 day rates for high-HP rigs in 2025, a USD 6,000-8,000 uplift over mid-range machines.
Sub-1,000 HP rigs are sliding toward workover niches as horizontal drilling becomes the norm. The super-spec segment’s USD 25-30 million build cost deters speculative orders, sustaining supply tightness even when overall market growth is sluggish. Geothermal pilots such as Fervo’s Nevada project, which used 1,500 HP rigs to punch through 4,000-meter granite, illustrate crossover demand that further supports premium day rates.
By Application:
Hydrogen Disrupts Conventional DominanceConventional oil maintained 69.3% of the 2025 land drilling rigs market size, underpinning mature fields in the Middle East and the Americas. Unconventional shale and tight plays added nearly 25% of volume, but the stand-out growth story is natural-hydrogen drilling, advancing at 15.5% CAGR from a tiny base. HyTerra’s Kansas wells measured 96% H₂, prompting a USD 25 million appraisal program that could create the first commercial hydrogen wells in North America.
Geothermal remains secondary but rising; enhanced systems and closed-loop concepts together accounted for fewer than 1% of wells in 2025, yet planned licensing in India and Australia hints at a larger 2030 opportunity. Conventional oil’s share is forecast to ease toward 65% by 2031 as hydrogen and geothermal scale, although absolute barrel replacement needs keep the segment numerically large.
Geography Analysis
North America Land Drilling Rig Market
North America produced 49.9% of the 2025 value and is forecast at a modest 0.4% CAGR to 2031. Rig counts eased to 588 in late 2025, but output still climbed 3% thanks to longer laterals and faster cycle times. ExxonMobil’s USD 60 billion Pioneer acquisition unlocked larger contiguous pads, enhancing capital efficiency. Canada’s seasonal fleet reached 181 rigs, yet spring breakup still sidelines equipment for up to two months each year, tempering utilization swings. Natural-hydrogen spuds in Kansas and Colorado, plus geothermal wells in Nevada, provide emerging diversification, though volumes remain modest relative to oil.
MEA Land Drilling Rig Market
The Middle East and Africa posted the steadiest outlook with a 0.6% CAGR, aided by state funding and sub-USD 30 breakevens. ADNOC Drilling scaled to 118 rigs, entering Kuwait and Saudi Arabia under multiyear contracts backed by performance tariffs. Saudi Aramco’s USD 7 billion onshore program targets 200 TCF of Jafurah gas, requiring high-torque rigs tailored for 10,000-psi formations. Libya plans 20 land rigs to restore 1.5 million barrels per day, although progress depends on political stability. Algeria’s 120-well plan for 2026 signals renewed Saharan gas drilling after years of underinvestment.
Europe, APAC and South America Land Drilling Rig Market
Asia-Pacific is the fastest-growing region at 1.3% CAGR, yet from a smaller base. India issued 13 geothermal blocks targeting the Cambay and Godavari basins with temperatures above 200 °C. Australia’s Cooper Basin tight-gas projects employ automated rigs to mitigate labor scarcity. Indonesia’s frontier exploration faces permitting delays, while China’s COSL trials electric rigs in the Tarim Basin as part of methane-cutting goals. South America’s 0.5% CAGR hinges on Vaca Muerta, whose 500,000 barrels per day output lifted regional demand despite Brazil focusing offshore. Europe remains constrained by fracturing bans, though Turkey and Romania sustain modest drilling in mature onshore licenses.
Regulatory Landscape
Regulation affecting land drilling activity is increasingly shaped by emissions controls and federal land administration, which in turn affects rig specifications, permitting cadence, and operating practices. In the United States, the Environmental Protection Agency (EPA) issued a 2026 final action making technical changes to Clean Air Act requirements tied to flare-related provisions and monitoring expectations in oil and natural gas operations, reinforcing the push toward lower-emission rig packages (for example, dual-fuel engines and related controls). On federal and Indian leases, the Bureau of Land Management (BLM) continues to govern drilling operations via 43 CFR Part 3170 (Subpart 3172), covering well control, casing and cementing, mud programs, and abandonment requirements, with amendments noted as recent as May 2026.
Outside North America, equipment compliance requirements are also tightening through standards adoption. In China, the GB/T 30216-2025 national standard for mobile drilling rigs, published in late 2025, entered implementation on May 1, 2026, creating a clearer compliance milestone for manufacturers and contractors supplying mobile land rigs into the country. In parallel, U.S. federal agencies continued rulemaking activity in early 2026 affecting lease administration and related approvals (for example, BLM proposals around production commingling and U.S. Forest Service updates to processes for oil and gas leasing on National Forest System lands), adding administrative requirements that can influence operator timing and contractor utilization on public lands.
Competitive Landscape
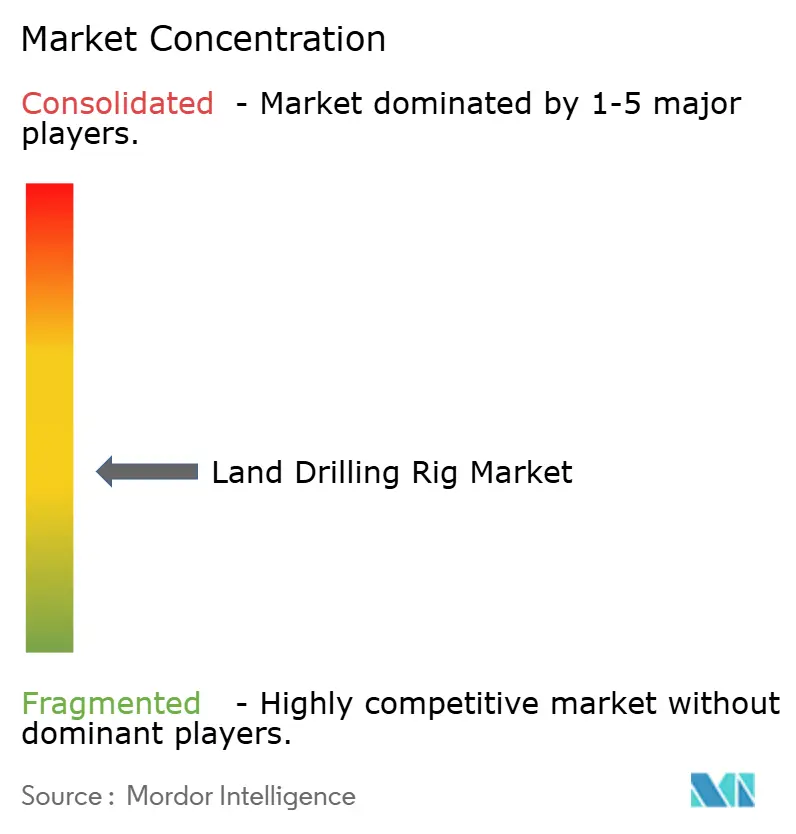
Moderate concentration characterizes the land drilling rigs market, with the top five players controlling roughly 45% of active rigs. Patterson-UTI’s merger with NexTier in November 2024 created the second-largest North American land driller, combining 370 rigs and 300,000 hydraulic horsepower, and retiring 40 aging units to tighten super-spec supply. Helmerich & Payne maintains a homogeneous 219-rig FlexRig fleet that lowers training and maintenance spend by 10-15% versus mixed fleets, underpinning consistently high utilization. Nabors increasingly monetizes its SmartROS automation platform, booking USD 45 million in 2024 software revenue as it licenses technology to third-party contractors.
White-space opportunities emerge in geothermal, where Fervo’s 400-well Nevada project showcased scalability using conventional rigs, pointing to a USD 2-3 billion addressable segment by 2030 if additional capacity materializes. ADNOC Drilling earmarked USD 1.5 billion for 20 new super-spec rigs destined for Saudi Arabia and Iraq, signaling that regional consolidation could mirror North America’s scale economics. Smaller U.S. contractors pivot either to shallow workover services or exit entirely as super-spec capex hurdles mount. Technology adoption remains the main differentiator: rigs with automation and Tier 4 dual-fuel engines command USD 3,000-5,000 dayrate premiums, while mechanical fleets face erosion under tightening emissions regimes.
Land Drilling Rig Industry Leaders
-
Nabors Industries
-
Helmerich & Payne
-
Patterson-UTI
-
Precision Drilling
-
China Oilfield Services (COSL)
- *Disclaimer: Major Players sorted in no particular order
Land Drilling Rig Market Companies Covered in this Report
- Nabors Industries Ltd
- Helmerich & Payne Inc
- Patterson-UTI Energy Inc
- Precision Drilling Corp
- Schlumberger Ltd
- Weatherford International PLC
- Ensign Energy Services Inc
- KCA Deutag
- ADNOC Drilling
- China Oilfield Services Ltd (COSL)
- Sinopec Zhongyuan Petroleum Eng.
- Borr Drilling Ltd
- Saipem SpA
- Kuwait Drilling Company
- Valaris Ltd
- ADES Holding
- Independence Contract Drilling
- Cactus Drilling
- Honghua Group Ltd
- Nabors Saudi Arabia
Market Opportunities and Future Outlook
White space in the market centers on upgrading and redeploying fleets toward higher-spec, lower-emission, and more automated land rigs that reduce personnel exposure and improve repeatability on pad drilling and complex wells. Contractor offerings that combine automation, remote monitoring, and outcome-based performance incentives are gaining traction as operators seek shorter spud-to-TD cycles and more consistent drilling performance, supporting demand for super-spec assets with robotic pipe handling, advanced power management (including hybrid electric and gas-capable systems), and fit-for-purpose controls for emissions compliance.
Opportunities are also emerging from cross-border redeployment of high-spec land rigs into unconventional growth basins and NOC-backed programs. In Argentina, market activity continues to formalize around multi-year, high-spec deployments into Vaca Muerta, including Archer commencing operations in June 2026 of the first of three super-spec rigs equipped with managed pressure drilling (MPD) technology under a YPF contract, highlighting a premium niche for rigs configured for tight-window drilling. In the Middle East, ADNOC Drilling delivered an AI-enabled, fully automated walking island rig (AD-300) in July 2026, underscoring continued investment in automation-led drilling systems that can be adapted to demanding operating environments and tight logistics, and reinforcing a pathway for land drilling contractors to differentiate through software, controls, and integrated services rather than hardware alone.
Recent Industry Developments in Land Drilling Rig Market
- February 2026: Helmerich & Payne said its Turan Drilling and Engineering Company LLC joint venture secured a long-term contract renewal from bp in the Caspian Sea, effective March 2026, with a firm duration of five years and potential value exceeding USD 1 billion. While offshore in execution, the award highlights operators preference for long-duration, performance-oriented contracts and reinforces how scale contractors use JV structures to lock in multi-year utilization and service intensity.
- November 2025: Nabors reported its SANAD Drilling joint venture received notices to resume work for two rigs, with returns to service scheduled for March 2026 and June 2026. The restart supports regional utilization recovery and underscores how contractor exposure to NOC-linked programs can stabilize rig activity through multi-rig reactivations and structured work resumption.
- February 2024: Helmerich & Payne announced finalization of contractual terms with Saudi Aramco for a recent seven-rig unconventional gas award. The agreement points to continued Middle East demand for high-spec drilling capacity aligned with unconventional gas development and adds visibility on multi-rig contracting structures that can sustain super-spec equipment and crew deployments across longer programs.
Land Drilling Rig Market Report Scope and Research Methodology
Market Definition and Coverage
This market is defined as revenues generated from land based drilling rigs and their core rig systems used to drill wells onshore, including rigs deployed for oil, gas, and other land drilling uses where a drilling rig is the primary asset.
Scope exclusions: The scope excludes offshore rigs and related offshore drilling systems, and it also excludes downstream processing equipment that is not part of the drilling rig.
Segments Covered in This Report
- By Rig Type
- Conventional
- Mobile/Wheel-Mounted
- Walking Super-Spec
- By Drive System
- Mechanical
- Electric (SCR and AC)
- Hybrid/Compound
- By Horsepower Rating
- Up to 1,000 HP
- 1,000 to 1,499 HP
- Above 1,500 HP
- By Application
- Conventional Oil
- Unconventional/Tight and Shale
- Geothermal
- Emerging Natural-Hydrogen
- By Geography
- North America
- United States
- Canada
- Mexico
- Europe
- Turkey
- Romania
- Ukraine
- France
- Spain
- Rest of Europe
- Asia-Pacific
- India
- Australia
- ASEAN Countries
- Rest of Asia-Pacific
- South America
- Brazil
- Argentina
- Colombia
- Rest of South America
- Middle East and Africa
- Saudi Arabia
- United Arab Emirates
- Oman
- Kuwait
- Iraq
- Algeria
- Libya
- Nigeria
- Rest of Middle East and Africa
- North America
Data Sources, Market Sizing, and Validation
Desk Research
We started with public data that anchors the drilling activity cycle and the onshore equipment context. For this, we relied on U.S. Energy Information Administration indicators for drilling and production activity, U.S. Bureau of Labor Statistics cost trends that influence labor inputs and rig day rates, and U.S. Geological Survey references tied to drilling related activity in energy and minerals.
To make the data workable for market sizing, we also used investor presentations, annual reports, and earnings call transcripts to track utilization, fleet changes, and the way operators discuss pricing. In parallel, we reviewed trade association updates and reputable industry press that report rig count movements, well activity, and technology shifts, including high spec walking rigs. For consistency checks, we used select paid subscriptions for company financials and intelligence, news and financials, and patent databases. The sources named above are illustrative, and we also used additional public references to collect, validate, and clarify inputs.
Primary Interviews and Surveys
Our estimates were cross-checked through expert interviews and structured surveys with rig owners, drilling contractors, OEM and component participants, and service partners that influence deployment decisions. Because this is a global market, we balanced conversations across key producing basins and active drilling regions so that utilization patterns, pricing behavior, and replacement cycles could be validated and then mapped back into the model assumptions.
Distribution of primary research fieldwork respondents
| Company type | Respondent position | Region |
|---|---|---|
| Top tier: 35% | CXOs: 12% | APAC: 38% |
| Mid tier: 48% | Functional/Unit leaders: 28% | EMEA: 36% |
| Smaller Players: 17% | Managers: 60% | Americas: 26% |
Market-Sizing & Forecasting
For the main build, we used a top-down approach where drilling activity signals and fleet economics were used to reconstruct the onshore rig revenue pool by region, then split it into the common rig configurations used on land. Once the demand pool was formed, we translated it into value using practical pricing logic that reflects utilization and the mix of higher horsepower rigs.
To keep the model grounded, we corroborated totals with selective bottom-up checks, including sampled contractor revenue reviews, targeted supplier and channel checks, and volume versus average pricing sanity tests (ASP times active rig footprint). The inputs that drove the results most were onshore rig count and rig utilization trends, average day rate movements, horsepower mix shifts (up to 1,000 HP, 1,000 to 1,499 HP, and above 1,500 HP), the share of walking super-spec rigs versus conventional units, and application mix across conventional oil, unconventional/tight and shale, and geothermal.
Forecasts were built using scenario analysis supported by near-term activity expectations captured from industry experts, and then tied back to macro variables that steer drilling plans, including oil and gas price assumptions, upstream capex intent, and regional policy or permitting changes. Where bottom-up detail was thin for smaller geographies, we used proxy indicators such as regional rig activity share and typical pricing bands, followed by a second pass adjustment after primary feedback.
Data Validation & Update Cycle
We validate the outputs by triangulating model totals against independent signals, then running variance checks across regions, rig classes, and application splits to flag any unrealistic jumps. If a number appears off relative to the underlying activity signals, we revisit the inputs, re-run the logic, and schedule follow-up calls with respondents who can explain the change, which helps limit assumption drift.
Before sign-off, the work is reviewed in multiple steps by analysts who did not build the first draft, and any anomalies are documented with the reason for adjustment. Reports are refreshed annually, and interim updates are made when material events occur, such as sharp drilling activity shifts or major fleet additions and retirements. Right before delivery, an analyst performs a fresh pass so the client output reflects the latest update to the operating view.
Mordor Intelligence's Land Drilling Rig Market Size Compared Against Other Published Estimates
Published market sizes for land drilling rigs can vary more than expected, even when the topic appears identical on the surface. The differences usually come from how each publisher defines what counts as rig revenue, which years they use as the current reference point, and how pricing and utilization are handled in their sizing logic.
Rig count signals, utilization checks, and day rate direction are the evidence points that keep Mordor Intelligence's estimate aligned to the active onshore rig revenue pool, rather than mixing in adjacent oilfield services or broader drilling equipment buckets. Gaps in other estimates often come from adding categories like drilling services spend, using a narrower scope that counts only certain rig types, or applying aggressive pricing ramps without a clear tie-back to regional activity and horsepower mix. Timing also matters, since exchange rate choices and refresh cadence can shift the reported USD value for the same underlying operating reality.
Benchmark comparison
| Source | Market Size | Gaps in Research Methodology |
|---|---|---|
| Mordor Intelligence | USD 62.03 B (2026) | |
| Global Publisher A | USD 40.85 B (2025) | This estimate appears to use a different base year and may apply a tighter revenue boundary around land drill rigs, which can undercount parts of the installed base when utilization and pricing vary sharply by region and rig class. |
| Industry Publisher B | USD 8.20 B (2024) | The number is much smaller, which usually indicates a narrow scope such as counting only a subset of rig types or only specific applications, and it may exclude broader rig revenue components captured in a full land rig market definition. |
The table shows that year selection and scope boundary decisions explain most of the spread, followed by how pricing is updated across regions. When activity indicators and mix variables are explicitly tracked and then re-checked with field inputs, the final total is easier to reproduce and stress test across cycles, which is what most buyers need for planning.
Key Questions Answered in the Report
How large is the land drilling rigs market in 2026?
The land drilling rigs market size is estimated at USD 62.03 billion for 2026.
What is the projected CAGR for land drilling rigs through 2031?
The market is forecast to expand at a 0.43% CAGR between 2026 and 2031.
Which rig type is growing fastest?
Walking super-spec platforms are the fastest, advancing at a 0.8% CAGR due to pad-drilling efficiencies.
Which region shows the highest growth rate?
Asia-Pacific leads with a 1.3% CAGR, propelled by geothermal and unconventional gas initiatives.
What technology trends shape future rig demand?
High-horsepower electric rigs with automation and dual-fuel engines are commanding dayrate premiums and driving fleet upgrades.
How is natural hydrogen influencing drilling activity?
Natural-hydrogen programs, although nascent, are expanding at 15.5% CAGR as explorers validate high-purity reservoirs in Kansas, Mali, and Australia.