
Market Overview
| Study Period | 2020 - 2031 |
|---|---|
| Forecast Data Period | 2026 - 2031 |
| Base Year Market Size (2025) | USD 8.97 Billion |
| Market Size (2026) | USD 9.39 Billion |
| Market Size (2031) | USD 11.82 Billion |
| Growth Rate (2026 - 2031) | 4.72 % |
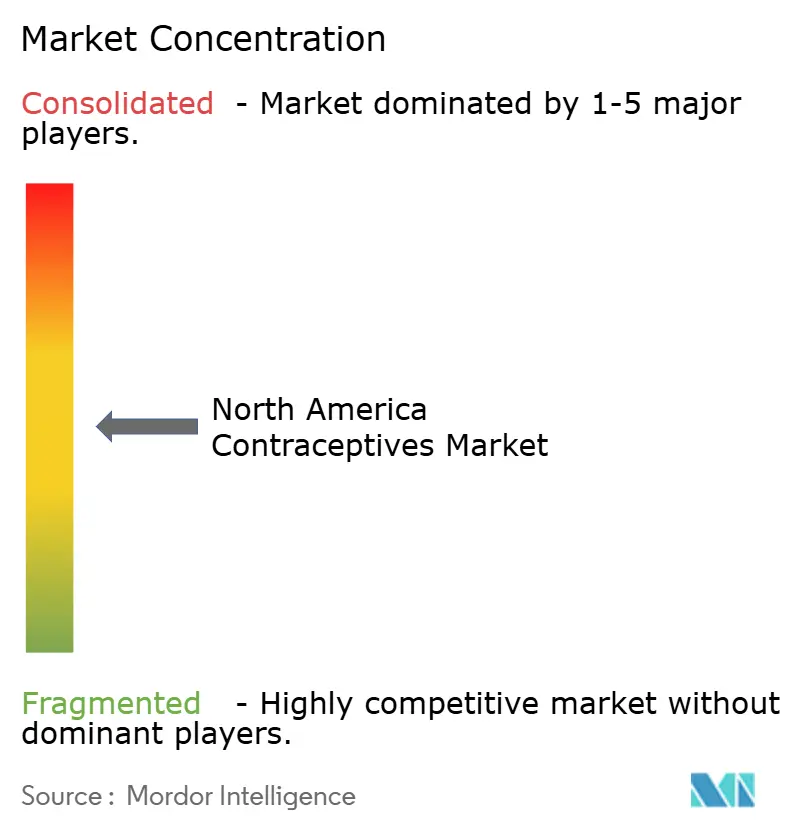
| Market Concentration | Medium |
Major Players *Disclaimer: Major Players sorted in no particular order Image © Mordor Intelligence. Reuse requires attribution under CC BY 4.0. | |
North America Contraceptives Market Analysis by Mordor Intelligence
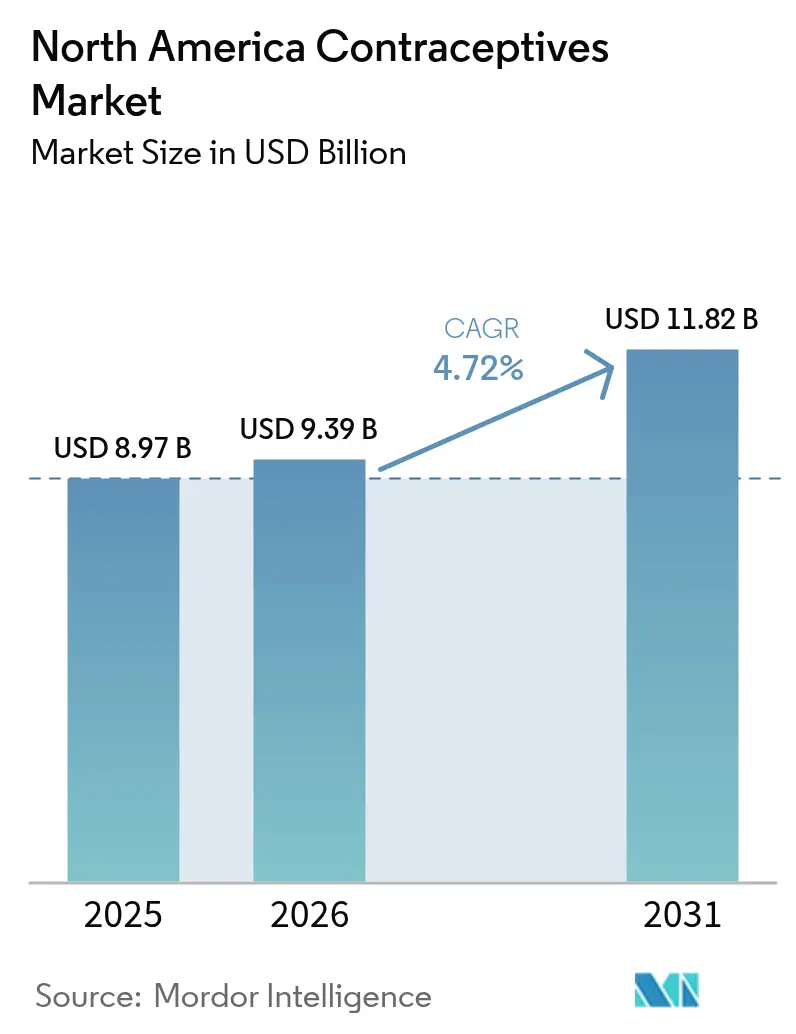
The North America contraceptive market size is expected to grow from USD 8.97 billion in 2025 to USD 9.39 billion in 2026 and is forecast to reach USD 11.82 billion by 2031 at 4.72% CAGR over 2026-2031. Growing regulatory support for over-the-counter products, wider digital-health integration, and persistent demand for long-acting reversible contraception are sustaining expansion despite legislative headwinds in parts of the United States.[1]U.S. Food and Drug Administration, “FDA Approves First Nonprescription Daily Oral Contraceptive,” fda.gov Consumers are shifting toward device-based options that avoid hormones, while insurers and public programs continue to prioritize cost-effective methods that lower unintended-pregnancy rates. Meanwhile, venture funding in male methods and AI-driven cycle-tracking applications is reshaping competitive strategies and enlarging the total addressable population. Across Canada and Mexico, universal-coverage initiatives and maternal-mortality targets are accelerating uptake, providing fresh growth channels for established and emerging brands.[2]World Health Organization, “Mexico,” who.int
Key Report Takeaways
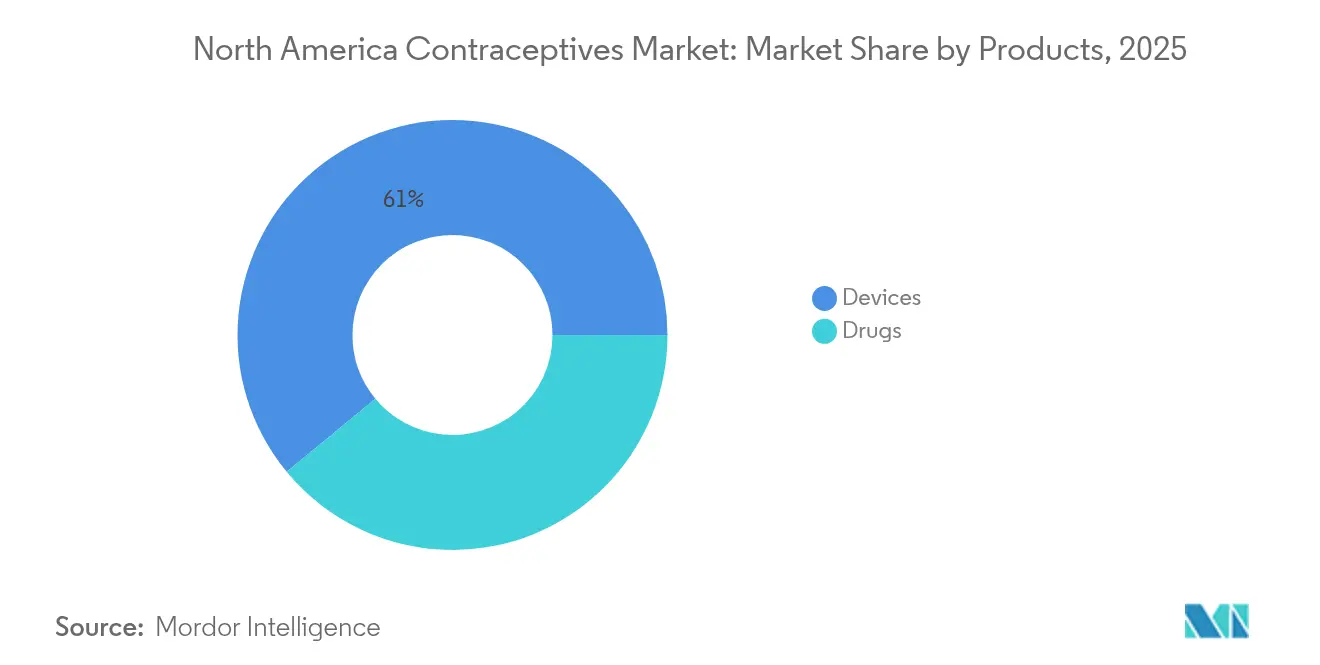
- By product type, Devices held 60.98% of 2025 revenue, while pharmaceutical methods are set to grow the fastest at a 5.41% CAGR through 2031.
- By gender, Female-focused products captured an 86.95% share in 2025; the male segment is advancing at a 5.92% CAGR to 2031 as pipeline candidates progress.
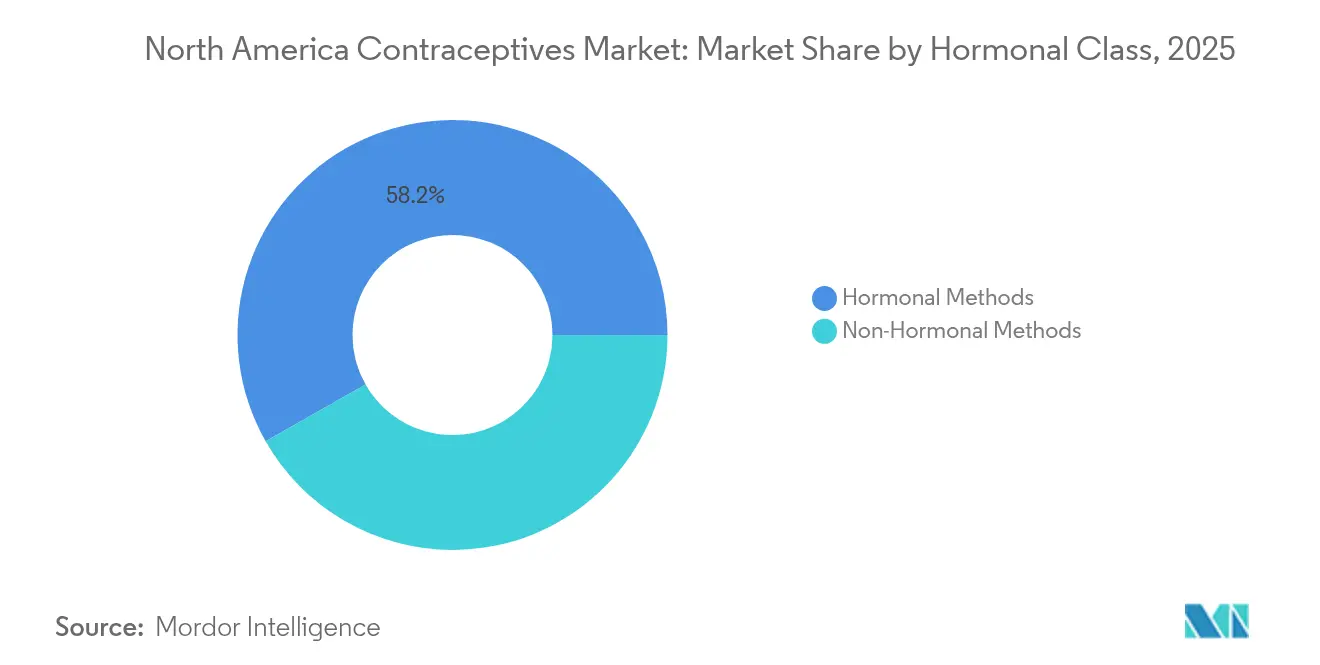
- By hormonal class, Hormonal options commanded a 58.23% share in 2025, whereas non-hormonal methods led growth at a 5.74% CAGR through 2031.
- By geography, the United States accounted for 84.02% of sales in 2025; Mexico is the fastest-growing market, forecast at a 5.96% CAGR to 2031.
Note: Market size and forecast figures in this report are generated using Mordor Intelligence’s proprietary estimation framework, updated with the latest available data and insights as of 2026.
Market Trends and Insights
Drivers Impact Analysis of North America Contraceptives Market*
| Driver | (~) % Impact on CAGR Forecast | Geographic Relevance | Impact Timeline |
|---|---|---|---|
| Regulatory approval for over-the-counter hormonal pills | +1.0% | United States; spillover to Canada | Short term (≤2 years) |
| Expanded Title X & Medicaid contraception budgets | +0.7% | United States (state variation) | Medium term (2-4 years) |
| Rising STI incidence boosts condom & LARC demand | +0.5% | Urban North America | Medium term (2-4 years) |
| Employer-backed telehealth benefits | +0.4% | United States, Canada | Short term (≤2 years) |
| Venture-funded male-method pipeline | +0.3% | United States; trials extend to Canada | Long term (≥4 years) |
| AI-powered cycle-tracking apps | +0.3% | United States, Canada | Medium term (2-4 years) |
| Source: Mordor Intelligence | |||
Regulatory approval for OTC hormonal pills
The FDA clearance of Opill in 2023 significantly broadened access by removing prescription barriers, prompting insurers to debate zero-cost coverage and nudging manufacturers to re-evaluate pricing levers.[1]U.S. Food and Drug Administration, “FDA Approves First Nonprescription Daily Oral Contraceptive,” fda.gov Early sales data indicate incremental users rather than simple cannibalization, pointing to net market expansion.
Expanded Title X and Medicaid contraception budgets
Federal spending of USD 286.5 million for FY 2025 underpins safety-net clinics serving 2.8 million clients, though political uncertainty keeps providers cautious about long-term investments. Where funding is stable, private firms seize opportunities to partner with public programs.
Rising STI incidence boosts condom & LARC demand
CDC surveillance recorded 2.4 million reportable STI cases in 2023, spurring dual-protection counseling and anchoring condoms as an essential complement to LARCs.[3]Centers for Disease Control and Prevention, “National Overview of STIs in 2023,” cdc.gov The trend is especially pronounced among the 15-24 age group.
Employer-backed telehealth benefits
Digital clinics funded by employer insurance now ship prescriptions to 43 US states, shortening wait times and widening Medicaid reach. Institutional protocols developed at UCSF confirm the staying power of tele-contraception.
Restraints Impact Analysis of North America Contraceptives Market*
| Restraint | (~) % Impact on CAGR Forecast | Geographic Relevance | Impact Timeline |
|---|---|---|---|
| Post-Dobbs state-level legal uncertainty | −1.1% | Restrictive US states | Medium term (2-4 years) |
| Social-media misinformation on hormonal side effects | −0.7% | United States, Canada | Short term (≤2 years) |
| Supply-chain shocks for levonorgestrel IUDs | −0.6% | North America | Short term (≤2 years) |
| Reimbursement caps on advanced LARCs | −0.4% | United States (Medicaid variation) | Medium term (2-4 years) |
| Source: Mordor Intelligence | |||
Post-Dobbs legal uncertainty dampens provider availability
States enforcing abortion restrictions saw 5.6% drops in birth-control prescriptions and clinic closures that limit contraceptive counseling capacity.
Social-media misinformation on hormonal side effects
Viral myths on mood change and infertility have led some users to abandon reliable hormonal options, prompting ACOG to ramp up fact-checking campaigns.
*Our forecasts treat driver/restraint impacts as directional, not additive. The impact forecasts reflect baseline growth, mix effects, and variable interactions.
North America Contraceptives Market Segment Analysis
By Products:
Devices drive market leadershipContraceptive devices held 60.98% of the North America contraceptive market in 2025 on the strength of long-acting IUDs and hormone-free barrier methods. The segment benefits from nonprofit price reductions such as Medicines360’s LILETTA under the 340B program. Condoms retain relevance due to dual-protection needs amid STI spikes.
Pharmaceutical methods, though smaller, are pacing a 5.41% CAGR to 2031. The North America contraceptive market size for pills, patches, and injectables is expanding after OTC approval of Opill, while safety revisions around DMPA reshape prescribing patterns.



By Gender:
Male segment emergence challenges female dominanceFemale-oriented products accounted for 86.95% of the North America contraceptive market share in 2025, reflecting entrenched clinical norms and broad product ranges. New offerings, such as the once-weekly Twirla patch, aim to ease adherence.
The North America contraceptive market sees male methods growing at 5.92% CAGR, catalyzed by Plan A and other non-hormonal candidates that could reach FDA review within three years. Surveys show men are willing to adopt novel reversible options, indicating latent demand.
By Hormonal Class:
Non-hormonal innovation acceleratesHormonal solutions controlled 58.23% of sales in 2025. Decades of safety data and insurance coverage maintain consumer confidence, yet misinformation and emerging safety signals for certain injectables temper growth.
Non-hormonal offerings are on a 5.74% CAGR path as users seek hormone-free alternatives. Candidates such as Ovaprene underline the innovation focus, while copper IUDs stay popular for long-acting, drug-free protection.
Geography Analysis
United States Contraceptives Market
The United States generated 84.02% of 2025 revenue, supported by the world’s largest insurance market and rapid consumer uptake following OTC pill authorization. Yet the post-Dobbs legal patchwork depresses sales in restrictive states, creating uneven channel performance.
Canada Contraceptives Market
Canada’s universal-coverage roadmap, backed by CAD 670 million in federal-provincial funding, positions the country for steady uptake once reimbursement begins in 2026. Pharmacist prescribing launched in British Columbia already logged more than 430,000 assessments, demonstrating demand for decentralized access.
Mexico Contraceptives Market
Mexico is the fastest-growing territory at 5.96% CAGR thanks to WHO-backed maternal-mortality programs and a streamlined COFEPRIS clinical-trial process that invites foreign investment.
Regulatory Landscape
In the United States, contraceptive drugs and devices are governed primarily by the U.S. Food and Drug Administration (FDA) through drug and medical-device regulatory pathways, including postmarket quality requirements. A key 2026 compliance anchor is FDA implementation of the Quality Management System Regulation (QMSR), effective February 2, 2026, which updates device quality system expectations and raises the need for harmonized documentation and audit readiness across manufacturers and suppliers serving condom and IUD/implant portfolios.
In Canada, Health Canada regulates medical devices under the Medical Devices Regulations (SOR/98-282), with added operational requirements in 2026 as the Regulatory Enrolment Process (REP) and Common Electronic Submission Gateway (CESG) became mandatory for most medical device transactions from April 1, 2026. Separately, regulations amending the Medical Devices Regulations related to establishment licenses were published in the Canada Gazette in June 2026, reinforcing licensing and compliance steps for importers, distributors, and manufacturers supplying contraceptive devices into Canadian channels.
Value Chain Analysis
The value chain runs from API and raw-material sourcing (hormonal actives and specialty materials such as copper and nitinol) through formulation and device manufacturing, regulatory release, and distribution via national wholesalers, retail pharmacies, hospital or clinic procurement, and expanding direct-to-consumer and telehealth fulfillment models. Upstream concentration in single-source APIs and specialized device components can raise exposure to disruptions, and the report scope already highlights levonorgestrel IUD supply-chain shocks as a near-term restraint for North America.
Downstream, provider access controls and labeling changes can alter channel execution and inventory strategies. Recent FDA actions such as extending NEXPLANON use to up to five years (Organon, January 2026) and an FDA-approved labeled strength update for TWIRLA (Exeltis USA, June 2026) show how lifecycle management affects forecasting, packaging transitions, and counseling intervals at clinics. On the device side, new insertion systems and related training requirements influence adoption at the point of care, while pharmacy-level allocation and localized stock-outs remain practical constraints for oral contraceptives even with broad retail availability.
Competitive Landscape
Legacy manufacturers such as Bayer, Pfizer, and Johnson & Johnson rely on scale and multichannel reach to defend positions, yet face margin pressure from nonprofit price disruptors like Medicines360. Telehealth-centric entrants, exemplified by Twentyeight Health, are winning Medicaid contracts in 43 states and bypassing brick-and-mortar constraints.
Male-method R&D is the new white space: Plan A and other startups are racing to secure pivotal data ahead of anticipated FDA guideline updates for male contraception pathways. Agile Therapeutics’ pivot to e-commerce and high-reimbursement states illustrates how incumbents adapt to fragmented insurance rules.
Technology remains the defining battleground; firms integrating AI analytics, wearable sensors, and same-day delivery stand to capture loyalty as consumers expect seamless experiences. Those able to navigate varying state laws while scaling digital services will likely out-pace slower, compliance-burdened rivals.
North America Contraceptives Industry Leaders
Bayer AG
Teva Pharmaceuticals Ltd
Pfizer
Cooper Surgical
Reckitt Benckiser Group plc
- *Disclaimer: Major Players sorted in no particular order
North America Contraceptives Market Companies Covered in this Report
- Bayer
- Pfizer
- Insud Pharma
- Teva Pharmaceutical Industries
- Agile Therapeutics Inc.
- The Cooper Companies
- Organon
- Evofem Biosciences Inc.
- Church & Dwight
- Reckitt Benckiser Group
- Johnson & Johnson
- Abbvie
- Mayer Laboratories
- Femcap Inc.
- Amneal Pharmaceuticals
- Karex Berhad
- Cadence Health Inc.
- HRA Pharma
- Mayer Laboratories

Market Opportunities and Future Outlook
Long-acting and differentiated device offerings that improve user experience and reduce replacement frequency present a concrete opportunity. FDA approval extending NEXPLANON to up to five years (January 2026) supports the clinical and economic case for implants in payer and provider protocols, while also increasing the emphasis on standardized insertion and removal practices through REMS-linked controls. In parallel, IUD usability improvements continue to shape adoption, supported by CooperSurgical's launch of a new single-hand Paragard inserter (September 2024), which targets easier placement and workflow fit in high-throughput clinics.
Hormone-free and patient-controlled formats also represent a viable whitespace, supported by active company programs and late-stage evidence. Daré Bioscience reported positive interim Phase 3 results for Ovaprene (May 2026), indicating momentum for monthly, non-hormonal intravaginal contraception, and Organon completed a licensing agreement for Sebela's MIUDELLA hormone-free copper IUD (June 2026), which creates a new device option for late-2026 commercialization. In Canada, product access initiatives and channel modernization create room for additional launches, highlighted by Duchesnay introducing PrRingza, a reusable, year-long contraceptive vaginal system (April 2026), which fits pharmacy and clinician demand for longer-duration, patient-managed options.
Recent Industry Developments in North America Contraceptives Market
- July 2026: Bayer entered a strategic agreement to secure 3.0 billion euros in equity capital from Apollo Global Management for a minority, non-controlling stake in a newly established entity containing Bayer's long-acting reversible contraceptives business (including Mirena, Kyleena, Jaydess, Skyla, and Jadelle). Bayer retained majority ownership and operational control, with closing targeted for Q3 2026. The agreement supports capital flexibility while keeping a major North American LARC franchise positioned for continued investment and supply continuity.
- December 2025: Bayer initiated the Phase III SUNFLOWER clinical study of its 52 mg levonorgestrel-releasing intrauterine system, Mirena, for treatment of nonatypical endometrial hyperplasia. Although outside contraception-only labeling, the program expands clinical evidence and can reinforce prescriber familiarity with LNG-IUS use in gynecology. The added trial activity also increases the focus on manufacturing and pharmacovigilance readiness for a high-volume intrauterine platform.
- September 2024: CooperSurgical launched Paragard with a new single-hand inserter following FDA approval. The updated placement system is designed to simplify IUD insertion procedures in office settings. Easier placement can support provider adoption and patient throughput, reinforcing competitive differentiation in the copper IUD segment.


North America Contraceptives Market Report Scope and Research Methodology
Market Definition and Coverage
For this study, the market is defined as the value of contraceptive drugs and devices sold for pregnancy prevention and dual protection across the United States, Canada, and Mexico, measured in current USD.
Scope exclusions: Fertility-tracking apps, surgical sterilization procedures, and abortifacients are excluded from the market value.
Segments Covered in This Report
- By Products
- Drugs
- Oral Contraceptives
- Topical Contraceptives
- Contraceptive Injectables
- Devices
- Condoms
- Diaphragms
- Cervical Caps
- Sponges
- Vaginal Rings
- Intrauterine Devices
- Other Devices
- Drugs
- By Gender
- Male
- Female
- By Hormonal Class
- Hormonal Methods
- Non-Hormonal Methods
- Geography
- United States
- Canada
- Mexico
Data Sources, Market Sizing, and Validation
Desk Research
To set the base structure of the model, we first compiled publicly available health, demographic, and access indicators that influence contraceptive uptake and mix. Common inputs came from sources such as the CDC and other public health dashboards, UN demographic tables, national statistics agencies for population by age and sex, and peer-reviewed journals on method continuation and failure rates.
Next, the market framing was cross-checked using manufacturer annual reports, investor presentations, product labeling and approvals on regulator websites, and reputable healthcare press coverage. Where available, paid subscriptions for company financials and news were used to align revenue timing and to flag one-time items that can distort a single year. These desk sources are not exhaustive, and we used additional public references to collect, validate, and clarify assumptions.
Primary Interviews and Surveys
After the desk model was drafted, we validated key assumptions through expert interviews and structured surveys with stakeholders across brands, distributors, clinicians, and payer-adjacent roles. For a North America scope, the coverage was balanced across the United States, Canada, and Mexico so that pricing, reimbursement exposure, and channel mix differences could be captured and then translated back into the model.
Distribution of primary research fieldwork respondents
| Company type | Respondent position |
|---|---|
| Top tier: 31% | CXOs: 13% |
| Mid tier: 55% | Functional/Unit leaders: 37% |
| Smaller Players: 14% | Managers: 50% |
Market-Sizing & Forecasting
The market size was built using a top-down demand pool approach, where population cohorts and contraceptive prevalence are translated into users by method, and then valued using typical annualized consumption and price ranges by country. To keep totals realistic, the outputs were corroborated using selective bottom-up checks such as sampled volume times average selling price by product class, and limited supplier revenue roll-ups where public disclosures were clear.
Key model inputs included women of reproductive age by country, contraceptive prevalence and method mix, the share of prescriptions versus over-the-counter purchases, average unit usage patterns (for example, cycles per year for oral methods), and country-level pricing and reimbursement exposure that shifts net realized values. For forecasting, we relied on scenario-based analysis supported by expert views on uptake of long-acting reversible methods, policy and access changes, and expected price progression, then selected the central case after reviewing variance across scenarios. When bottom-up signals were incomplete for smaller channels, we filled gaps through conservative share allocation anchored to utilization indicators, and then reviewed those allocations again during validation.
Data Validation & Update Cycle
Model outputs were triangulated against independent signals such as shipment and import-export patterns, disclosed category revenues, and utilization statistics, and then stress-tested for year-over-year jumps that did not match known events. Any outliers triggered a second review of the underlying inputs, followed by targeted re-contact with interviewees when the mismatch could not be explained through desk evidence.
Before sign-off, the work goes through multiple analyst reviews that check arithmetic logic, scope alignment, and country splits, and then the final market value is confirmed against the defined inclusions and exclusions. Reports are refreshed annually, with interim updates when material policy changes, major approvals, or supply disruptions occur, and a fresh pre-delivery pass is completed so the view reflects the latest available information.
Mordor Intelligence's North America Contraceptives Market Estimate Compared With Other Published Estimates
Published market sizes for North America contraceptives often differ, even when the topic name looks similar, because each estimate can use a different product boundary, year definition, and pricing treatment. In our checks, the biggest swings usually come from whether the scope includes digital fertility tools or sterilization services, how OTC volumes are captured, and whether reported values reflect gross list prices or a closer net realization.
By tracking inclusion rules and refresh timing, Mordor Intelligence keeps the estimate tied to contraceptive drugs and devices only (excluding fertility apps, sterilization, and abortifacients) and then checks totals against prevalence-driven demand pools before the final value is published.
Benchmark comparison
| Source | Market Size | Gaps in Research Methodology |
|---|---|---|
| Mordor Intelligence | USD 8.97 B (2025) | |
| Industry Databook A | USD 9.58 B (2024) | Uses a 2024 base year and a product split that can pull more value into the year through different price timing, and the scope description tends to be broader around drugs and devices without clearly stating exclusions like sterilization or digital tools. |
| Regional Publisher B | USD 8.30 B (2024) | Anchors the series in 2024 and applies a higher-growth trajectory, which can reflect more aggressive adoption and pricing assumptions, while country coverage wording can vary (for example, grouping parts of the region as a residual bucket). |
The table shows that differences are largely explainable once the year, inclusions, and pricing basis are lined up consistently. When the market is limited to drugs and devices and then reconciled to demand indicators like prevalence and method mix, the resulting value is easier to reproduce and to track over time for planning decisions.


Key Questions Answered in the Report
What is the current value of the North America contraceptive market?
The market generated USD 9.39 billion in 2026 and is projected to climb to USD 11.82 billion by 2031.
Which product category holds the largest share?
Devices such as IUDs and condoms led with 60.98% revenue share in 2025.
How will male contraceptives influence growth?
Male methods are forecast to grow at 5.92% CAGR, supported by new non-hormonal technologies now in clinical trials.
Why are digital platforms important to contraceptive access?
Telehealth and AI-driven apps shorten wait times and personalize choices, expanding reach especially in rural areas
What regulatory change most strongly affects market dynamics?
The FDA’s over-the-counter approval of Opill removed prescription barriers and is expected to add 1.0% to the market’s CAGR.
Which country in North America is growing the fastest
Mexico shows the highest forecast growth at 5.96% CAGR through 2031, buoyed by WHO-supported maternal-health programs.
Page last updated on:





