Market Overview
| Study Period | 2020 - 2031 |
|---|---|
| Forecast Data Period | 2026 - 2031 |
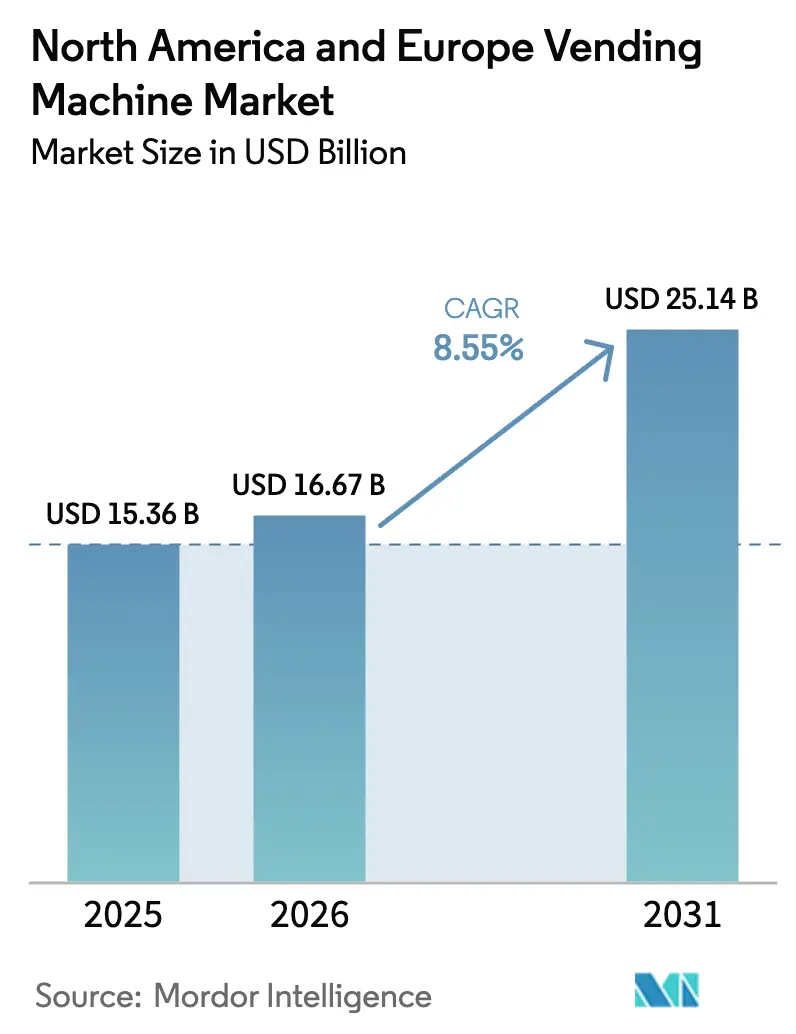
| Base Year Market Size (2025) | USD 15.36 Billion |
| Market Size (2026) | USD 16.67 Billion |
| Market Size (2031) | USD 25.14 Billion |
| Growth Rate (2026 - 2031) | 8.55% CAGR |
| Market Concentration | Medium |
Major Players *Disclaimer: Major Players sorted in no particular order Image © Mordor Intelligence. Reuse requires attribution under CC BY 4.0. | |
North America And Europe Vending Machine Market Analysis by Mordor Intelligence
The North America and Europe vending machine market size is expected to grow from USD 15.36 billion in 2025 to USD 16.67 billion in 2026 and is forecast to reach USD 25.14 billion by 2031 at 8.55% CAGR over 2026-2031. Accelerated adoption of cashless payments, growth in fresh-food merchandising, and real-time telemetry are reshaping the vending ecosystem into a data-rich retail channel. Beverage machines retained revenue leadership with 46.12% share in 2024, yet food and snack units are expanding faster, supported by cold-chain upgrades and AI-guided planograms. Offices remain the densest installation cluster, but transit hubs are gaining priority as airports and metros seek contact-free retail that serves commuters quickly. Cash usage is receding, falling to 58.32% of 2024 transactions, while mobile wallets and QR codes climb on the back of declining cash circulation in Germany and EU policy pressure for digital micro-payments. Operators continue to weigh retrofit costs against telemetry gains; nonetheless, smart machines are forecast to outpace the broader North America and Europe vending machine market through 2030.
Key Report Takeaways
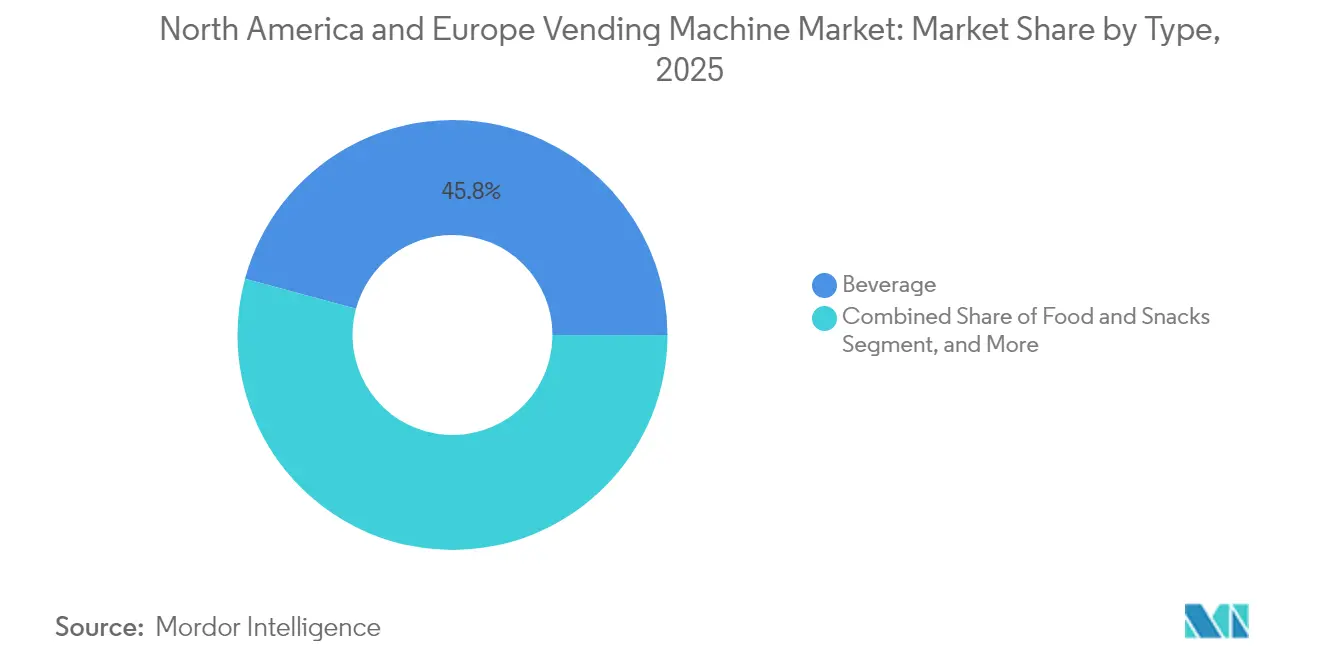
- By product type, beverage machines led with 45.78% revenue share in 2025; food and snacks are projected to post a 9.02% CAGR to 2031.
- By location, office and commercial buildings accounted for 36.72% of installations in 2025, while transportation facilities are poised to expand at an 8.31% CAGR through 2031.
- By payment mode, cash retained 57.89% share in 2025, yet mobile wallet and QR-code transactions will rise at a 12.78% CAGR to 2031.
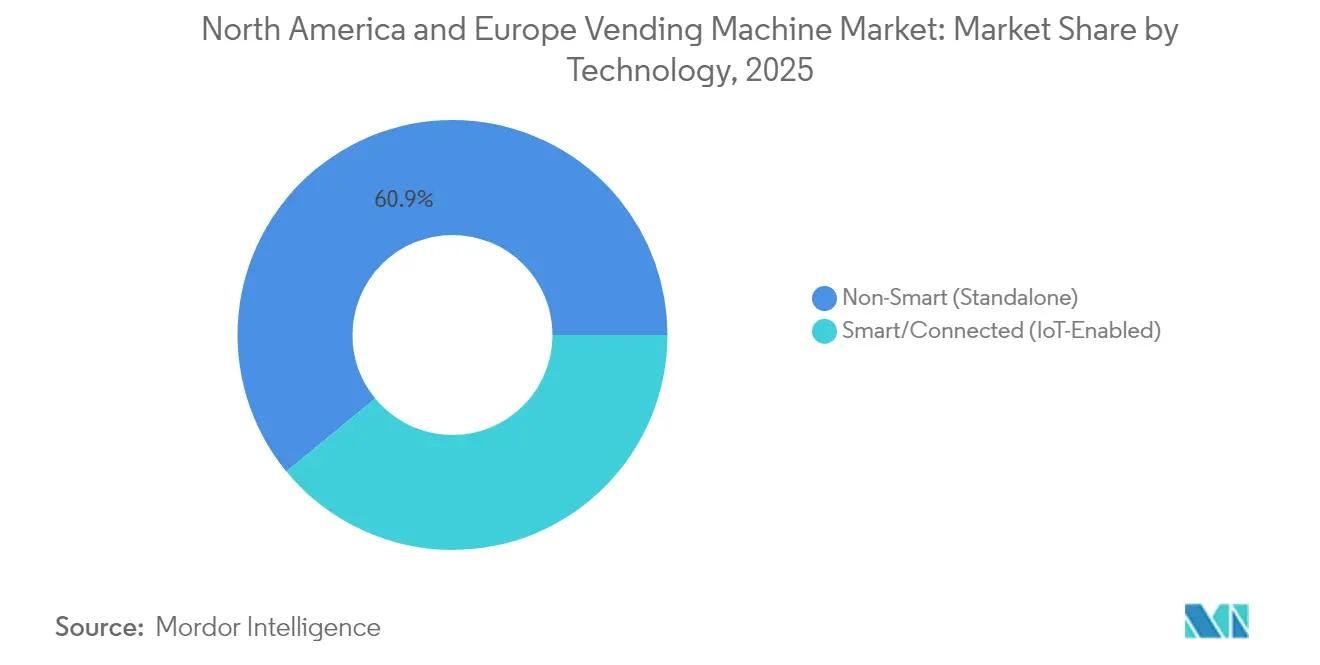
- By technology, non-smart units comprised 60.94% of the installed base in 2025, whereas smart or IoT-enabled machines will advance at a 15.26% CAGR.
- By end-use industry, corporate workspaces held 30.12% revenue share in 2025; healthcare is set to grow at a 10.57% CAGR through 2031.
Note: Market size and forecast figures in this report are generated using Mordor Intelligence’s proprietary estimation framework, updated with the latest available data and insights as of 2026.
North America And Europe Vending Machine Market Trends and Insights
Drivers Impact Analysis*
| Driver | (~) % Impact on CAGR Forecast | Geographic Relevance | Impact Timeline |
|---|---|---|---|
| Cashless Micro-Payments Integration Accelerating Unit Economics | +1.8% | Germany, United Kingdom, Nordics | Short term (≤ 2 years) |
| Rising Demand for Contact-Free Retail Experiences | +1.5% | North America and EU transit hubs | Medium term (2-4 years) |
| Expansion of Fresh-Food Vending in Transport Hubs | +1.3% | United States airports, EU rail terminals | Medium term (2-4 years) |
| AI-Powered Planogram Optimisation and Dynamic Pricing | +1.2% | North America corporate campuses, EU smart cities | Long term (≥ 4 years) |
| Workplace Well-Being Initiatives Driving Healthy-Snack Offerings | +0.9% | North America and Western Europe | Medium term (2-4 years) |
| Government Incentives for Energy-Efficient Refrigeration | +0.7% | EU and United States | Long term (≥ 4 years) |
| Source: Mordor Intelligence | |||
Cashless Micro-Payments Integration Accelerating Unit Economics
Vending operators that fitted contactless readers and mobile-wallet acceptance achieved a 77% cashless share in 2024, reducing coin-handling costs and enabling dynamic pricing that lifted average ticket values by up to 18%. Germany illustrates the economics: SECO and BDTA began retrofitting 200,000 tobacco units with girocard terminals, eliminating cash-collection routes that previously absorbed 25% of operating costs.
Rising Demand for Contact-Free Retail Experiences
Touchless interfaces introduced during the pandemic are now standard in busy venues. QR-code ordering and voice-activated modules reduce surface-contact complaints and align with hygiene protocols in healthcare and food-service settings.
Expansion of Fresh-Food Vending in Transport Hubs
Farmer’s Fridge surpassed 1,000 airport and transit locations by mid-2024, demonstrating that chef-prepared salads priced at USD 8–12 can triple annual sales per machine versus legacy snack units. Cold-chain compliance and spoilage control remain the primary constraints.
AI-Powered Planogram Optimisation and Dynamic Pricing
Selecta’s 2024 pilot in Swiss offices used machine-learning to rotate SKUs and raised sales per machine by 19%. Dynamic pricing faces regulatory scrutiny in France but is gaining acceptance where demand elasticity supports it.
Restraints Impact Analysis*
| Restraint | (~) % Impact on CAGR Forecast | Geographic Relevance | Impact Timeline |
|---|---|---|---|
| Escalating Cyber-security and Data-Privacy Threats | -1.1% | EU (GDPR, Cyber Resilience Act), North America (state-level breach laws) | Short term (≤ 2 years) |
| High Capital Cost of Retrofit for Connectivity | -0.9% | North America and Europe, particularly legacy fleets in rural areas | Medium term (2-4 years) |
| Stringent EU Waste-Reduction Regulations on Single-Use Packaging | -0.6% | European Union member states, with pilot enforcement in France, Germany | Long term (≥ 4 years) |
| Persistent Vandalism and Physical Theft Risks | -0.5% | Urban centers in United States, Southern Europe | Short term (≤ 2 years) |
| Source: Mordor Intelligence | |||
Escalating Cyber-Security and Data-Privacy Threats
The EU Cyber Resilience Act obliges vending operators to patch vulnerabilities within 14 days or face fines up to 2.5% of global revenue, raising compliance outlays by USD 800–1,200 per legacy unit.[1]European Union, “Regulation (EU) 2024/573 on Fluorinated Gases,” eur-lex.europa.eu
High Capital Cost of Retrofit for Connectivity
Converting a mechanical machine into an IoT node typically costs USD 1,500–2,500, pushing fleet-wide upgrades for mid-size operators into the USD 7–12 million range and delaying full telemetry rollouts.
*Our forecasts treat driver/restraint impacts as directional, not additive. The impact forecasts reflect baseline growth, mix effects, and variable interactions.
Segment Analysis
By Type: Fresh Meals Challenge Beverage Dominance
Sales of beverage machines still anchor the North America and Europe vending machine market, holding 45.78% revenue share in 2025. However, food and snack machines are forecast to grow 9.02% annually, reflecting the superior gross margins of chef-prepared meals. A single Farmer’s Fridge unit at Chicago O’Hare generated USD 120,000 in 2024 triple the take of a standard snack vendor. Cold-chain investments are therefore rising, spurred by FDA temperature-logging mandates and EU refrigerant rules that favor energy-efficient propane systems.
Natural-refrigerant compressors add 30–40% to equipment cost yet reduce electricity use by 20%, enabling price premiums on perishable SKUs. Beverage vending continues to benefit from supplier-funded placements and tolerant temperature bands, enabling incumbents to defend share through exclusive pour rights and promotional pricing. Personal-care merchandising remains below 5% but is gaining traction in hospitals and dormitories, where round-the-clock access to hygiene items offsets emergency-supply trips.


By Location: Transit Hubs Gain as Offices Plateau
Offices delivered 36.72% of 2025 installations, but hybrid work diminished weekday footfall and pressured per-machine turnover. In contrast, airports and metro stations are projected to grow at an annual rate of 8.31%, aided by municipal efforts to diversify non-fare revenue. Metro de Madrid’s EUR 7.7 million contract for 145 combo ticket-and-snack units underscores the commercial potential, each machine occupies only 4 sq ft and is expected to earn USD 35,000 yearly, split evenly with the transit authority.
Institutional venues such as schools and hospitals provide stable demand but impose nutritional or hygiene restrictions that lengthen assortment cycles. Leisure settings exhibit high per-event revenue yet volatile throughput, compelling operators to balance machine density with route efficiency. Closed-campus systems simplify settlement but tie operators into exclusive contracts, limiting SKU experimentation.
By Payment Mode: Mobile Wallets Erode Cash Hegemony
Cash still represented 57.89% of 2025 transactions, but the share is sliding as smartphone wallets win favor. Apple Pay and Google Pay adoption exceeded 50% among U.S. and U.K. smartphone users by mid-2024, propelling a 12.78% CAGR for mobile wallets through 2031. Cantaloupe micro-markets achieved 96% cashless penetration in 2024, showcasing how digitally literate environments can bypass notes and coins altogether. The forthcoming digital euro may accelerate this shift by offering instant settlement with negligible interchange fees.
Closed-loop stored-value systems captured 8.00% of 2025 volume but remain confined to campuses and large employers. PSD3 proposals to cap interchange on sub-EUR 5 transactions will further squeeze processor margins and encourage QR-based schemes that skirt card rails.
By Technology: IoT Retrofit Economics Slow Smart-Machine Adoption
Smart machines are forecast to grow at a rate of 15.26% annually, the fastest of any segment; yet, non-smart units still dominate, accounting for 60.94% of 2025 installations. Operators weigh USD 1,500–2,500 retrofit costs against telemetry benefits, as connected machines cut out-of-stocks by 40% and shrink truck rolls by 25%. However, connectivity fees and cybersecurity compliance dilute returns in low-traffic zones. PCI DSS 4.0 now requires multi-factor authentication for remote device access, adding USD 50,000–100,000 in annual spend for mid-size fleets.
Operators are experimenting with modular upgrade kits that bolt cellular modems, optical sensors, and cashless readers onto legacy cabinets, reducing retrofit costs to USD 1,000–1,200 while still unlocking telemetry that reduces truck rolls by 20–30% and cuts unplanned downtime by 25%. Yet reliability gaps persist in basement corridors and rural fuel stops where SIM authentication fails or metal enclosures weaken signals, forcing some fleets to revert to store-and-forward data dumps during scheduled service visits.
By End-Use Industry: Healthcare Vending Gains from PPE Demand
Corporate campuses led 2025 revenue at 30.12%, yet healthcare is projected to climb 10.57% annually as hospitals automate PPE and OTC drug dispensing. Medical vending reached USD 428 million in 2025, with North America supplying roughly 40% of installations. Hospitals value traceability and 24-hour availability, while PPE machines ease front-desk congestion and increase infection-control compliance.
Education adheres to the USDA’s Smart Snacks standards, limiting SKU variety and slowing growth. Travel and hospitality sites command premium prices but pay revenue-share fees of up to 20%. Manufacturing plants leverage vending and micro-markets to retain shift workers, though OSHA placement rules require careful site selection.
Geography Analysis
The United States captured 53.85% of 2025 revenue, supported by 7 million installed machines and a 77% cashless transaction rate. Energy-efficient refrigeration adoption is accelerating under the SNAP program, trimming operating costs by 20% despite USD 3,000–5,000 upfront outlays per unit. Canada benefits from the adoption of universal debit and bilingual labeling, which discourages cross-border imports, while fresh-food vending continues its gradual expansion in high-traffic urban centers.
Germany is the fastest-growing major market at 8.74% CAGR to 2031, buoyed by girocard ubiquity and the SECO-BDTA plan to retrofit 200,000 tobacco machines with cashless modules. Cash transactions dropped from 82.5% in 2008 to 51% in 2023, hastening the shift to digital payments. The U.K., France, and Italy each command 8–12% of European sales but face rising packaging waste compliance costs, particularly under France’s AGEC law, which mandates 50% reusable or compostable containers by 2027. Spain leverages tourism; airport and rail machines can yield USD 40,000–60,000 annually, twice the office average. Russia remains limited by import restrictions on Western telemetry gear, keeping smart-machine penetration below 10%. Across the EU, implementation of the Cyber Resilience Act and Packaging Directive will create scale advantages for large operators capable of spreading compliance costs across extensive fleets.
Competitive Landscape
The North America and Europe vending machine market remains moderately concentrated; the top Scale affords them superior route density, exclusive site contracts, and bargaining power with payment processors. Cantaloupe’s connected endpoints rose 12% year-over-year to 2.1 million in fiscal 2024, cutting service calls 22% and boosting average transaction value 9%.
Disruptors such as Farmer’s Fridge command 60% gross margins on fresh meals by leveraging cold-chain logistics and chef-prepared branding. Micro-market kiosks bypass coin mechanisms entirely and achieved 96% cashless penetration in 2024, pressuring legacy vending machines to upgrade their interfaces. Compliance with ETSI TS 103 701 constrains over-profiling but still permits aggregate demand analysis, which is critical to SKU optimization. Consolidation is likely as mid-tier operators lacking telemetry scale struggle to meet cybersecurity and packaging mandates.
North America And Europe Vending Machine Industry Leaders
American Vending Machines Inc.
Fuji Electric Co., Ltd.
Azkoyen Vending Systems, S.A.
Aramark Corporation
Jofemar Corporation
- *Disclaimer: Major Players sorted in no particular order

Recent Industry Developments
- September 2024: Cantaloupe acquired SB Software to expand European telemetry, adding algorithms that reduce fuel use 18% and out-of-stocks 35% .
- June 2024: SECO and BDTA launched a plan to retrofit 200,000 German tobacco machines with cashless readers by 2025.
- April 2024: Metro de Madrid awarded a EUR 7.7 million (USD 8.97 million) contract for 145 ticket-and-snack machines to Azkoyen, sharing revenue 50-50 with operators.
- March 2024: The EU Cyber Resilience Act entered into force, classifying connected vending machines as products with digital elements and mandating 24-month patch support.


North America And Europe Vending Machine Market Report Scope
The North America and Europe vending machine market encompasses automated retail systems that dispense beverages, snacks, personal care items, and other goods across offices, institutions, transportation hubs, and leisure venues. It includes both traditional standalone machines and smart, IoT-enabled units that support cash and various cashless payment modes, serving diverse end-use industries from corporate workplaces to healthcare and hospitality. Overall, the market focuses on convenient, unattended product distribution and enhanced user experience across the US, Canada, and European countries.
The North America and Europe Vending Machine Market Report is Segmented by Type (Beverage, Food and Snacks, Personal-Care and Hygiene, Other Goods), Location (Office and Commercial Buildings, Institutional Settings, Transportation Facilities, Leisure and Entertainment Venues), Payment Mode (Cash, Cashless - Card, Cashless - Mobile Wallet or QR, Closed-Loop Systems), Technology (Smart or Connected IoT-Enabled, Non-Smart Standalone), End-Use Industry (Corporate Workspaces, Education, Healthcare, Travel and Hospitality, Manufacturing and Distribution Centres), and Geography (United States, Canada, United Kingdom, Germany, France, Italy, Spain, Russia, Rest of Europe). The Market Forecasts are Provided in Terms of Value in USD.
By Type
| Beverage |
| Food and Snacks |
| Personal-Care and Hygiene |
| Other Type |
By Location
| Office and Commercial Buildings |
| Institutional Settings |
| Transportation Facilities |
| Leisure and Entertainment Venues |
By Payment Mode
| Cash |
| Cashless - Card |
| Cashless - Mobile Wallet / QR |
| Closed-Loop Systems (Campus/Stored-Value) |
By Technology
| Smart/Connected (IoT-Enabled) |
| Non-Smart (Standalone) |
By End-Use Industry
| Corporate Workspaces |
| Education |
| Healthcare |
| Travel and Hospitality |
| Manufacturing and Distribution Centres |
By Geography
| North America | United States |
| Canada | |
| Europe | United Kingdom |
| Germany | |
| France | |
| Italy | |
| Spain | |
| Russia | |
| Rest of Europe |
| By Type | Beverage | |
| Food and Snacks | ||
| Personal-Care and Hygiene | ||
| Other Type | ||
| By Location | Office and Commercial Buildings | |
| Institutional Settings | ||
| Transportation Facilities | ||
| Leisure and Entertainment Venues | ||
| By Payment Mode | Cash | |
| Cashless - Card | ||
| Cashless - Mobile Wallet / QR | ||
| Closed-Loop Systems (Campus/Stored-Value) | ||
| By Technology | Smart/Connected (IoT-Enabled) | |
| Non-Smart (Standalone) | ||
| By End-Use Industry | Corporate Workspaces | |
| Education | ||
| Healthcare | ||
| Travel and Hospitality | ||
| Manufacturing and Distribution Centres | ||
| By Geography | North America | United States |
| Canada | ||
| Europe | United Kingdom | |
| Germany | ||
| France | ||
| Italy | ||
| Spain | ||
| Russia | ||
| Rest of Europe | ||


Key Questions Answered in the Report
How large will cashless payments become in North American and European vending by 2031?
Mobile wallet and QR-code transactions are projected to rise at a 12.78% CAGR, cutting the cash share well below one-third of all purchases by 2031.
Which product category is expanding fastest in regional vending?
Food and snack machines are set to grow 9.02% per year, outpacing beverages due to higher margins on fresh meals.
Why are transit hubs attractive for new machine placements?
Airports and metro systems target non-fare revenue, and machines in these venues can earn USD 35,00060,000 annually while fulfilling contact-free shopping expectations.
What is driving smart-machine adoption despite retrofit expenses?
Connected units slash out-of-stocks 40% and trim truck rolls by about 25%, delivering route efficiencies that offset monthly connectivity fees.
How will EU regulations influence vending-machine operations?
The Cyber Resilience Act and updated Packaging Directive impose new security-patch and recycling duties, favoring well-capitalized operators able to spread compliance costs.
Page last updated on:


