Connected Vending Machine Market Size and Share
Market Overview
| Study Period | 2020 - 2031 |
|---|---|
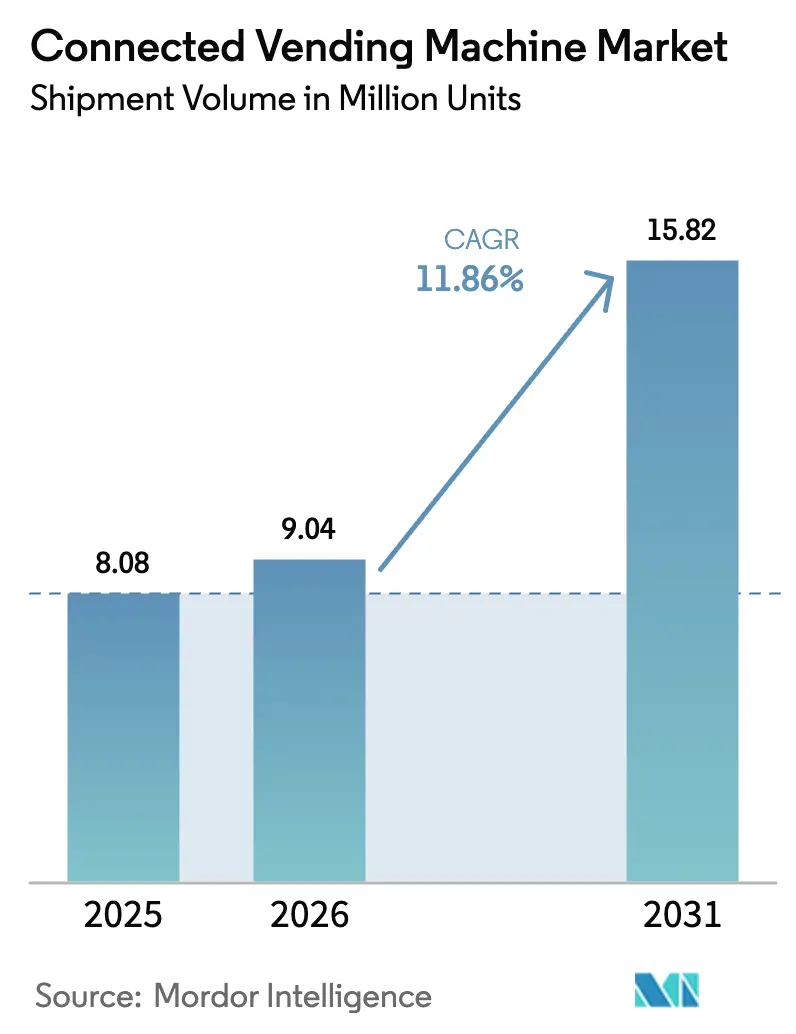
| Market Volume (2026) | 9.04 Million units |
| Market Volume (2031) | 15.82 Million units |
| Growth Rate (2026 - 2031) | 11.86% CAGR |
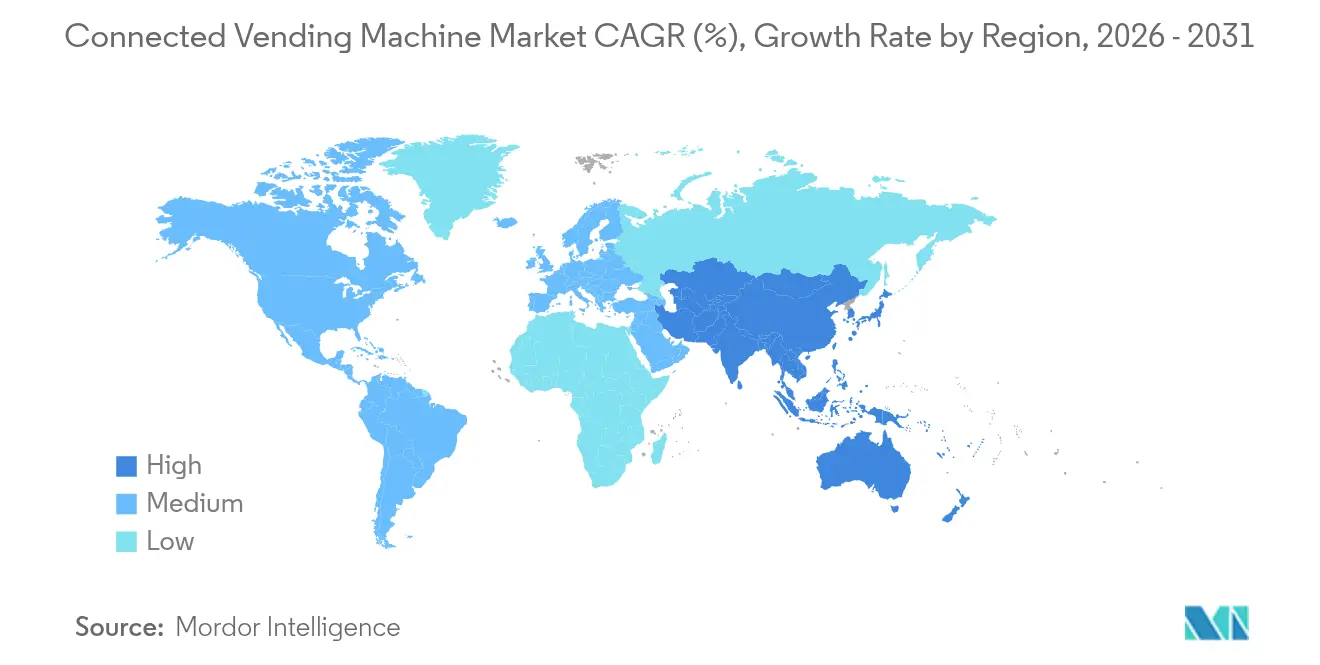
| Fastest Growing Market | Asia Pacific |
| Largest Market | North America |
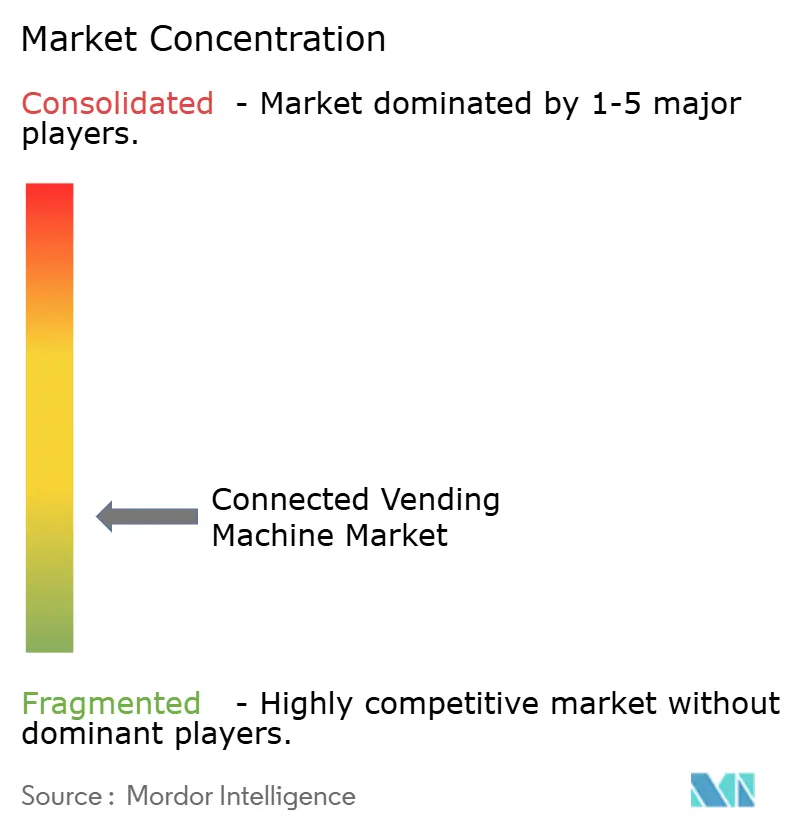
| Market Concentration | Low |
Major Players *Disclaimer: Major Players sorted in no particular order Image © Mordor Intelligence. Reuse requires attribution under CC BY 4.0. | |
Connected Vending Machine Market Analysis by Mordor Intelligence
The Connected Vending Machine Market size is expected to grow from 8.08 million units in 2025 to 9.04 million units in 2026 and is forecast to reach 15.82 million units by 2031 at 11.86% CAGR over 2026-2031. Cashless payment penetration, expanding transit networks, and rising demand for healthier on-the-go meals accelerate machine roll-outs, while IoT sensors and cloud dashboards enable predictive restocking that lifts uptime and sales. Stand-alone cabinets still dominate placements because they stock broad assortments, yet space-saving wall-mounted units scale fastest as corporate landlords defend rentable floor area. Fresh and frozen food outpaces legacy beverages as workplace diners seek meal replacements close to their desks. Regionally, North America leverages mature contactless infrastructure to keep leadership, but Asia-Pacific’s mobile-first consumers and rapid urban transit build-outs give it the steepest growth curve. Competitive rivalry remains moderate as global OEMs such as Azkoyen and Fuji Electric face nimble local makers; payment specialists, including Nayax, enlarge installed footprints by bundling hardware-agnostic telemetry and cashless modules.
Key Report Takeaways
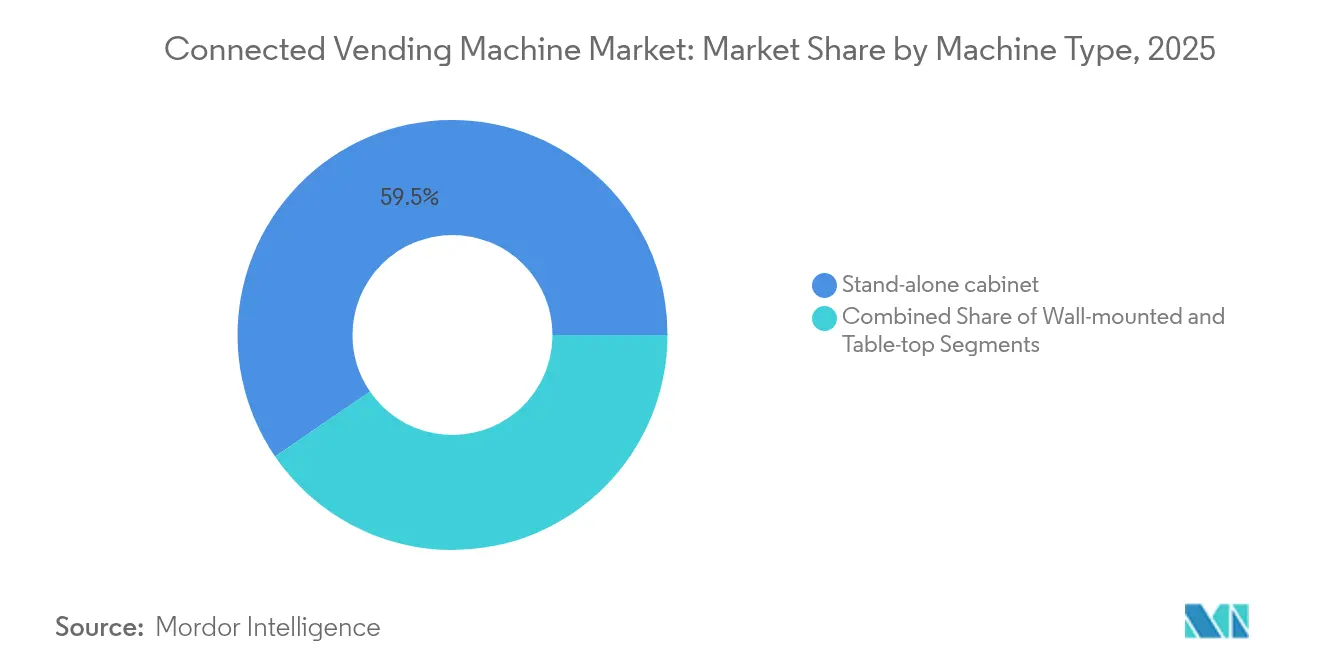
- By machine type, stand-alone cabinets held 59.55% of the connected vending machine market share in 2025; wall-mounted units are forecast to post a 13.55% CAGR through 2031.
- By product category, beverages accounted for 37.65% of the connected vending machine market size in 2025, while fresh and frozen food is advancing at a 13.74% CAGR through 2031.
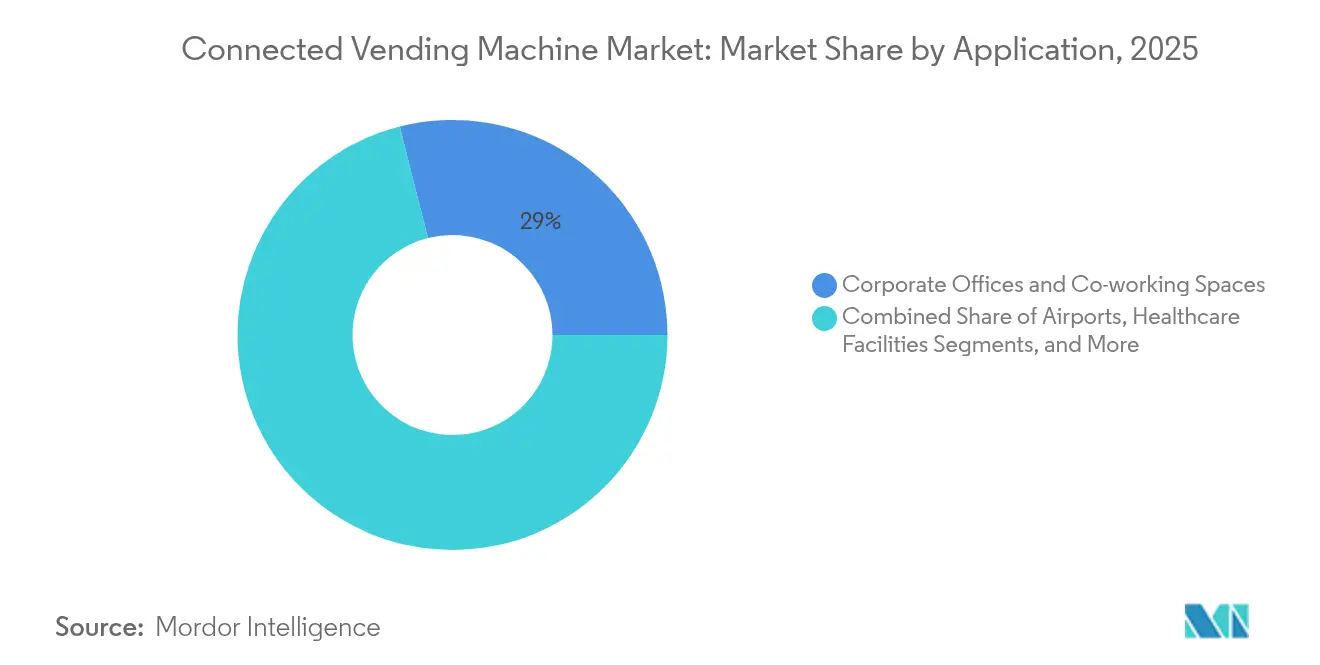
- By application, corporate offices and co-working spaces led with a 28.95% share in 2025; railway and metro stations post the highest projected CAGR at 13.32% to 2031.
- By connectivity, telemetry-enabled systems held a 35.10% share in 2025, whereas AI-powered machines are set to grow at a 14.18% CAGR through 2031.
- By payment technology, cash and coin mechanisms captured 38.85% of the connected vending machine market share in 2025, while biometric face-pay solutions are projected to expand at a 14.07% CAGR by 2031.
- By geography, North America captured 37.25% revenue in 2025, as Asia-Pacific is poised for the fastest 14.22% CAGR between 2026 and 2031.
Note: Market size and forecast figures in this report are generated using Mordor Intelligence’s proprietary estimation framework, updated with the latest available data and insights as of 2026.
Global Connected Vending Machine Market Trends and Insights
Drivers Impact Analysis*
| Driver | (~) % Impact on CAGR Forecast | Geographic Relevance | Impact Timeline |
|---|---|---|---|
| Growing adoption of cashless and mobile payments | +2.8% | Global, with highest penetration in North America and EU | Medium term (2-4 years) |
| Demand for contactless, hygienic retail | +2.1% | Global, accelerated in APAC post-pandemic | Short term (≤ 2 years) |
| Retail automation to offset labour costs | +1.9% | North America and EU core, expanding to APAC | Long term (≥ 4 years) |
| Rapid expansion of transit hubs (airport/rail) | +1.7% | APAC core, spill-over to MEA and Latin America | Medium term (2-4 years) |
| Integration with deposit-return reverse-vending | +1.3% | EU leading, North America following | Long term (≥ 4 years) |
| Programmatic DOOH advertising revenue streams | +0.9% | North America and EU, early adoption in urban APAC | Medium term (2-4 years) |
| Source: Mordor Intelligence | |||
Growing Adoption of Cashless and Mobile Payments
Global payment digitalisation is steering the connected vending machine market toward card-free transactions that already represent as much as 50% of sales for well-placed assets. [1]CA Cashless Payment Solution, “Nayax Cashless Payment Solution,” nayax.com The pairing of NFC smartphones, contactless cards, and mobile wallets removes friction, expands ticket sizes, and unlocks loyalty schemes driven by real-time POS data. Cantaloupe’s Engage Pulse reader lifted crane-game revenue 85% through ladder pricing that charges once for multiple plays. Operators gain richer shopper analytics to refine planograms, while biometric wallets signal a next wave of frictionless settlement as DyDo pilots face-pay units with NEC in Japan.
Demand for Contactless, Hygienic Retail
Post-pandemic risk awareness pushes businesses to adopt touch-free dispensing that reassures patrons and satisfies internal health protocols. Machines with motion sensing, voice prompts, and QR-code Apps replace physical keypads, and ultraviolet or blue-light sanitising cycles disinfect contact areas between purchases, as shown by HMSHost’s self-checkout kiosks at Charlotte Douglas International Airport. [2]AI-Powered Self-Checkout, “AI-Powered Self-Checkout Kiosks,” hmshost.com Remote dashboards verify cleaning logs, letting operators demonstrate compliance to facility managers. Healthcare, corporate, and education sites, therefore, prioritise smart fleets that minimise shared-surface concerns while offering extended SKU variety.
Retail Automation to Offset Labour Costs
Tight labour pools and elevated wages encourage operators to scale unattended micro-retail. Predictive maintenance alerts and route optimisation lower service runs without risking stock-outs. Fastenal industrial units achieve 99.99% reliability by restricting employee access via allocation codes and by pushing usage data into ERP workflows. Multi-site owners oversee hundreds of endpoints from single dashboards, reducing field headcount while using consumption analytics to fine-tune pricing and assortment per site.
Rapid Expansion of Transit Hubs (Airport/Rail)
Governments are funneling capital into rail corridors, metro lines, and airport modernisation, generating high-footfall spots ideal for connected vending machine market deployments. Munich Airport’s snack-selling robot illustrates 24/7 service where staffed retail is impractical. Seamless ticket-to-purchase journeys emerge as metro cards double as payment tokens, as with New York’s OMNY readers now integrated into vending endpoints.
Restraints Impact Analysis*
| Restraint | (~) % Impact on CAGR Forecast | Geographic Relevance | Impact Timeline |
|---|---|---|---|
| High initial cap-ex and installation outlay | -1.8% | Global, particularly impacting small operators | Short term (≤ 2 years) |
| Vandalism and security of unattended assets | -1.2% | Urban areas globally, higher impact in developing markets | Medium term (2-4 years) |
| Fragmented connectivity/protocol standards | -0.8% | Global, with higher impact in regions lacking standardization | Medium term (2-4 years) |
| School nutrition regulations limiting SKUs | -0.6% | North America and EU primarily, expanding to other developed markets | Long term (≥ 4 years) |
| Source: Mordor Intelligence | |||
High Initial Cap-ex and Installation Outlay
Advanced machines cost from USD 4,299 for entry-level AI models to above USD 15,000 for multi-temperature kiosks, stretching cash flow for small route operators. Additional costs arise from power upgrades, connectivity subscriptions, and payment gateway fees. Mixed fleets often persist because operators retrofit selectively, delaying the network-effect benefits of full digitisation and slowing connected vending machine market penetration in cost-sensitive locales.
Vandalism and Security of Unattended Assets
Touchscreens, cameras, and cash holders attract both physical tampering and cyber-intrusions. Reinforced cabinets, encrypted comms, and tokenised payments are now minimum requirements, raising insurance premiums. Privacy pushback can also stall roll-outs; the University of Waterloo removed smart units when facial-recognition functions triggered concerns. Operators must therefore balance openness with robust security frameworks during site selection.
*Our forecasts treat driver/restraint impacts as directional, not additive. The impact forecasts reflect baseline growth, mix effects, and variable interactions.
Segment Analysis
By Machine Type: Wall-Mounted Units Drive Space Optimisation
Stand-alone cabinets accounted for 59.55% of 2025 placements, anchoring the connected vending machine market with broad SKU capacity that suits transport concourses and campuses. Wall-mounted designs are now compounding at 13.55% as landlords squeeze incremental services into corridors and break-rooms. The connected vending machine market size for stand-alone units remains large, yet compact fixtures attract operators seeking incremental revenue without floor-space trade-offs.
Technological miniaturisation enables wall units to match larger cousins on payment options, remote telemetry, and multi-temperature storage. Touchscreens, LED lighting, and cloud SKU tracking come standard, while lighter frames lower installation costs. These traits lift adoption across hospitals, schools, and boutique co-working sites where safety codes restrict floor obstruction.


By Product Type: Fresh Food Innovation Reshapes Offerings
Beverages held 37.65% of 2025 revenue due to established cold-chain logistics, but fresh and frozen food is compounding at 13.74% as consumers embrace healthier grab-and-go meals. Operators rely on IoT temperature logs to satisfy HACCP standards and on AI price markdowns to curb spoilage, boosting the connected vending machine market’s appeal in corporate dining replacements.
Dynamic salad kiosks in Tokyo, which flex prices by time of day to reduce waste, prove the model’s viability. New packaging keeps food fresh for 48 hours, while predictive restocking routes align supply with consumption peaks. These innovations elevate consumer trust in perishable automated retail.
By Application: Transit Hubs Accelerate Roll-outs
Corporate offices captured 28.95% of machines in 2025 as facilities teams upgraded pantry services, yet rail and metro sites show a 13.32% CAGR through 2031, outstripping all other channels. Long concourses and 24-hour footfall raise machine utilisation, making the connected vending machine market attractive to concessionaires and transport authorities seeking non-fare revenue.
Transit operators value the analytics that come with networked kiosks; dashboards heat-map passenger flows, guiding terminal redesigns, and media placement. API links to transit smart-card systems create frictionless pay-at-gate experiences, reinforcing vending as an extension of mobility infrastructure.
By Connectivity/Technology: AI-Powered Systems Lead Innovation
Telemetry-only fleets still form 35.10% of the installed base, giving operators remote alerts and basic stock counts. However, AI-enabled vision units are expanding at 14.18% and redefine the connected vending machine market by automating item recognition, loss prevention and personalised promotion.
Computer-vision kiosks register 99.5% pick accuracy, letting shoppers open smart lockers, choose items, and close doors while edge processors bill in seconds. Predictive maintenance modules schedule part swaps before failure, trimming downtime and service costs. This autonomous capability underpins higher uptime and incremental revenues that justify premium hardware pricing.
By Payment Technology: Biometric Authentication Gains Traction
Cash and coin still processed 38.85% of 2025 purchases, but biometric wallets are sprinting ahead at 14.07% CAGR as patrons trade anonymity for speed and ticketless journeys. DyDo’s face-pay pilots cut swipe time to 2 seconds and strengthen age-controlled sales compliance.
The connected vending machine market size for advanced payment modules will rise as operators slash card interchange fees and gather richer profile data for loyalty schemes. While compliance with GDPR-like rules is mandatory, local data processing and anti-spoofing algorithms mitigate privacy risks and encourage adoption across regulated product lines.
Geography Analysis
North America generated 37.25% of global revenue in 2025, reflecting sophisticated payment rails, early enterprise IoT adoption, and supportive data-privacy statutes that streamline deployments in corporate campuses and transportation venues. Cashless acceptance tops 80% across metro areas, so operators view AI upgrades as the next lever to lift same-machine sales.
Asia-Pacific is on a 14.22% CAGR path, underpinned by China’s manufacturing scale and mobile-wallet ubiquity. Domestic builders such as AFEN turn out 120,000 units annually, shipping to over 100 nations, while Thailand’s Tao Bin fleet moves 200,000 drinks daily through QR and face-pay interfaces. Urban rail extensions from Jakarta to Ho Chi Minh City place modern kiosks front and centre of commuter convenience.
Europe records stable yet policy-driven growth, spurred by single-use plastic rules and container deposit mandates that favour connected reverse vending endpoints. TOMRA’s 98% bottle return rate across Scandinavia showcases the model, while EU GDPR pushes vendors toward edge processing to keep personal data on-device. Emerging corridors in the Middle East, Africa, and South America display early-stage adoption; as telecom operators roll out 4G/5G, vending firms partner with public-health bodies, exemplified by LA County’s free naloxone kiosks, to build brand familiarity.

Competitive Landscape
The connected vending machine market is moderately fragmented; no single brand exceeds 10% shipment share, and the top five hold roughly 35%. Global OEMs—Azkoyen, Fuji Electric, and Crane Payment Innovations—supply multinationals, while local specialists tailor SKUs for regional regulations. Payment-technology vendors such as Nayax reached 1.33 million connected devices by bundling hardware-agnostic telemetry, helping operators unify mixed fleets.
Strategic alliances multiply. DyDo’s 2025 alliance with Asahi Soft Drinks merges route logistics and AI payment pilots, broadening service coverage. In the United States, 365 Retail Markets paired with Bright Light Solutions to integrate vision checkout into micro-markets, while Cantaloupe’s takeover of SB Software added ERP depth to its European proposition.
Patent filings reveal a competitive thrust toward securing key technologies. “Cooler Lock” grants remote control of refrigerated access, and “Multi-modal distribution” links kiosks with autonomous vehicles for last-mile fulfilment. Such IP stakes build defensive moats as AI and biometrics converge with vending hardware.
Connected Vending Machine Industry Leaders
Azkoyen Group
Fuji Electric Co. Ltd.
Crane Payment Innovations (CPI)
Evoca Group
SandenVendo America
- *Disclaimer: Major Players sorted in no particular order

Recent Industry Developments
- June 2025: Arca Continental acquired a vending-machine firm to deepen distribution and tech integration capabilities.
- May 2025: LA County launched vending machines offering free lifesaving health supplies, highlighting public health use cases.
- April 2025: Smart vending machines delivering healthcare essentials debuted at Winnipeg Hospital, broadening hospital automation.
- March 2025: Kofola ČeskoSlovensko moved to acquire a vending company, signalling European consolidation.
- February 2025: DyDo DRINCO and Asahi Soft Drinks formed an alliance for vending operations across Japan.
- January 2025: 365 Retail Markets partnered with Bright Light Solutions to accelerate AI checkout deployments.


Global Connected Vending Machine Market Report Scope
A connected vending machine is a modern iteration of the traditional one incorporating internet connectivity and advanced technologies. Unlike traditional vending machines operating standalone, connected vending machines have various smart features that enhance their functionality, management, and customer experience.
The connected vending machine market is segmented by product type (beverages, snacks, food, confections, others), application (commercial places, corporate offices, others), and geography (North America, Europe, Asia Pacific, Latin America, and Middle East and Africa).
The market sizes and forecasts are provided in terms of value (USD) for all the above segments.
| Wall-mounted |
| Table-top |
| Stand-alone cabinet |
| Beverages |
| Snacks |
| Fresh and Frozen Food |
| Confectionery |
| Others |
| Airports |
| Railway and Metro Stations |
| Corporate Offices and Co-working Spaces |
| Educational Institutes |
| Healthcare Facilities |
| Retail and Shopping Centres |
| Telemetry-enabled (semi-connected) |
| Fully IoT-connected (cloud CMS) |
| AI-powered Smart Machines |
| Reverse-vending/Deposit-return |
| Cash and Coin |
| Card Reader (EMV) |
| Mobile Wallet/NFC |
| Biometric/Face-pay |
| North America | United States | |
| Canada | ||
| Mexico | ||
| South America | Brazil | |
| Argentina | ||
| Chile | ||
| Rest of South America | ||
| Europe | Germany | |
| United Kingdom | ||
| France | ||
| Italy | ||
| Spain | ||
| Russia | ||
| Rest of Europe | ||
| Asia-Pacific | China | |
| India | ||
| Japan | ||
| South Korea | ||
| Singapore | ||
| Malaysia | ||
| Australia | ||
| Rest of Asia-Pacific | ||
| Middle East and Africa | Middle East | United Arab Emirates |
| Saudi Arabia | ||
| Turkey | ||
| Rest of Middle East | ||
| Africa | South Africa | |
| Nigeria | ||
| Rest of Africa | ||
| By Machine Type | Wall-mounted | ||
| Table-top | |||
| Stand-alone cabinet | |||
| By Product Type | Beverages | ||
| Snacks | |||
| Fresh and Frozen Food | |||
| Confectionery | |||
| Others | |||
| By Application | Airports | ||
| Railway and Metro Stations | |||
| Corporate Offices and Co-working Spaces | |||
| Educational Institutes | |||
| Healthcare Facilities | |||
| Retail and Shopping Centres | |||
| By Connectivity/Technology | Telemetry-enabled (semi-connected) | ||
| Fully IoT-connected (cloud CMS) | |||
| AI-powered Smart Machines | |||
| Reverse-vending/Deposit-return | |||
| By Payment Technology | Cash and Coin | ||
| Card Reader (EMV) | |||
| Mobile Wallet/NFC | |||
| Biometric/Face-pay | |||
| By Geography | North America | United States | |
| Canada | |||
| Mexico | |||
| South America | Brazil | ||
| Argentina | |||
| Chile | |||
| Rest of South America | |||
| Europe | Germany | ||
| United Kingdom | |||
| France | |||
| Italy | |||
| Spain | |||
| Russia | |||
| Rest of Europe | |||
| Asia-Pacific | China | ||
| India | |||
| Japan | |||
| South Korea | |||
| Singapore | |||
| Malaysia | |||
| Australia | |||
| Rest of Asia-Pacific | |||
| Middle East and Africa | Middle East | United Arab Emirates | |
| Saudi Arabia | |||
| Turkey | |||
| Rest of Middle East | |||
| Africa | South Africa | ||
| Nigeria | |||
| Rest of Africa | |||


Key Questions Answered in the Report
What is the current size of the connected vending machine market?
The connected vending machine market size stood at 9.04 million units in 2026 and is on track to hit 15.82 million units by 2031.
Which segment is expanding fastest within the connected vending machine market?
AI-powered machines lead growth with a 14.18% CAGR because their predictive analytics and vision checkout lift sales and cut service costs.
Why are wall-mounted machines gaining popularity?
Companies prefer wall-mounted units to free up floor space while still offering broad product ranges, driving a 13.55% CAGR for this format.
Which region is forecast to grow quickest?
Asia-Pacific shows the strongest momentum at a 14.22% CAGR, fuelled by mobile payment ubiquity and rapid transit-hub construction.
How are cashless payments affecting vending operations?
Contactless cards, NFC phones and biometric wallets already make up close to half of transactions in leading markets, raising sales by reducing cash-handling barriers and enabling loyalty programs.
What key risk could slow the connected vending machine industry?
High upfront hardware costs and site retrofits can lengthen payback periods, discouraging smaller operators from full fleet upgrades in the short term.
Page last updated on:


