
Niacin and Niacinamide Market Size and Share
Market Overview
| Study Period | 2020 - 2031 |
|---|---|
| Market Size (2026) | USD 1.59 Billion |
| Market Size (2031) | USD 1.99 Billion |
| Growth Rate (2026 - 2031) | 4.55 % |
| Fastest Growing Market | North America |
| Largest Market | Asia-Pacific |
| Market Concentration | Medium |
Major Players *Disclaimer: Major Players sorted in no particular order Image © Mordor Intelligence. Reuse requires attribution under CC BY 4.0. | |
Niacin and Niacinamide Market Analysis by Mordor Intelligence
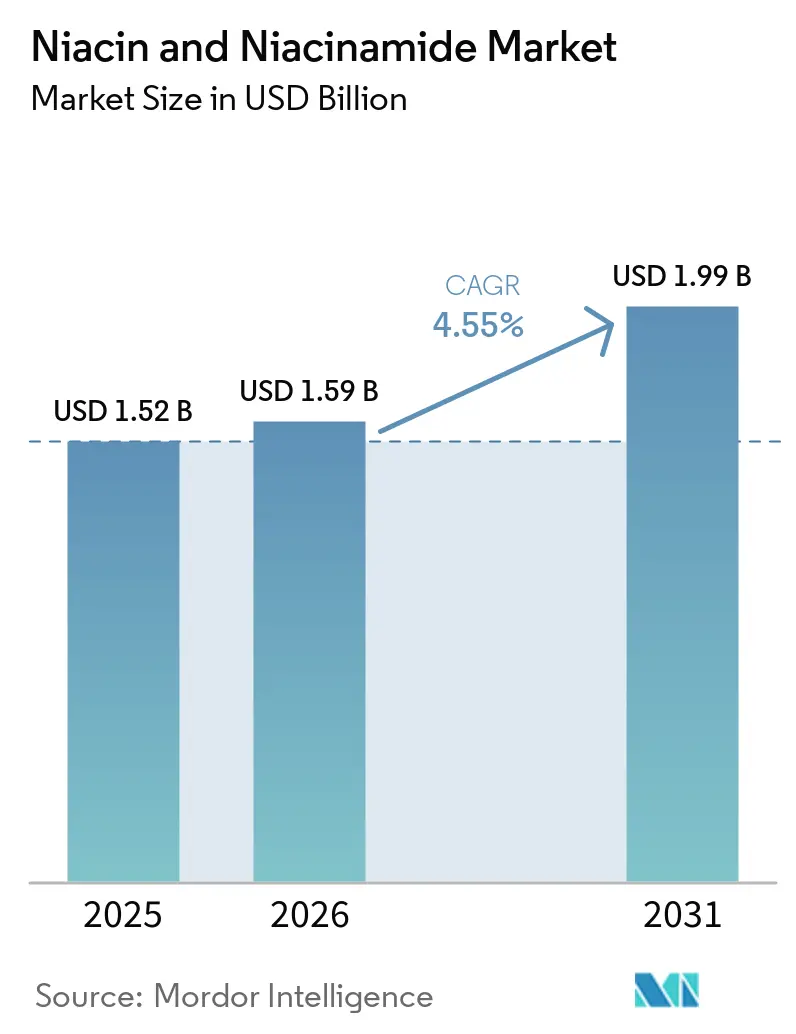
The Niacin And Niacinamide Market size was valued at USD 1.52 billion in 2025 and is estimated to grow from USD 1.59 billion in 2026 to reach USD 1.99 billion by 2031, at a CAGR of 4.55% during the forecast period (2026-2031).
The market is separating into higher-specification cosmetic, pharmaceutical, and food-fortification grades and lower-margin feed-grade material. Across food and feed applications, fortification programs create recurring demand that is less dependent on consumer spending patterns, because participating millers and processors must buy compliant inputs as part of ordinary production rather than as a discretionary product addition, giving suppliers a basis for planning capacity and inventory around more visible program requirements. Niacinamide is increasingly used as a cosmetic active rather than only as a vitamin additive, which supports higher selling prices in personal care. Buyers are also placing greater weight on traceable supply, regulatory documentation, and lower-carbon production methods, particularly where internal procurement standards require suppliers to show how material was made, how each batch can be verified, and whether the source can satisfy the same requirements as volumes increase. These requirements favor suppliers that can meet certified quality standards across several end uses, while maintaining reliable delivery, documented controls, and practical technical support for formulation teams.
Key Report Takeaways
- By product type, niacinamide held 58.31% revenue share in 2025 and is expected to record the highest CAGR at 8.65% through 2031.
- By source, synthetic material held 71.24% revenue share in 2025, while natural and bio-based material is forecast to grow at 6.42% CAGR through 2031.
- By form, powder held 53.24% revenue share in 2025, while liquid form is forecast to grow at 8.52% CAGR through 2031.
- By application, pharmaceuticals held 42.14% revenue share in 2025, while cosmetics and personal care are forecast to grow at 8.82% CAGR through 2031.
- By distribution channel, direct sales and contract supply held 32.84% revenue share in 2025, while online retail and e-commerce are forecast to grow at 7.22% CAGR through 2031.
- By geography, Asia-Pacific held 42.41% revenue share in 2025, while North America is forecast to grow at 7.25% CAGR through 2031.
Note: Market size and forecast figures in this report are generated using Mordor Intelligence’s proprietary estimation framework, updated with the latest available data and insights as of January 2026.
Global Niacin and Niacinamide Market Trends and Insights
Drivers Impact Analysis*
| Driver | (~) % Impact on CAGR Forecast | Geographic Relevance | Impact Timeline |
|---|---|---|---|
| Food And Feed Fortification Programs | +1.0% | Global, Sub-Saharan Africa, South Asia, and Latin America most active | Medium term (2-4 years) |
| Preventive Healthcare And Supplement Consumption | +0.9% | North America, EU, and East Asia | Short term (≤ 2 years) |
| Pharmaceutical-Grade Vitamin B3 Demand | +0.8% | North America, EU, and Japan | Medium term (2-4 years) |
| Niacinamide In Dermatological Skincare | +1.0% | Global, with APAC and North America fastest | Short term (≤ 2 years) |
| Lower-Carbon And Bio-Based Production | +0.4% | EU, North America, and Japan | Long term (≥ 4 years) |
| Multi-Source And Audit-Ready Supply | +0.3% | Global, with EU and North America the primary focus | Medium term (2-4 years) |
| Source: Mordor Intelligence | |||
Expanding Food and Feed Fortification Programs
Government-supported fortification programs provide the niacin and niacinamide market with demand that is tied to nutrition policy and monitored procurement. Ethiopia’s food fortification plan reached full implementation on August 31, 2024, and requires niacin fortification of wheat flour under Ethiopian Standard 309. Wider coordination among West African countries can support longer supply agreements instead of irregular spot purchases. Such arrangements give regional distributors clearer volume expectations and give producers more stable sales channels, because regular compliance purchasing is easier to plan than occasional imports that depend on changing local inventory levels. EU rules also govern additives used in animal nutrition, supporting demand for certified niacin in livestock premixes. China’s tighter feed registration requirements also raise the importance of purity and documentation in domestic ingredient sourcing, which can make established producers more attractive when processors must demonstrate that their premix inputs meet defined standards.
Rising Preventive Healthcare and Supplement Consumption
Preventive healthcare is broadening the use of niacin and niacinamide beyond narrow therapeutic applications. A 2025 randomized clinical trial reported that niacin reduced lipoprotein(a) by 11.4% and LDL-C by 31.9% among hemodialysis patients[1]. These results sustain interest in pharmaceutical-grade material for high-risk cardiovascular populations. Niacinamide is also under clinical investigation for neuroprotective uses in Alzheimer’s disease and Parkinson’s disease, encouraging manufacturers to consider dedicated high-purity products for older consumers while the clinical work continues. Supplement brands serving older consumers, therefore, need high-purity material and stronger product documentation. The resulting preference for detailed specifications and certificates of analysis differentiates functional-grade supply from commodity material, as brands must be able to explain ingredient quality to customers, regulators, and commercial partners.
Growth in Pharmaceutical-Grade Vitamin B3 Demand
The niacin and niacinamide market benefits from vitamin B3 demand across cardiovascular, renal, metabolic, and dermatological care. The 2025 hemodialysis study also reported changes in phosphorus and parathyroid hormone markers alongside lipid effects. Niacin can therefore remain relevant as an adjunct within broader metabolic management protocols. Pharmaceutical programs require niacinamide with purity of at least 99.0% and strict controls for heavy metals, residual solvents, and microbial contamination. These conditions prevent feed-grade material from serving clinical demand. FDA and EMA requirements for clinical-grade active ingredients favor qualified producers with established compliance systems, since meeting these requirements involves ongoing testing, documented controls, and the ability to respond to customer audits.
Accelerating Niacinamide Use in Dermatological Skincare
Niacinamide has become an established cosmetic active with uses in barrier care, pigmentation management, sebum regulation, and anti-inflammatory formulations. A 2025 study reported antimicrobial activity at concentrations between 15,000 ppm and 40,000 ppm and described niacinamide’s skin-health properties. The evidence base supports its use in products designed for acne-prone, sensitive, and aging skin, allowing formulators to use one ingredient across several consumer needs instead of relying on a narrowly positioned single-benefit active. Existing regulatory acceptance in the European Union and Japan reduces reformulation uncertainty for cosmetics manufacturers. Premium serums, moisturizers, and sunscreens commonly use niacinamide at 5% to 10% concentrations. This pattern gives the niacin and niacinamide market a recurring route into skincare portfolios, including formulations for routine daily consumer use that require consistent ingredient quality, as brands need reproducible performance when they sell the same formulation across retail, professional, and digital channels.
Restraints Impact Analysis*
| Restraint | (~) % Impact on CAGR Forecast | Geographic Relevance | Impact Timeline |
|---|---|---|---|
| Niacin Flushing And High-Dose Tolerability | -0.3% | North America and EU | Short term (≤ 2 years) |
| Commodity-Grade Price Competition | -0.5% | Global, most acute in APAC commodity segments | Short term (≤ 2 years) |
| Formulation Stability And Niacin Conversion | -0.2% | EU and North America | Medium term (2-4 years) |
| Concentrated East Asian Feedstock Exposure | -0.4% | Global, acute for EU and North American buyers | Medium term (2-4 years) |
| Source: Mordor Intelligence | |||
Niacin Flushing and High-Dose Tolerability Concerns
Niacin flushing remains a material barrier for therapeutic and over-the-counter supplement use. FDA labeling identifies flushing as a prostaglandin-mediated response and reports it in up to 88% of patients using immediate-release formulations. A 2025 study linked an attenuated flushing response with cognitive impairment in late-life depression. This leaves brands with a difficult communication issue because the pathway has both tolerability and research relevance. FDA labeling reported that extended-release products reduced average flushing events from 8.6 to 1.9 in each 4-week period. However, slower pharmacokinetics can reduce peak exposure for certain lipid-management needs, leaving prescribers and patients to balance comfort, dose selection, and the desired clinical response.
Commodity-Grade Price Competition and Margin Compression
Price competition from Chinese and Indian volume producers continues to limit margins for undifferentiated feed-grade niacin. Chinese manufacturing capacity can respond when demand improves, which makes sustained commodity price recovery difficult. Smaller producers outside East Asia face limited opportunities to establish durable feed-grade margins without moving toward higher-quality grades. Western producers are consequently concentrating on certified pharmaceutical and cosmetic supply rather than large commodity volumes. This strategy protects differentiated portfolios but leaves commodity competition concentrated among price-focused suppliers. Commodity price visibility can also limit the pricing freedom of premium suppliers when formulators consider substitutes, even where premium-grade material offers more complete documentation or better suitability for a regulated finished product.
*Our forecasts treat driver/restraint impacts as directional, not additive. The impact forecasts reflect baseline growth, mix effects, and variable interactions.
Segment Analysis
By Product Type: Niacinamide Leads in Value and Growth
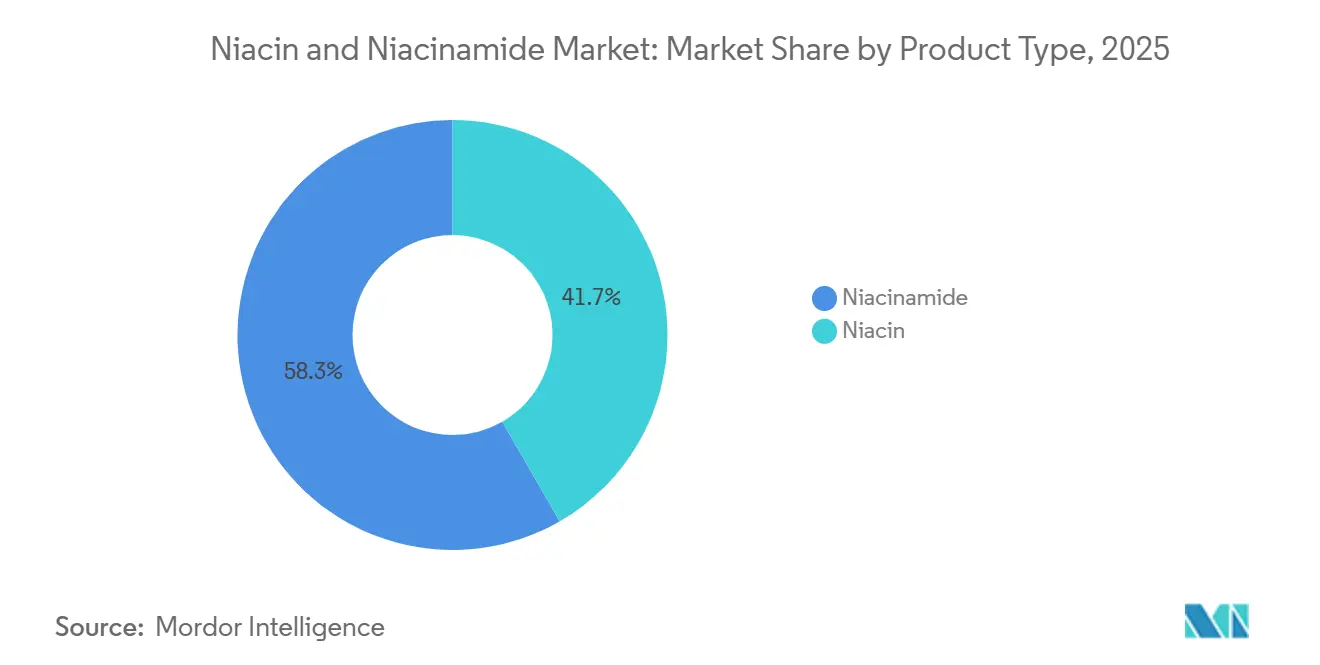
Niacinamide held 58.31% of the niacin and niacinamide market share by value in 2025 and is forecast to grow at 8.65% CAGR through 2031. Its use spans cosmetics, nutraceuticals, food fortification, and pharmaceutical products. This broad use base is wider than niacin’s primary exposure to therapeutic and feed channels. Cosmetic brands use niacinamide in premium serums, and pharmaceutical manufacturers qualify it for supplements and topical products. Food processors also select niacinamide for some fortified products because it avoids niacin-related flushing. These combined uses allow the niacin and niacinamide industry to serve several demand streams through one product category. Capacity activity by Lonza, DSM-Firmenich, and Zhejiang NHU during 2024 to 2026 reflected confidence in demand for differentiated grades, where customer qualification processes, batch consistency, and application support can matter as much as available tonnage. The segment’s growth also reflects the value placed on quality assurance and stable product performance by formulators.
Niacin continues to have an established role in extended-release dyslipidemia products and metabolic management. It also remains relevant in feed premixes where its cost position is important. Its therapeutic use is constrained by tolerability concerns at high doses. That constraint has limited consumer-health adoption even where pharmacological efficacy is recognized. Standard treatment protocols in regulated markets also use statins and combination lipid therapies. These practices narrow niacin’s growth potential in some therapeutic settings, especially where clinicians have established treatment pathways and patients may be reluctant to accept the tolerability issues associated with higher therapeutic doses. The product is not obsolete, because its core uses remain supported by clinical and feed requirements. Instead, its slower expansion reflects a ceiling in its established channels, because demand is sustained by known uses but does not benefit from the same broad product-development activity visible in niacinamide-based personal care. The niacin and niacinamide market, therefore, retains demand for both products while value growth shifts toward niacinamide.
By Source: Synthetic Supply Remains Dominant While Bio-Based Material Advances
Synthetic material accounted for 71.24% of the niacin and niacinamide supply share by source in 2025. Established manufacturing economics, reliable purity, and regulatory acceptance support its position in pharmaceutical, food, and feed applications. Conventional production uses catalytic hydration of 3-cyanopyridine through nitrile hydratase or acid-catalyzed hydrolysis. These processes have been improved over many years and can achieve conversion efficiencies above 99%. The scale and consistency of this route remain difficult for newer production methods to match in bulk applications. Synthetic material consequently remains central to high-volume supply contracts. The source segment also benefits from known handling methods and established quality specifications. These characteristics matter to buyers serving several regulated markets because a single material may need to satisfy different documentation, quality, and delivery expectations across pharmaceutical, food, and animal nutrition operations. They also support predictable delivery for large food, feed, and pharmaceutical production runs.
Natural and bio-based materials are forecast to record the fastest source growth at 6.42% CAGR through 2031. Research published in 2025 reported that engineered recombinant E. coli systems achieved 98.6% niacin yield within 40 minutes under optimized conditions. The process can operate under milder conditions and create fewer toxic byproducts than conventional chemical routes, which is relevant to companies that evaluate both product quality and the production practices behind their ingredient choices. Fermentation-derived grades also offer traceability that supports clean-label cosmetics, giving brands a way to align ingredient selection with renewable-feedstock claims and the supply information requested by sustainability-focused customers. Viablife has presented a fermentation-based niacinamide grade for cosmetics, showing the commercial interest in this route. European sustainability requirements and procurement expectations encourage this source shift. Synthetic supply is likely to remain important in bulk feed and pharmaceutical use. Bio-based products can build a higher-value position where sustainability records and source traceability matter most. This creates distinct roles for the 2 supply pathways in the niacin and niacinamide industry, with conventional production serving established bulk requirements and newer methods addressing customers that place greater value on process attributes.
By Form: Powder Retains Scale While Liquid Use Expands
Powder held 53.24% of the niacin and niacinamide market size by form in 2025. Its position rests on established handling methods, long shelf stability, and easy use in dry-blend products. Pharmaceutical manufacturers use powder in tablets, capsules, and other dry formulations. Feed producers and nutritional supplement companies also use it in premixes. USP and European Pharmacopoeia specifications support a familiar route for pharmaceutical-grade powder qualification. This reduces regulatory uncertainty for manufacturers preparing submissions across more than 1 region. Granular material serves a related role in dustless feed premixes. Its flow characteristics and lower fine-particle exposure support specific workplace and processing needs. Powder should remain a practical choice for large-volume applications during the forecast period, since manufacturers already have established blending equipment, storage procedures, quality routines for dry materials, and supply chains designed around efficient transport of stable, non-liquid ingredients.
Liquid form is forecast to grow at 8.52% CAGR through 2031, the fastest rate among formats. It supports aqueous delivery in cosmetic serums and clinical nutrition products. High-concentration beverage premixes also require a solution-based form. Niacinamide can be included at 5% to 10% concentrations in serums with limited effects on viscosity. This aligns liquid supply with the expanding skincare category, where water-based formats and rapid formulation work can make pre-dissolved active ingredients more convenient for manufacturers than separate dry handling steps. Guidance for some liquid dietary supplement formats emphasizes pre-dissolved ingredients for dose homogeneity. These requirements support demand for liquid-grade sourcing. Liquid products can also help formulators simplify production steps in products that already use water-based systems. As cosmetic and clinical nutrition uses expand, liquid material should account for a larger revenue contribution within the niacin and niacinamide market, especially when formulators value ready-to-use incorporation over the storage and transport advantages of powder.
By Application: Pharmaceuticals Provide Scale and Cosmetics Drive Growth
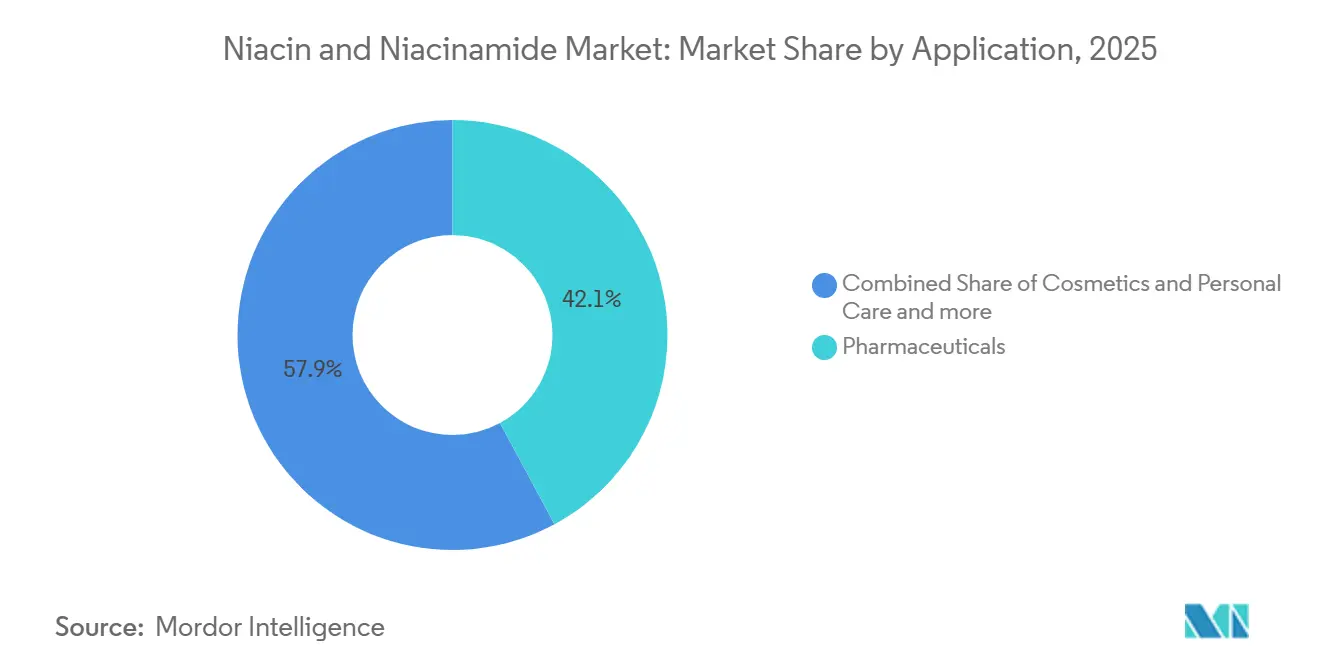
Pharmaceuticals accounted for 42.14% of the niacin and niacinamide market size by application in 2025. Demand includes dyslipidemia management, pellagra treatment, metabolic health, and topical dermatological products. Pharmaceutical-grade niacinamide also supports a developing neuroprotection research pipeline. Extended-release niacin products and topical niacinamide raise the importance of specification control in this application. The segment requires consistent purity and compliance documentation. These needs support qualified suppliers with established testing systems. Human and animal nutrition also contribute to a meaningful demand for broader application. Feed demand is supported by niacin inclusion requirements in livestock premixes. Pharmaceuticals nevertheless remain the largest single application because therapeutic use requires high-value, certified input material, and suppliers must meet demanding quality expectations before their ingredients can be included in finished medicinal products.
Cosmetics and personal care are forecast to grow at 8.82% CAGR through 2031. Niacinamide supports acne care, sebum control, post-inflammatory pigmentation care, and anti-inflammatory skincare. Its range of uses extends beyond premium anti-aging products to wider dermatological care. U.S. rules list niacinamide as generally recognized as safe for specified food use, which can assist companies working across several end-use categories[2]. EU cosmetics rules also provide a familiar regulatory basis for its use in personal care formulations. This regulatory footing supports repeat purchasing by product manufacturers, because it reduces uncertainty when brands develop several products that use the same active ingredient in different formats and sell them in more than 1 country. Food and beverages retain a stable fortification-driven base within the niacin and niacinamide market. Cosmetics remain the main value-growth application in the niacin and niacinamide market because formulations reward functional evidence and dependable ingredient quality, while brands can use niacinamide in several product formats that target different consumer needs.

By Distribution Channel: Contract Supply Holds Volume and Online Channels Gain Reach
Direct sales and contract supply held 32.84% of the niacin and niacinamide distribution share in 2025. Pharmaceutical manufacturers, large food processors, and feed integrators require bulk deliveries with defined specifications. Multi-year supply agreements provide continuity for buyers and revenue visibility for producers. Supplier qualification can take time in regulated applications, making replacement decisions less frequent. Some contracts also use take-or-pay provisions that strengthen delivery planning. This channel therefore suits producers in the niacin and niacinamide market that can provide consistent quality and large shipment volumes. Direct relationships also allow detailed technical discussions about grades and documentation. They remain important for transactions where ingredient performance and audit trails are critical. Distributors and wholesalers serve smaller formulators that do not have the volume to negotiate directly with major producers, and they can provide access to product grades, local inventory, and technical information that smaller customers need.
Online retail and e-commerce is forecast to grow at 7.22% CAGR through 2031. Direct-to-consumer supplement companies and digital-native skincare brands are expanding their finished-product sales through online channels. Their growth creates related procurement demand for niacinamide-containing ingredients. Specialized business-to-business platforms and smaller direct contracts help connect these brands with suppliers. The channel is important because consumer demand can translate quickly into replenishment orders, particularly for digital brands that monitor product sales closely and adjust their inventory purchasing more frequently than traditional retailers. Hospital pharmacies, drug stores, and retail pharmacies continue to serve prescription and over-the-counter demand. These established outlets provide stable access to pharmaceutical-grade niacin and niacinamide. Online growth does not displace those channels in every use case. It instead adds a faster route for supplement and skincare brands to build sales within the niacin and niacinamide market, while conventional outlets continue to serve buyers who need pharmacist support, prescription access, or established retail availability.
Geography Analysis
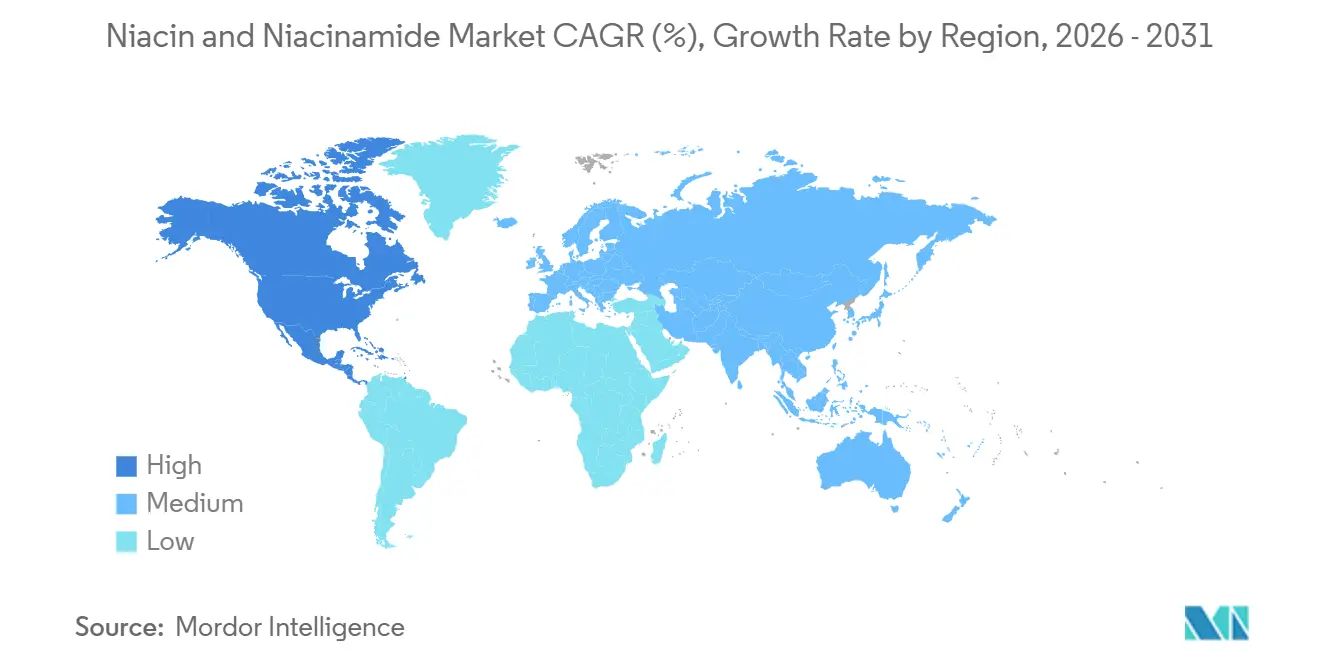
Asia-Pacific accounted for 42.41% of the niacin and niacinamide market share in 2025. China’s large pyridine-based manufacturing base supports this position. Domestic demand also comes from functional foods, feed premixes, and personal care products. India adds pharmaceutical API and nutraceutical manufacturing capacity that strengthens the niacin and niacinamide market in Asia-Pacific. Jubilant Ingrevia commissioned a 5,000-metric-ton cGMP niacinamide facility in Bharuch, Gujarat, in January 2025 for food, nutrition, and cosmetics applications. The facility has USFDA approval and targets export-grade demand in the United States, Europe, and Japan, demonstrating a focus on customers that require globally recognized quality standards rather than only local bulk supply. Japan and South Korea also absorb high-purity niacinamide for premium skincare, where brands commonly emphasize product performance, established cosmetic quality practices, and ingredients that can be used in carefully positioned formulations. Their established cosmetics frameworks support product qualification and regular sourcing, which helps brands maintain product continuity when they introduce niacinamide across several premium skincare formats.
North America is forecast to grow at 7.25% CAGR through 2031, the fastest regional rate. Demand is supported by premium supplements, science-based skincare products, and procurement diversification away from concentrated East Asian supply. FDA Human Foods Program priorities for 2026 emphasize ingredient documentation and supplier compliance. This setting favors suppliers able to provide complete audit records. Canada amended food additive and composition rules in December 2024, strengthening consistency across the regional regulatory environment[3]. These requirements can raise the value of multi-region certification portfolios, because suppliers with complete technical files may be easier for buyers to qualify than vendors that require additional evidence or testing before a material can be approved for routine use. The niacin and niacinamide market size in North America is therefore supported by quality requirements as well as consumer demand.
Europe remains mature, but its demand is shifting toward verified quality and lower-carbon supply. Regulation (EC) No. 1925/2006 governs vitamin and mineral additions to foods and sets niacinamide limits for breakfast cereals. REACH and sustainability procurement expectations encourage bio-based sourcing in the niacin and niacinamide market among food, cosmetics, and consumer goods producers. Middle East and Africa gains from mandatory food fortification efforts in Nigeria and coordinated ECOWAS activity. These programs can create more regular demand through processed food channels as enforcement improves. Brazil supports South American demand through flour fortification and a growing dietary supplement base, providing an established base for suppliers serving both nutrition policy needs and consumer-led wellness demand. Argentina and other South American countries offer additional demand as urbanization and functional food adoption advance, although the core demand base continues to come from fortified foods and growing interest in dietary supplements.
Competitive Landscape
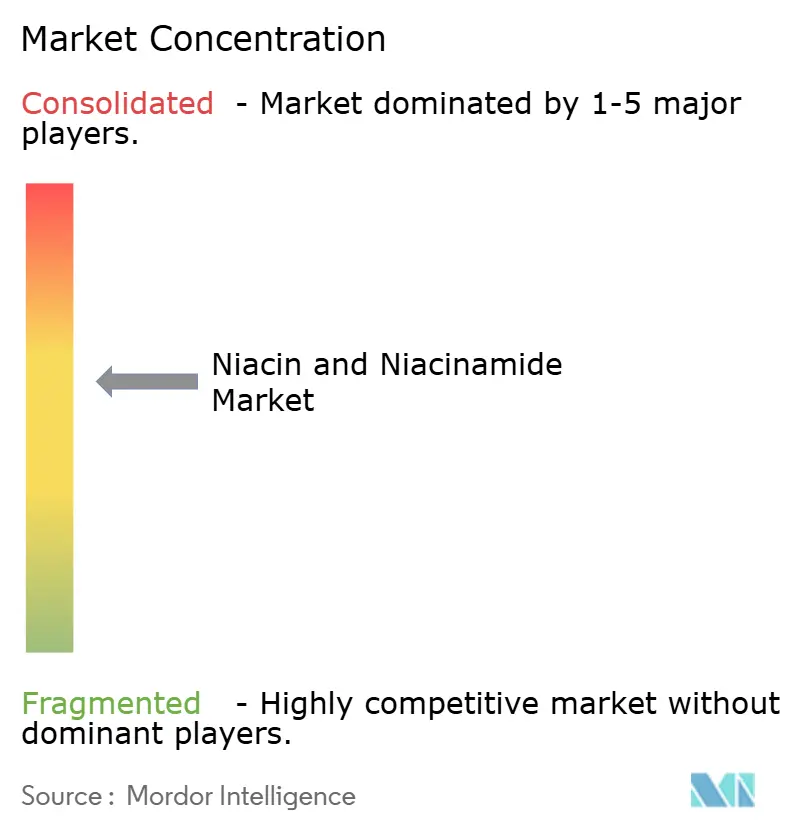
The niacin and niacinamide market is moderately consolidated in pharmaceutical-grade and cosmetic-grade supply. DSM-Firmenich, BASF, Lonza, Jubilant Ingrevia, and Zhejiang NHU form the main group of vertically integrated suppliers in these grades. Commodity feed-grade supply is more fragmented, with Brother Enterprises, Shandong Hongda, and Tianjin Zhongrui competing on price and volume. The contrast reflects the higher qualification requirements for regulated and cosmetic applications. Quality documentation, purity, and reliable supply are central competitive factors in the niacin and niacinamide market at the upper end of the category. Price and production scale carry more weight in commodity sales. Buyers often need different supplier strategies for these 2 tiers. This structure allows certified suppliers to protect higher-value positions. At the same time, lower-grade producers compete for volume, creating different purchasing criteria for customers that need clinical, cosmetic, food, or feed ingredients, and preventing a single competitive approach from meeting every buyer's need.
DSM-Firmenich has shifted its portfolio toward human nutrition and specialty applications. BASF inaugurated a production plant in Düsseldorf in July 2026, demonstrating continued investment in specialized production capabilities. These examples show that leading companies are directing resources toward specialized, regulated, and high-value applications. They also increase the importance of certification and formulation support in supplier selection, because leading buyers seek partners able to provide material, technical records, and consistent support during qualification and reformulation work.
Niacin and Niacinamide Industry Leaders
-
BASF SE
-
dsm-firmenich AG
-
Lonza Group AG
-
Jubilant Pharmova Limited
-
Vanetta Food Ingredients
- *Disclaimer: Major Players sorted in no particular order
Recent Industry Developments
- June 2026: Bee Naturals, a woman-owned FDA-registered skincare manufacturer, released a report examining the rise of high-concentration niacinamide products in the skincare market, finding that ingredient balance and overall formulation design may play a greater role in product performance and skin tolerability than increasingly higher niacinamide percentages alone.
- March 2026: Bare Skin and Beauty expanded its treatment offerings with the introduction of Medik8’s Niacinamide Peptides serum, addressing the growing demand for barrier-support and redness-reducing skincare solutions in professional clinical settings.
Global Niacin and Niacinamide Market Report Scope
As per the scope of the report, niacin and niacinamide are two forms of vitamin B3, a nutrient that helps the body turn food into energy and supports healthy skin and nerve function. Niacin, also called nicotinic acid, can cause flushing, warmth, or itching, especially at higher doses, while niacinamide, also called nicotinamide, generally does not cause flushing and is commonly used in skincare.
The niacin and niacinamide market is segmented by product type into niacin and niacinamide; by source into synthetic and natural and bio-based; by form into powder, granules, and liquid; by application into pharmaceuticals, human nutrition, animal nutrition, food and beverages, and cosmetics and personal care; by distribution channel into direct sales and contract supply, distributors and wholesalers, hospital pharmacies, drug stores and retail pharmacies, and online retail and e-commerce; and by geography into North America, Europe, Asia-Pacific, the Middle East and Africa, and South America. The market report also covers the estimated market sizes and trends for 17 countries across major regions globally. For each segment, the market size and forecast are provided in terms of value (USD).
| Niacin |
| Niacinamide |
| Synthetic |
| Natural and Bio-Based |
| Powder |
| Granular |
| Liquid |
| Pharmaceuticals |
| Human Nutrition |
| Animal Nutrition |
| Food and Beverages |
| Cosmetics and Personal Care |
| Direct Sales and Contract Supply |
| Distributors and Wholesalers |
| Hospital Pharmacies |
| Drug Stores and Retail Pharmacies |
| Online Retail and E-Commerce |
| North America | United States |
| Canada | |
| Mexico | |
| Europe | Germany |
| United Kingdom | |
| France | |
| Italy | |
| Spain | |
| Rest of Europe | |
| Asia-Pacific | China |
| Japan | |
| India | |
| Australia | |
| South Korea | |
| Rest of Asia-Pacific | |
| Middle East and Africa | GCC |
| South Africa | |
| Rest of Middle East and Africa | |
| South America | Brazil |
| Argentina | |
| Rest of South America |
| By Product Type | Niacin | |
| Niacinamide | ||
| By Source | Synthetic | |
| Natural and Bio-Based | ||
| By Form | Powder | |
| Granular | ||
| Liquid | ||
| By Application | Pharmaceuticals | |
| Human Nutrition | ||
| Animal Nutrition | ||
| Food and Beverages | ||
| Cosmetics and Personal Care | ||
| By Distribution Channel | Direct Sales and Contract Supply | |
| Distributors and Wholesalers | ||
| Hospital Pharmacies | ||
| Drug Stores and Retail Pharmacies | ||
| Online Retail and E-Commerce | ||
| By Geography | North America | United States |
| Canada | ||
| Mexico | ||
| Europe | Germany | |
| United Kingdom | ||
| France | ||
| Italy | ||
| Spain | ||
| Rest of Europe | ||
| Asia-Pacific | China | |
| Japan | ||
| India | ||
| Australia | ||
| South Korea | ||
| Rest of Asia-Pacific | ||
| Middle East and Africa | GCC | |
| South Africa | ||
| Rest of Middle East and Africa | ||
| South America | Brazil | |
| Argentina | ||
| Rest of South America | ||
Key Questions Answered in the Report
What is the size of the niacin and niacinamide market?
The sector is valued at USD 1.59 billion in 2026 and is forecast to reach USD 1.99 billion by 2031, at a 4.55% CAGR.
Which niacin and niacinamide product type is growing fastest?
Niacinamide is the fastest-growing product type, with an 8.65% CAGR through 2031, and held 58.31% share in 2025.
Why is niacinamide used in skincare products?
It is used for barrier care, pigmentation management, sebum regulation, and anti-inflammatory formulations, supported by published dermatological evidence.
Which application has the highest growth rate through 2031?
Cosmetics and personal care are forecast to grow at 8.82% CAGR through 2031.
Which region leads demand for niacin and niacinamide?
Asia-Pacific led in 2025 with 42.41% share, supported by Chinese production and Indian pharmaceutical and nutraceutical manufacturing.
What is the main restraint on niacin adoption?
Flushing at therapeutic doses remains a key tolerability issue, although extended-release products can reduce flushing events.