Natural Rubber Market Size and Share
Natural Rubber Market Analysis by Mordor Intelligence
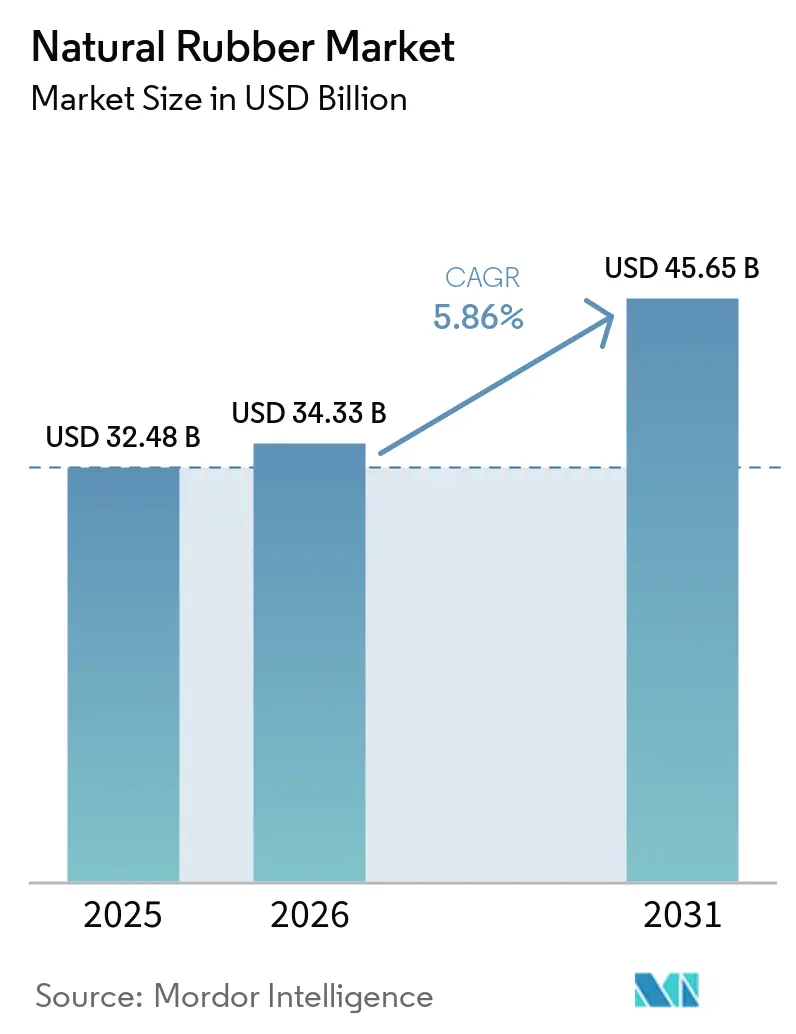
The natural rubber market size is projected to expand from USD 32.48 billion in 2025 and USD 34.33 billion in 2026 to USD 45.65 billion by 2031, registering a compound annual growth rate (CAGR) of 5.86% during 2026-2031. The natural rubber market in 2026 is being shaped by a sixth straight year in which global demand is set to stay above supply, with production forecast at 15.2 million metric tons against demand of 15.6 million metric tons, leaving a 0.4 million metric ton gap in the system[1]Source: Association of Natural Rubber Producing Countries, “Natural Rubber Demand to Exceed Output, Keeping Prices High in 2026, Says Industry Body,” ASEAN Rubber Business Council, aseanrubber.net. That tight balance is keeping pricing support in place because adverse weather, limited replanting, weak smallholder productivity, land-use shifts, and leaf fall disease continue to limit any quick supply response. The largest regional position remained with Asia-Pacific in 2025, and the natural rubber market continues to center on the region because it holds the deepest production base and the largest processing network. Supplier competition is also changing because the European Union Deforestation Regulation, plot-level traceability, and auditable sourcing systems are now affecting who can serve premium export channels, favoring larger integrated processors with stronger digital and procurement capabilities. At the same time, the natural rubber market still faces a fragile supply base, as major producing areas reported disease pressure and yield losses, while parts of the trade chain continue to face uneven tire orders and export demand, keeping volume growth more moderate than price conditions might suggest.
Key Report Takeaways
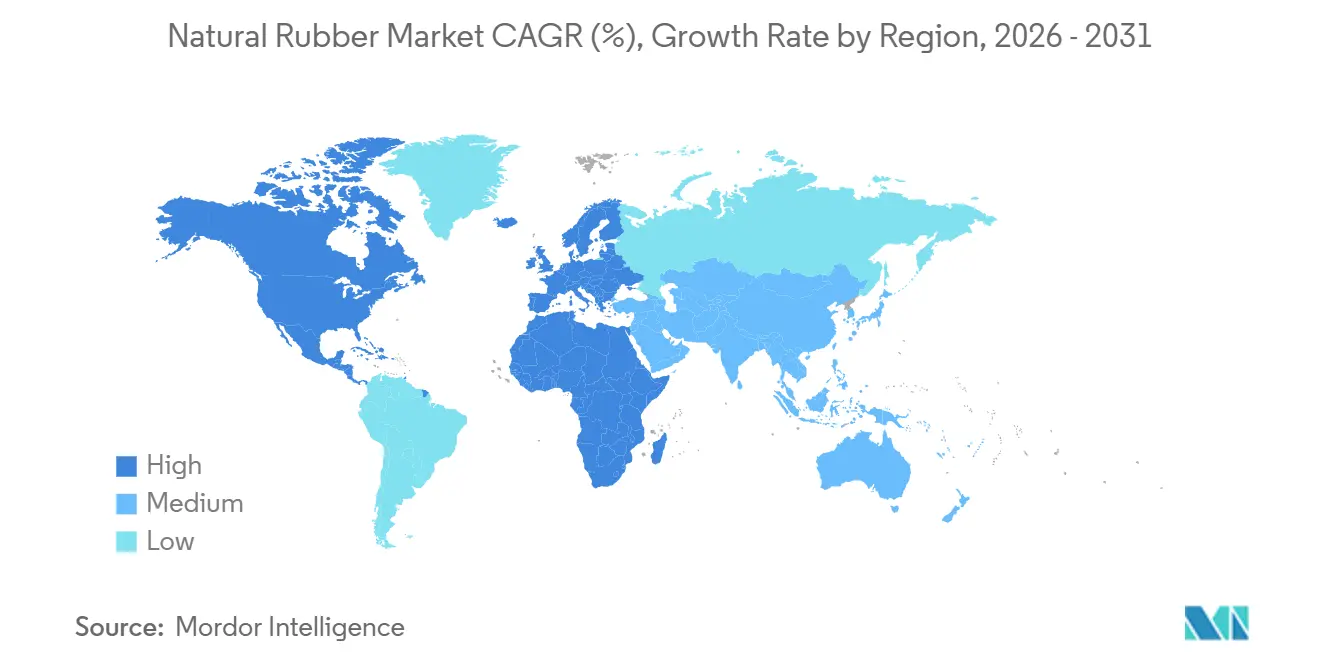
- By geography, Asia-Pacific held 67.8% of the natural rubber market share in 2025, while Africa recorded the fastest projected CAGR of 8.4% during 2026-2031.
Note: Market size and forecast figures in this report are generated using Mordor Intelligence’s proprietary estimation framework, updated with the latest available data and insights as of 2026.
Global Natural Rubber Market Trends and Insights
Drivers Impact Analysis*
| Driver | (~) % Impact on CAGR Forecast | Geographic Relevance | Impact Timeline |
|---|---|---|---|
| EV-Driven Tire Wear and Replacement Demand | +1.30% | Global demand effect, with the strongest pull from China, India, the United States, Germany, and Japan where electric vehicle production and tire replacement needs are rising. | Medium term (2-4 years) |
| Rebound in Chinese Construction and Mining Demand | +1.00% | Highest relevance in China and nearby Asian suppliers such as Thailand, Indonesia, and Vietnam because Chinese import demand quickly affects regional procurement and pricing. | Short term (≤ 2 years) |
| Medical Glove Restocking and Latex Demand Normalization | +0.60% | Strongest in Asian latex and glove clusters, especially Thailand and other export-oriented processing bases tied to medical and industrial glove demand. | Medium term (2-4 years) |
| Higher Crude-Linked Synthetic Rubber Costs Supporting Substitution | +0.60% | Global effect, with faster transmission into China, India, and other tire-making economies where formulation shifts can move part of demand toward natural rubber. | Short term (≤ 2 years) |
| The European Union Deforestation Regulation-Compliant and Traceable Rubber Premium Creation | +0.50% | Highest in Europe-facing supply chains and in exporting origins such as Thailand, Indonesia, India, and Côte d'Ivoire where traceability readiness changes buyer access. | Medium term (2-4 years) |
| AI-Enabled Tapping, Farm Monitoring, and Yield Optimization | +0.30% | Most relevant in labor-constrained producing regions such as Hainan, Yunnan, Thailand, Indonesia, and parts of West Africa where productivity gains matter most. | Long term (≥ 4 years) |
| Source: Mordor Intelligence | |||
EV-Driven Tire Wear and Replacement Demand
Electric vehicles are raising tire performance requirements because heavier battery packs and instant torque profiles increase stress on tread life and abrasion resistance. That matters directly for the natural rubber market because tire makers need compounds that can withstand faster wear while maintaining grip, heat control, and durability in a heavier vehicle base. The demand effect is also recurring rather than one-time, because shorter replacement cycles can boost repeat tire purchases even when new-vehicle sales move unevenly. The Association of Natural Rubber Producing Countries said demand recovery in 2026 is supported in part by continued government incentives for electric vehicle purchases in China, which remains the most influential demand center in global trade flows [2]Source: Association of Natural Rubber Producing Countries, “ANRPC Releases Monthly NR Statistical Report, November 2025,” ASEAN Rubber Business Council, aseanrubber.net. That keeps the natural rubber market closely tied to how fast electric mobility expands in Asia and in large replacement tire markets. It also means premium rubber grades are likely to see firmer interest than lower-specification supply as vehicle makers and tire companies refine products for heavier fleets.
Rebound in Chinese Construction and Mining Demand
China remains the single most important swing buyer in the global rubber trade because changes in its industrial activity quickly affect regional procurement, shipping, and working inventory. According to International Trade Center (ITC) Trade Map data, China's natural rubber import volumes increased from 2.39 million tons in 2024 to 3.17 million tons in 2025, representing a 32.3% year-over-year increase, highlighting how quickly import flows can accelerate when buying conditions and downstream demand improve. China’s Ministry of Agriculture and Rural Affairs has pointed to possible support from auto and truck demand and a partial recovery in export orders, which matters because trucks, off-road vehicles, and industrial equipment all feed rubber consumption through tire demand. In the natural rubber market, even a measured rebound in Chinese construction, logistics, and mining activity can tighten nearby availability, as domestic production does not cover domestic demand. That effect is strongest for suppliers in Thailand, Vietnam, and Indonesia because China’s buying patterns often reset price expectations across Asia. As a result, the natural rubber market remains highly sensitive to Chinese import momentum even when demand conditions elsewhere are mixed.
Medical Glove Restocking and Latex Demand Normalization
Latex demand from medical and examination gloves remains smaller than tire demand, but it still provides an important balancing outlet for concentrated latex processors. Sri Trang Agro-Industry Public Company Limited reported glove production capacity of 51.1 billion pieces per year and glove sales volume of 38,549 million pieces in 2024, which was the highest sales volume in the company’s history. That result matters for the natural rubber market because it shows that glove-related latex demand continues to absorb material volumes and supports integrated processors with both rubber and glove operations. A more normal ordering cycle also improves planning because producers can balance latex, block rubber, and other output forms instead of reacting to sharp swings in one end market. This is useful when tire demand softens for a period, because a steadier medical and industrial glove channel can support capacity use across the value chain. Over time, that mix helps the natural rubber market remain more resilient than a system that relies on a single downstream use.
Higher Crude-Linked Synthetic Rubber Costs Supporting Substitution
Synthetic rubber cost spikes can improve natural rubber's relative position when tire and industrial formulations allow partial substitution. In March 2026, Shanghai butadiene rubber prices were observed at USD 2,568.1 per metric ton (CNY 17,720 per metric ton), up 36.2% from February, after feedstock naphtha tightened due to shipping disruptions in the Strait of Hormuz. When petrochemical-based inputs rise that quickly, the natural rubber market gains a temporary cost advantage in products where manufacturers can adjust blend ratios without changing performance beyond acceptable limits. The benefit is not universal because natural rubber cannot replace every synthetic grade, especially in highly specialized uses. Even so, the pricing move in March 2026 showed how the natural rubber market can draw incremental demand when synthetic alternatives become sharply more expensive. These episodes usually matter most in tire production and general industrial rubber goods, where formulation flexibility is greater than in niche high-specification uses.
Restraints Impact Analysis*
| Restraint | (~) % Impact on CAGR Forecast | Geographic Relevance | Impact Timeline |
|---|---|---|---|
| Leaf Fall Disease, White Root Rot, and Climate-Linked Yield Loss | -1.10% | Highest in Thailand, Indonesia, Malaysia, Vietnam, Hainan, and other humid producing zones where disease and weather shocks can sharply reduce yield. | Short term (≤ 2 years) |
| Aging Tapper Workforce and Chronic Labor Scarcity | -0.80% | Most severe in Thailand, India, China, Indonesia, and other mature producing areas where younger labor is leaving plantations and tapping remains physically demanding. | Medium term (2-4 years) |
| Deforestation Compliance Costs and Land-Use Constraints | -0.50% | Strongest in Europe-facing export chains and in origins such as Thailand and Indonesia where fragmented farms, land titles, and shifting plantation geography complicate compliance. | Medium term (2-4 years) |
| Trade Barriers, Tire-Export Disruptions, and Buyer Destocking | -0.50% | Global impact, with visible pressure in export-oriented Asian origins and in import-dependent manufacturing regions that adjust purchases based on inventory and tire orders. | Short term (≤ 2 years) |
| Source: Mordor Intelligence | |||
Leaf Fall Disease, White Root Rot, and Climate-Linked Yield Loss
Disease pressure is reducing effective production capacity even in the largest rubber-producing countries. The Association of Natural Rubber Producing Countries stated that output in Thailand, the world’s largest rubber producer, is projected to remain flat in 2026, while Indonesia, the second-largest producer, is set to continue its production decline that began after 2022 due to low prices, leaf diseases, and land conversion to oil palm. China’s Ministry of Agriculture and Rural Affairs also reported that Hainan experienced moderate to severe powdery mildew and intermittent defoliation in May 2025, disrupting latex collection during the tapping season. The European Forest Institute added that Thailand’s cultivation area fell by 4.5% from 2017 to 2022 due to land constraints, climate change, labor costs, natural disasters, and leaf fall disease [3]Source: European Forest Institute, “Thailand's Natural Rubber Producers Are Preparing for New Market Requirements,” European Forest Institute, efi.int. For the natural rubber market, the problem is not only lower yield in a bad year. Disease-weakened trees are more exposed to heavy rain, flooding, and seasonal stress, which slows recovery and makes output less reliable across multiple cycles. That is why the natural rubber market continues to price in supply fragility, even as headline production shows modest year-on-year growth.
Aging Tapper Workforce and Chronic Labor Scarcity
Labor scarcity remains one of the most difficult constraints in rubber production because tapping requires daily precision, physical effort, and work at difficult hours. Xinhua linked the push for rubber-tapping robots in China directly to chronic labor shortages, underscoring that the problem is no longer confined to a single country or a single belt of growth. In India, the Automotive Tire Manufacturers Association said more than 200,000 hectares of rubber cultivation remain untapped, while the consuming sector requires 1.4 million metric tons each year against domestic output of 0.85 million metric tons. The European Forest Institute also noted that Thailand’s smallholder sector is fragmented and relies heavily on foreign workers, which adds another layer of risk to labor availability and compliance. In the natural rubber market, this labor shortage limits how much of the latent plantation area can actually return to production. It also helps explain why higher prices alone have not produced a fast supply response in the natural rubber market, especially where smallholders dominate production.
*Our forecasts treat driver/restraint impacts as directional, not additive. The impact forecasts reflect baseline growth, mix effects, and variable interactions.
Geography Analysis
Asia-Pacific accounted for 67.8% of the natural rubber market in 2025, making it the largest regional segment by a wide margin. The natural rubber market in Asia-Pacific is built on the overlap between large plantation acreage, dense processing capacity, major tire manufacturing hubs, and the world’s deepest export channels. Disease pressure and climate-related stress are reducing effective production capacity across several major rubber-producing countries. The Association of Natural Rubber Producing Countries stated that output in Thailand, the world’s largest rubber producer, is projected to remain flat in 2026, while Indonesia, the second-largest producer, is set to continue its production decline that began after 2022 due to low prices, leaf diseases, and land conversion to oil palm. China’s natural rubber imports increased from 2.39 million tons in 2024 to 3.17 million metric tons in 2025, marking a 32.3% year-over-year rise and underscoring the country’s continued reliance on imports to meet domestic consumption requirements. India also remains a key pull factor for the natural rubber market, as the Association of Natural Rubber Producing Countries projected 3.6% demand growth in 2026 compared to 2025, while the Automotive Tire Manufacturers Association said the annual requirement stands at 1.4 million metric tons, against domestic output of 0.85 million metric tons.
Africa is the fastest regional segment in the natural rubber market, with a projected CAGR of 8.4% during 2026-2031. The natural rubber market in Africa is gaining ground as new plantation supply is increasingly paired with local processing capacity rather than solely for raw material exports. Côte d'Ivoire increased natural rubber production from approximately 0.82 million metric tons in 2019 to 1.55 million metric tons in 2023, reinforcing its emergence as Africa’s largest producer and the world’s third-largest producer. The country is also expanding downstream processing capacity to support growing output, with a new 100,000 metric ton-per-year plant commencing operations in Grand-Béréby in October 2024 and two additional plants projected in 2025, which together are projected to raise the company’s total processing capacity in Côte d'Ivoire to nearly 0.48 million metric tons annually.
North America, Europe, South America, and the Middle East hold smaller positions in the natural rubber market, but they continue to shape trade flows because most of them rely heavily on imports. The Association of Natural Rubber Producing Countries said stronger tire shipment projections in the United States were one of the demand supports for 2026, which keeps North America important even without a large plantation base. In South America, Brazil remains a mixed case for the natural rubber market because domestic production is not enough to cover consumption, and the federal government authorized USD 4.2 million (BRL 22.2 million) in support for cultivated natural rubber from the 2025/2026 harvest. Europe is important to the natural rubber market because compliance-driven sourcing and verified traceability can influence supplier selection beyond simple price competition, especially for importers with strict due diligence requirements. The Middle East is a steadier demand pocket in the natural rubber market, with procurement linked to infrastructure logistics, tire use, and import flows from Asia rather than to local raw material production.


Competitive Landscape
The natural rubber market has a split structure in which upstream supply is broad and fragmented, while processing, financing, and export control are more concentrated in a narrower group of organized players. Smallholders still account for most global output, keeping the natural rubber market fragmented at the farm level even as some processors operate at a large scale. Sri Trang Agro-Industry Public Company Limited is one of the clearest examples of scale in the natural rubber market, with 41 factories across Thailand, Indonesia, Myanmar, and Côte d'Ivoire, and a natural rubber production capacity of 3.72 million metric tons per year as of December 2024. Vietnam Rubber Group and Hainan Rubber Industry Group Co., Ltd. also remain important because they combine plantation control with processing reach in countries near major end-use demand centers. This keeps the natural rubber market from becoming highly concentrated in one firm, but it still gives a measurable advantage to companies that can manage procurement, logistics, and compliance across borders.
Competition in the natural rubber market is now moving beyond simple raw-material access and toward traceability, funding strength, and operating discipline. Sri Trang Agro-Industry Public Company Limited strengthened its position by launching 100% traceable GPS-tagged rubber in 2024, starting commercial sales of compliant rubber in 2024, and expanding its artificial intelligence systems in production and management through 2025 and 2026. Thai processors such as Von Bundit Co., Ltd., Southland Rubber Co., Ltd., Thai Hua Rubber Public Company Limited, Thai Rubber Latex Group Public Company Limited, Tong Thai Rubber Co., Ltd., and Unitex Rubber Co., Ltd. remain relevant because buyer relationships and product specialization still shape order flow. In practice, the natural rubber market is rewarding firms that can secure supply, document origin, finance inventories, and deliver consistent quality rather than firms that compete only on spot price.
The natural rubber market is also seeing a sharper divide between companies that can absorb compliance costs and companies that struggle with fragmented sourcing. Hainan Rubber Industry Group Co., Ltd., Sinochem International Corporation, and Halcyon Agri Corporation Limited illustrate how state-linked ownership and access to funding can support larger sourcing networks in a tight and regulated market. Yunnan State Farms Group Co., Ltd., Guangdong Guangken Rubber Group Co., Ltd., and Bakrie Sumatera Plantations Tbk hold important plantation-linked positions in their home markets, which helps them defend supply access even when external procurement becomes more difficult. Kurian Abraham Private Limited serves a smaller niche within the natural rubber market, but it remains relevant because quality-sensitive buyers still value specialized processors with strong export relationships. Overall, the natural rubber market remains competitive and only moderately concentrated because large processors matter more than before, but global supply is still spread across millions of farm-level suppliers.
Recent Industry Developments
- May 2026: The World Bank projected Technically Specified Rubber 20 (TSR20) natural rubber prices to increase approximately 7.3% in 2026 to around USD 1.90 per kilogram, supported by steady automotive-sector demand growth and ongoing supply tightness across major producing countries.
- March 2026: Association of Natural Rubber Producing Countries (ANRPC) reported China’s natural rubber consumption increased from 0.45 million metric tons in February 2026 to approximately 0.61 million metric tons in March 2026, supported by a 74.4% monthly increase in vehicle production and rapid expansion of new-energy vehicle exports.
- December 2025: The Rubber Research Institute of India (RRII) developed an eco-friendly paint derived from natural rubber latex using plant extracts, seashells, and natural clay. The innovation was positioned as a sustainable value-added application for natural rubber while creating additional revenue opportunities for rubber growers.


Research Methodology Framework and Report Scope
Market Definitions and Key Coverage
Our study defines the natural rubber market as the annual value generated from harvesting latex, primary processing into sheet, block, or concentrated latex, and the first commercial sale of those grades to tire, glove, footwear, industrial goods, and allied converters. We track production volumes, average realization, and trade flows for all major producing and consuming nations, thereby offering a single comparable revenue pool.
Scope Exclusions: Specialty reclaimed rubber, synthetic or bio-based rubber, and downstream finished goods margins are outside the numerical baseline.
Segmentation Overview
- By Geography
- North America
- United States
- Production Analysis (Area Harvested, Yield, and Production Volume)
- Consumption Analysis (Consumption Value and Volume)
- Import Analysis (Import Value, Volume, and Key Supplying Markets)
- Export Analysis (Export Value, Volume, and Key Destination Markets)
- Wholesale Price Trend Analysis and Forecast
- Regulatory Framework
- List of Key Players
- Logistics and Infrastructure
- Seasonality Analysis
- Canada
- Production Analysis (Area Harvested, Yield, and Production Volume)
- Consumption Analysis (Consumption Value and Volume)
- Import Analysis (Import Value, Volume, and Key Supplying Markets)
- Export Analysis (Export Value, Volume, and Key Destination Markets)
- Wholesale Price Trend Analysis and Forecast
- Regulatory Framework
- List of Key Players
- Logistics and Infrastructure
- Seasonality Analysis
- Mexico
- Production Analysis (Area Harvested, Yield, and Production Volume)
- Consumption Analysis (Consumption Value and Volume)
- Import Analysis (Import Value, Volume, and Key Supplying Markets)
- Export Analysis (Export Value, Volume, and Key Destination Markets)
- Wholesale Price Trend Analysis and Forecast
- Regulatory Framework
- List of Key Players
- Logistics and Infrastructure
- Seasonality Analysis
- United States
- South America
- Brazil
- Production Analysis (Area Harvested, Yield, and Production Volume)
- Consumption Analysis (Consumption Value and Volume)
- Import Analysis (Import Value, Volume, and Key Supplying Markets)
- Export Analysis (Export Value, Volume, and Key Destination Markets)
- Wholesale Price Trend Analysis and Forecast
- Regulatory Framework
- List of Key Players
- Logistics and Infrastructure
- Seasonality Analysis
- Colombia
- Production Analysis (Area Harvested, Yield, and Production Volume)
- Consumption Analysis (Consumption Value and Volume)
- Import Analysis (Import Value, Volume, and Key Supplying Markets)
- Export Analysis (Export Value, Volume, and Key Destination Markets)
- Wholesale Price Trend Analysis and Forecast
- Regulatory Framework
- List of Key Players
- Logistics and Infrastructure
- Seasonality Analysis
- Brazil
- Europe
- Germany
- Production Analysis (Area Harvested, Yield, and Production Volume)
- Consumption Analysis (Consumption Value and Volume)
- Import Analysis (Import Value, Volume, and Key Supplying Markets)
- Export Analysis (Export Value, Volume, and Key Destination Markets)
- Wholesale Price Trend Analysis and Forecast
- Regulatory Framework
- List of Key Players
- Logistics and Infrastructure
- Seasonality Analysis
- France
- Production Analysis (Area Harvested, Yield, and Production Volume)
- Consumption Analysis (Consumption Value and Volume)
- Import Analysis (Import Value, Volume, and Key Supplying Markets)
- Export Analysis (Export Value, Volume, and Key Destination Markets)
- Wholesale Price Trend Analysis and Forecast
- Regulatory Framework
- List of Key Players
- Logistics and Infrastructure
- Seasonality Analysis
- Italy
- Production Analysis (Area Harvested, Yield, and Production Volume)
- Consumption Analysis (Consumption Value and Volume)
- Import Analysis (Import Value, Volume, and Key Supplying Markets)
- Export Analysis (Export Value, Volume, and Key Destination Markets)
- Wholesale Price Trend Analysis and Forecast
- Regulatory Framework
- List of Key Players
- Logistics and Infrastructure
- Seasonality Analysis
- Russia
- Production Analysis (Area Harvested, Yield, and Production Volume)
- Consumption Analysis (Consumption Value and Volume)
- Import Analysis (Import Value, Volume, and Key Supplying Markets)
- Export Analysis (Export Value, Volume, and Key Destination Markets)
- Wholesale Price Trend Analysis and Forecast
- Regulatory Framework
- List of Key Players
- Logistics and Infrastructure
- Seasonality Analysis
- Germany
- Asia-Pacific
- China
- Production Analysis (Area Harvested, Yield, and Production Volume)
- Consumption Analysis (Consumption Value and Volume)
- Import Analysis (Import Value, Volume, and Key Supplying Markets)
- Export Analysis (Export Value, Volume, and Key Destination Markets)
- Wholesale Price Trend Analysis and Forecast
- Regulatory Framework
- List of Key Players
- Logistics and Infrastructure
- Seasonality Analysis
- India
- Production Analysis (Area Harvested, Yield, and Production Volume)
- Consumption Analysis (Consumption Value and Volume)
- Import Analysis (Import Value, Volume, and Key Supplying Markets)
- Export Analysis (Export Value, Volume, and Key Destination Markets)
- Wholesale Price Trend Analysis and Forecast
- Regulatory Framework
- List of Key Players
- Logistics and Infrastructure
- Seasonality Analysis
- Japan
- Production Analysis (Area Harvested, Yield, and Production Volume)
- Consumption Analysis (Consumption Value and Volume)
- Import Analysis (Import Value, Volume, and Key Supplying Markets)
- Export Analysis (Export Value, Volume, and Key Destination Markets)
- Wholesale Price Trend Analysis and Forecast
- Regulatory Framework
- List of Key Players
- Logistics and Infrastructure
- Seasonality Analysis
- Thailand
- Production Analysis (Area Harvested, Yield, and Production Volume)
- Consumption Analysis (Consumption Value and Volume)
- Import Analysis (Import Value, Volume, and Key Supplying Markets)
- Export Analysis (Export Value, Volume, and Key Destination Markets)
- Wholesale Price Trend Analysis and Forecast
- Regulatory Framework
- List of Key Players
- Logistics and Infrastructure
- Seasonality Analysis
- Indonesia
- Production Analysis (Area Harvested, Yield, and Production Volume)
- Consumption Analysis (Consumption Value and Volume)
- Import Analysis (Import Value, Volume, and Key Supplying Markets)
- Export Analysis (Export Value, Volume, and Key Destination Markets)
- Wholesale Price Trend Analysis and Forecast
- Regulatory Framework
- List of Key Players
- Logistics and Infrastructure
- Seasonality Analysis
- Malaysia
- Production Analysis (Area Harvested, Yield, and Production Volume)
- Consumption Analysis (Consumption Value and Volume)
- Import Analysis (Import Value, Volume, and Key Supplying Markets)
- Export Analysis (Export Value, Volume, and Key Destination Markets)
- Wholesale Price Trend Analysis and Forecast
- Regulatory Framework
- List of Key Players
- Logistics and Infrastructure
- Seasonality Analysis
- Vietnam
- Production Analysis (Area Harvested, Yield, and Production Volume)
- Consumption Analysis (Consumption Value and Volume)
- Import Analysis (Import Value, Volume, and Key Supplying Markets)
- Export Analysis (Export Value, Volume, and Key Destination Markets)
- Wholesale Price Trend Analysis and Forecast
- Regulatory Framework
- List of Key Players
- Logistics and Infrastructure
- Seasonality Analysis
- China
- Middle East
- Saudi Arabia
- Production Analysis (Area Harvested, Yield, and Production Volume)
- Consumption Analysis (Consumption Value and Volume)
- Import Analysis (Import Value, Volume, and Key Supplying Markets)
- Export Analysis (Export Value, Volume, and Key Destination Markets)
- Wholesale Price Trend Analysis and Forecast
- Regulatory Framework
- List of Key Players
- Logistics and Infrastructure
- Seasonality Analysis
- Turkey
- Production Analysis (Area Harvested, Yield, and Production Volume)
- Consumption Analysis (Consumption Value and Volume)
- Import Analysis (Import Value, Volume, and Key Supplying Markets)
- Export Analysis (Export Value, Volume, and Key Destination Markets)
- Wholesale Price Trend Analysis and Forecast
- Regulatory Framework
- List of Key Players
- Logistics and Infrastructure
- Seasonality Analysis
- United Arab Emirates
- Production Analysis (Area Harvested, Yield, and Production Volume)
- Consumption Analysis (Consumption Value and Volume)
- Import Analysis (Import Value, Volume, and Key Supplying Markets)
- Export Analysis (Export Value, Volume, and Key Destination Markets)
- Wholesale Price Trend Analysis and Forecast
- Regulatory Framework
- List of Key Players
- Logistics and Infrastructure
- Seasonality Analysis
- Saudi Arabia
- Africa
- Côte d'Ivoire
- Production Analysis (Area Harvested, Yield, and Production Volume)
- Consumption Analysis (Consumption Value and Volume)
- Import Analysis (Import Value, Volume, and Key Supplying Markets)
- Export Analysis (Export Value, Volume, and Key Destination Markets)
- Wholesale Price Trend Analysis and Forecast
- Regulatory Framework
- List of Key Players
- Logistics and Infrastructure
- Seasonality Analysis
- Nigeria
- Production Analysis (Area Harvested, Yield, and Production Volume)
- Consumption Analysis (Consumption Value and Volume)
- Import Analysis (Import Value, Volume, and Key Supplying Markets)
- Export Analysis (Export Value, Volume, and Key Destination Markets)
- Wholesale Price Trend Analysis and Forecast
- Regulatory Framework
- List of Key Players
- Logistics and Infrastructure
- Seasonality Analysis
- South Africa
- Production Analysis (Area Harvested, Yield, and Production Volume)
- Consumption Analysis (Consumption Value and Volume)
- Import Analysis (Import Value, Volume, and Key Supplying Markets)
- Export Analysis (Export Value, Volume, and Key Destination Markets)
- Wholesale Price Trend Analysis and Forecast
- Regulatory Framework
- List of Key Players
- Logistics and Infrastructure
- Seasonality Analysis
- Côte d'Ivoire
- North America
Detailed Research Methodology and Data Validation
Primary Research
Our team ran structured interviews with plantation managers across Southeast Asia, procurement heads at global tire OEMs, and latex glove exporters in Africa and South America. These discussions clarified tapper productivity, new sustainability premiums, and realistic average selling prices, which we folded back into the model after reconciling them with desk findings.
Desk Research
We began with public statistics from bodies such as the International Rubber Study Group, FAO, USDA, and UN Comtrade, because these datasets give us harmonized production, yield, and trade trends. Government agriculture ministries, central banks, and regional tire associations then helped us capture demand inflection points tied to currency swings and vehicle build schedules. To enrich those open sources, our analysts accessed D&B Hoovers for producer financials, Volza for container-level shipment records, and Dow Jones Factiva for price and policy alerts that moved markets week by week. Company filings, investor decks, and peer-reviewed agronomy journals were mined next to understand cost curves and disease pressures. The sources named are illustrative, and many other repositories fed the evidence stack used for checks and balances.
Market-Sizing & Forecasting
We apply a top-down construct built from country production, import, and inventory data, which are then converted with consensus ASPs to value terms. Selective bottom-up roll-ups, such as sampled estate yields or regional tire plant off-take, serve as sense checks and fill gaps where customs codes blur distinctions. Key variables powering the forecast include replanting rates, automotive build forecasts, latex glove capacity additions, synthetic-to-natural substitution spreads, and deforestation policy timelines. Multivariate regression with scenario analysis projects each driver, letting us stress test high and low acreage outcomes before locking the base case.
Data Validation & Update Cycle
Model outputs pass three rounds of analyst review, variance screens versus historical ratios, and follow-up calls when anomalies exceed set thresholds. Mordor Intelligence refreshes the dataset yearly, with interim updates issued if disease outbreaks, trade bans, or price shocks materially alter the outlook.
Why Mordor's Natural Rubber Baseline Earns Decision-Maker Confidence
Published numbers vary because firms choose differing latex grades, currency conversions, and refresh cadences. We acknowledge the spread and preview below how scope, variables, and checking rigor explain the gaps.
Key gap drivers include some publishers bundling synthetic rubber, others counting only plantation gate sales, and a few relying on limited producer interviews without cross-checking customs or price series. Our disciplined inclusion criteria, yearly refresh, and twin-track validation give buyers a figure they can trace and defend.
Benchmark comparison
| Market Size | Anonymized source | Primary gap driver |
|---|---|---|
| USD 48.5 B (2025) | Mordor Intelligence | |
| USD 31.1 B (2024) | Global Consultancy A | Omits glove and footwear demand; narrow producer sample; limited currency normalization |
| USD 56.2 B (2024) | Industry Publisher B | Blends latex derivatives and partial synthetic grades; minimal customs reconciliation |
| USD 19.73 B (2023) | Trade Journal C | Tracks procurement spend only, excluding downstream channel revenues |
From the comparison, buyers see that our balanced, well-scoped number sits between aggressive and conservative peers, is underpinned by transparent variables, and is refreshed often enough to remain actionable. Mordor analysts believe this makes our baseline the most dependable starting point for strategic decisions.


Key Questions Answered in the Report
What is the growth outlook for the natural rubber market between 2026 and 2031?
The natural rubber market is projected to reach USD 45.65 billion by 2031, rising from USD 34.33 billion in 2026 at a 5.86% CAGR during 2026-2031.
Why is supply still tight in 2026?
Global production is forecast at 15.2 million metric tons against demand of 15.6 million metric tons in 2026, leaving a 0.4 million metric ton deficit and extending the supply gap to a sixth straight year.
Which region is the largest in 2025?
Asia-Pacific was the largest regional segment with a 67.8% share in 2025 because it combines major plantation supply, processing capacity, and consuming markets.
Which region is anticipated to expand the fastest through 2031?
Africa is projected to be the fastest regional segment, with an 8.4% CAGR during 2026-2031 as plantation growth increasingly pairs with local processing investment.
How are electric vehicles affecting rubber demand?
Electric vehicles increase tire wear because of higher weight and instant torque, which can shorten replacement cycles and support demand for higher-performance natural rubber compounds.
How is traceability changing supplier competition?
European Union Deforestation Regulation compliance is raising the value of documented origin, plot mapping, and auditable procurement, which favors larger integrated processors with stronger digital sourcing systems.
Page last updated on:


