Nano Paints And Coatings Market Size and Share
Market Overview
| Study Period | 2020 - 2031 |
|---|---|
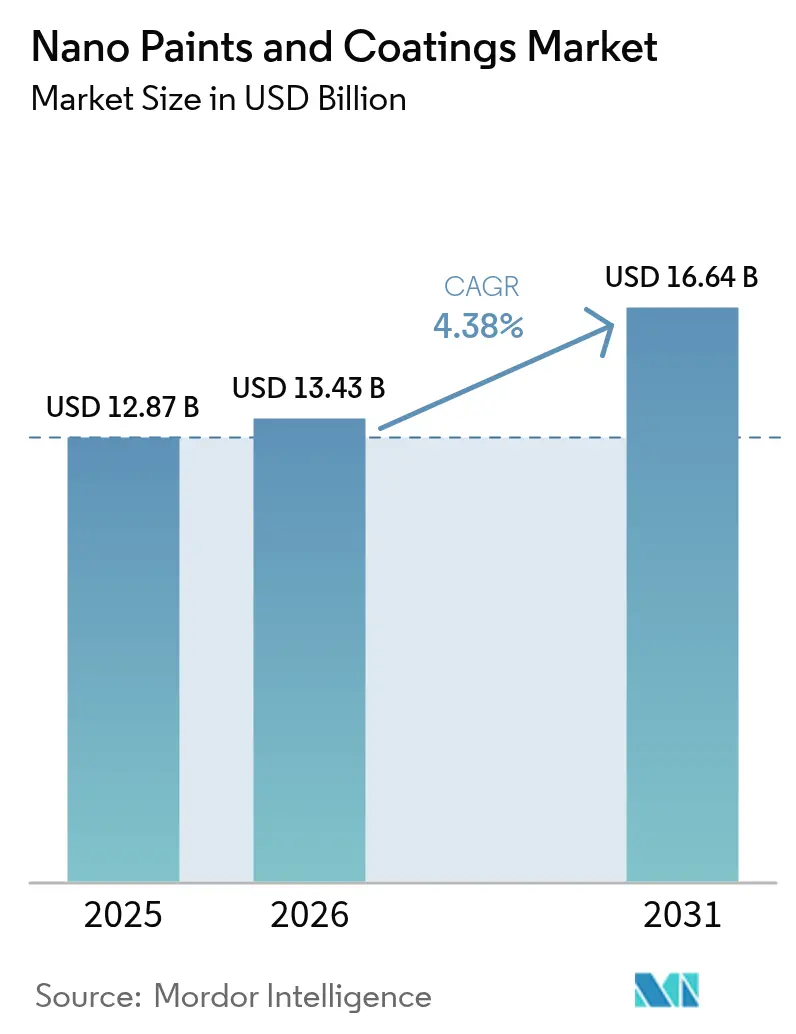
| Market Size (2026) | USD 13.43 Billion |
| Market Size (2031) | USD 16.64 Billion |
| Growth Rate (2026 - 2031) | 4.38% CAGR |
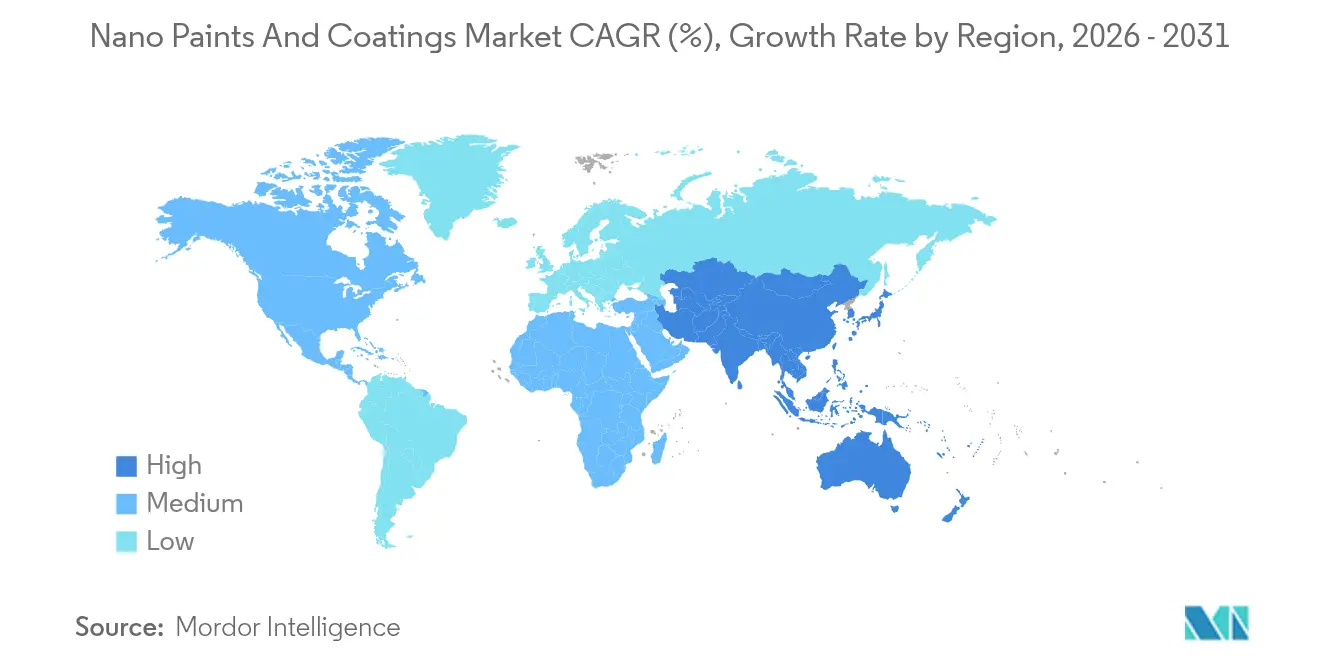
| Fastest Growing Market | Asia Pacific |
| Largest Market | Asia Pacific |
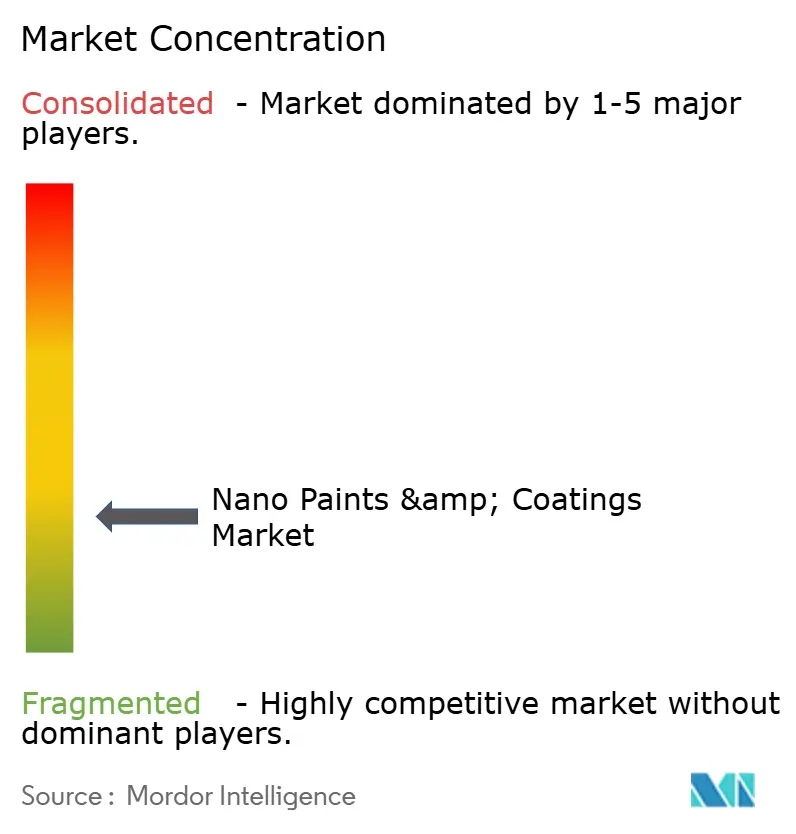
| Market Concentration | Low |
Major Players *Disclaimer: Major Players sorted in no particular order Image © Mordor Intelligence. Reuse requires attribution under CC BY 4.0. | |
Nano Paints And Coatings Market Analysis by Mordor Intelligence
Nano Paints & Coatings Market size in 2026 is estimated at USD 13.43 billion, growing from 2025 value of USD 12.87 billion with 2031 projections showing USD 16.64 billion, growing at 4.38% CAGR over 2026-2031. Growing aerospace demand for corrosion-lightweight solutions, electric vehicle fire-safety requirements, and infrastructure durability needs keep the market on a steady upward course. A dominant 39.17% nano-TiO₂ share combined with graphene’s rapid 5.17% CAGR underlines the core role of advanced nanomaterials in sustaining competitive advantage. Regional momentum remains firmly with Asia-Pacific, which controls almost half of global revenues and commands the fastest regional growth. Supply advances in chemical vapor deposition (CVD) and a shift toward multifunctional formulations that merge corrosion protection, thermal management, and antimicrobial performance are shaping new business opportunities, while high production costs and evolving nano-toxicity rules restrain rapid scale-up.
Key Report Takeaways
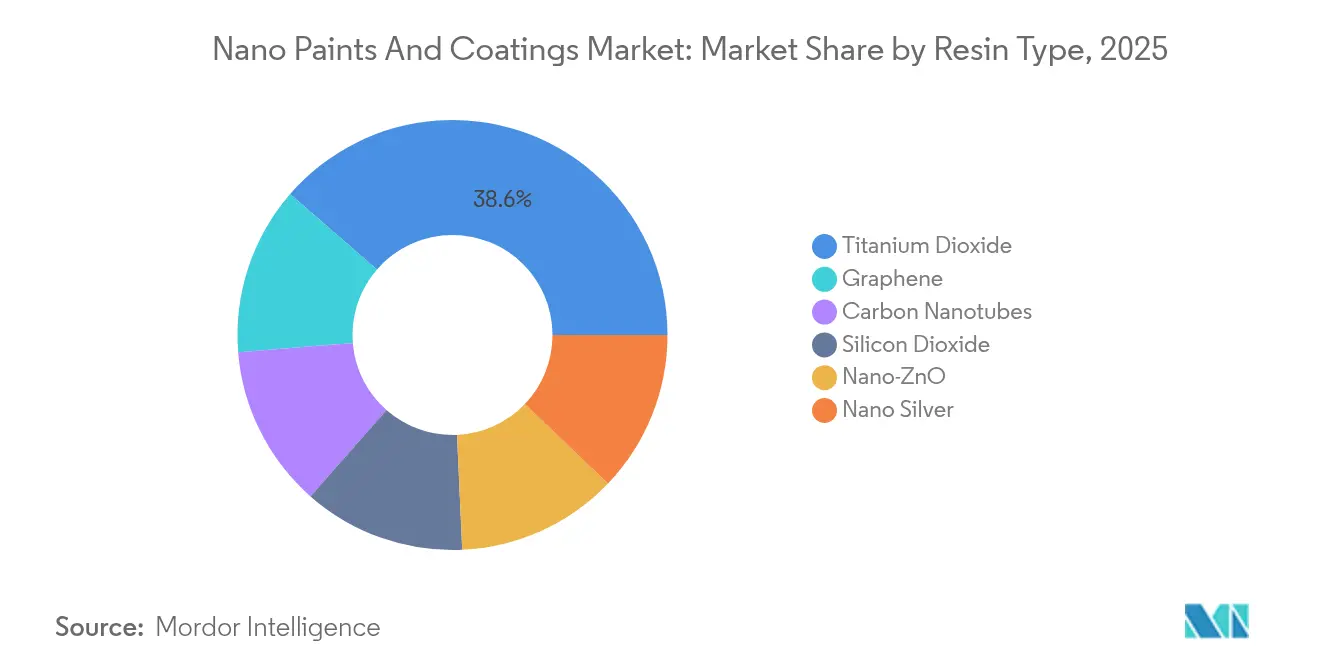
- By resin type, titanium dioxide held 38.62% of the nano paints & coatings market share in 2025, whereas graphene is forecast to expand at a 4.93% CAGR through 2031.
- By application method, chemical vapor deposition led with 38.10% revenue share in 2025, while maintaining a 4.82% CAGR to 2031.
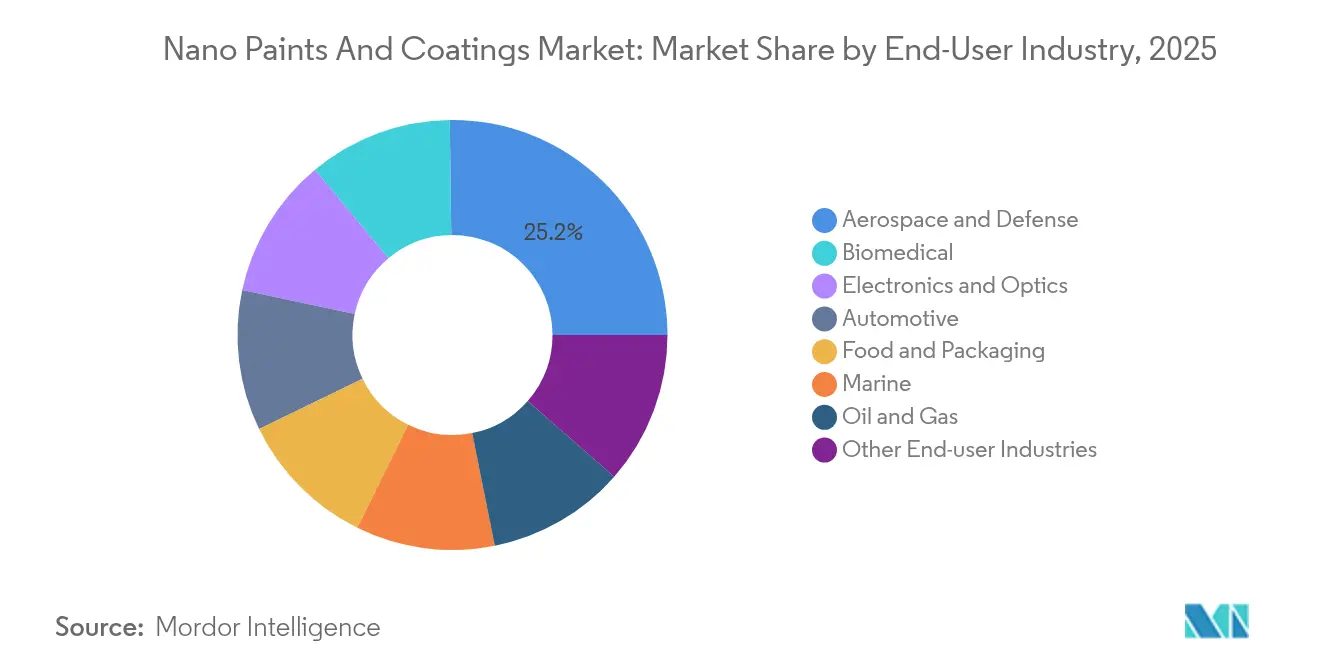
- By end-user industry, aerospace and defense accounted for 25.20% of the nano paints & coatings market size in 2025; biomedical is advancing at a 5.18% CAGR through 2031.
- By geography, Asia-Pacific held 45.05% revenue share in 2025 and is projected to rise at a 4.65% CAGR to 2031.
Note: Market size and forecast figures in this report are generated using Mordor Intelligence’s proprietary estimation framework, updated with the latest available data and insights as of 2026.
Global Nano Paints And Coatings Market Trends and Insights
Drivers Impact Analysis*
| Driver | (~) % Impact on CAGR Forecast | Geographic Relevance | Impact Timeline |
|---|---|---|---|
| Aerospace and defense corrosion-light-weight push | +1.20% | Global, concentrated in North America & Europe | Medium term (2-4 years) |
| Increase in demand for EV thermal-fire-safety coating | +0.90% | APAC core, spill-over to North America & Europe | Short term (≤ 2 years) |
| Growing requirement for high performance coatings | +0.80% | Global | Long term (≥ 4 years) |
| Inceasing demand from infrastructure sector | +0.70% | APAC & Middle East, expansion to emerging markets | Medium term (2-4 years) |
| Rise in utilization from electronics and consumer goods | +0.60% | APAC concentrated, global distribution | Short term (≤ 2 years) |
| Source: Mordor Intelligence | |||
Aerospace and defense corrosion-light-weight push
Pentagon estimates that corrosion costs USD 23 billion each year across military equipment, intensifying the adoption of nano coatings that combine structural lightness with superior protection. Field data show nano-engineered layers lowering maintenance cycles on naval airframes, while icephobic properties enhance aircraft readiness in extreme climates. Programs under the U.S. Navy SBIR banner are moving from bench research to fleet trials, illustrating that rigorous certification barriers simultaneously limit new entrants and guarantee durable demand for validated suppliers. As defense procurement strategies favor platforms with reduced total ownership cost, single-application nano formulations that solve weight, durability, and environmental exposure challenges are increasingly specified.
Increase in demand for EV thermal-fire-safety coating
Rapid electrification pushes battery systems toward higher energy density and stricter safety standards. Specialized nano layers dissipate heat swiftly and form fire-retardant barriers, protecting cells and adjacent components. Resonac’s thermal insulation product for EV packs highlights active commercial development. Carbon and graphene dispersions deliver thermal conductivity without sacrificing dielectric strength, matching OEM safety protocols. In parallel, passenger-comfort solutions such as Hyundai’s nano cooling film that cuts cabin temperature by 10 °C demonstrate spill-over into ancillary applications. Regulatory frameworks that incorporate thermal runaway containment accelerate volume adoption, especially in Asia-Pacific, where battery production capacity is highest.
Growing requirement for high performance coatings
Ageing bridges, tunnels, and power infrastructure confront harsher environmental loads, calling for materials that stretch maintenance cycles. Nano-silica-dosed concrete retained 79% bond strength after corrosive exposure, vastly outperforming conventional mixes that fell to 27%[1]H. Nguyen, “Nano-silica concrete durability tests,” World Academy of Science, waset.org . Ultra-high-performance composites reinforced at the nanoscale move the narrative from reactive repair to proactive asset preservation. Self-healing mechanisms—stimulated by encapsulated nanomaterials—further align with reduced lifecycle emissions targets. Government stimulus packages in several regions, notably the United States and Japan, earmark advanced-material spend, translating into pipeline demand for high-specification protective layers.
Increasing demand from infrastructure sector
Ports, railways, and energy corridors prioritize longevity against saline, UV, and mechanical stresses. Iranian advances in self-repairing steel coatings, validated for marine environments, exemplify ongoing R&D to lower the total cost of ownership. Commercial implementations, such as GoNano’s roofing systems that add 10–15 years of service life, illustrate immediate payback for property developers. Cement composites with carbon nanotube additives lift compressive strength by up to 50% and slash permeability, critical in hot, humid regions[2]L. Smith, “Carbon nanotube cement composites,” Buildings, mdpi.com . Consequently, nano formulations earn acceptance in public-private partnership tenders that weigh long-term sustainability metrics.
Restraints Impact Analysis*
| Restraint | (~) % Impact on CAGR Forecast | Geographic Relevance | Impact Timeline |
|---|---|---|---|
| High production cost of nanomaterials | -0.80% | Global, particularly impacting emerging markets | Medium term (2-4 years) |
| Nano-toxicity regulatory uncertainty | -0.50% | Europe & North America leading, global adoption | Long term (≥ 4 years) |
| Graphene CVD reactor supply bottlenecks | -0.30% | Global, concentrated in advanced manufacturing regions | Short term (≤ 2 years) |
| Source: Mordor Intelligence | |||
High production cost of nanomaterials
Specialized CVD reactors, low-yield batch processes, and stringent purity requirements keep unit costs elevated. Capital requirements delay adoption in price-sensitive uses such as consumer furniture, despite technical performance benefits. Venture capital continues to inject funds—Forge Nano’s USD 40 million raise underscored private backing—but many scale-up programs remain in pilot phase, pointing to gradual cost attrition rather than abrupt drops. Producers pursue inline metrology, precursor recycling, and hybrid wet-chemistry steps to cut expenses, yet breakeven economics still hinge on premium applications.
Nano-toxicity regulatory uncertainty
Global agencies refine safety protocols for nanoscale substances across coatings, cosmetics, and medical devices. United States EPA rules now treat specific carbon nanotubes as new chemicals, enforcing pre-manufacture notification, while FDA guidance outlines toxicological data packages for nanomaterial-bearing drugs[3]U.S. Environmental Protection Agency, “Significant New Use Rule for Carbon Nanotubes,” epa.gov . Europe deploys separate Annex entries in REACH, adding characterization burdens. Producers funnel resources into in vivo and in vitro studies, stretching time-to-market. Cross-border projects face duplicated reviews, especially when coatings are destined for multi-regional supply chains. Non-compliance risks product recalls, prompting conservative launch strategies.
*Our forecasts treat driver/restraint impacts as directional, not additive. The impact forecasts reflect baseline growth, mix effects, and variable interactions.
Segment Analysis
By Resin Type: Titanium dioxide dominates while graphene accelerates
Nano-TiO₂ kept its 38.62% hold on the nano paints & coatings market in 2025. Stable manufacturing, photocatalytic self-cleaning performance, and cost efficiency drive its acceptance on facades, automotive trims, and indoor anti-smog panels. Korean pilot lines producing ultra-large transparent screens using TiO₂ nanoparticles at one-tenth the price of OLED glass underscore this material’s scalability. Graphene, although capped at a modest base, posts a 4.93% CAGR through 2031 as demand from battery heat spreaders and electromagnetic shielding intensifies. Carbon nanotubes remain a niche choice for aerospace and high-end consumer electronics where structural stiffness, conductivity, and weight savings converge. Nano-SiO₂ extends its presence in cement additions that lengthen infrastructure life, and nano-ZnO secures UV-blocking coatings for medical devices and smartphones. Future growth leans on hybrid recipes pairing multiple nanoparticles to secure synergistic properties.
The nano paints & coatings market size for titanium dioxide resin applications is projected to widen steadily, while graphene’s share expands faster under supply chain releases and reactor capacity additions. Complementing that trajectory is a parallel push for green synthesis routes that use bio-derived precursors or solvent-free dispersion to cut carbon footprint.


By Method: CVD retains lead yet gears toward higher throughput
Chemical vapor deposition delivered 38.10% revenue in 2025 and carries a 4.82% CAGR outlook to 2031. The method’s precise layer control and defect management put it at the center of semiconductor, optics, and aerospace programs. However, traditional flat-bed reactors handle limited substrate widths and slow ramp times, fuelling investments into roll-to-roll, concentric-tube, and plasma-enhanced variants that triple square-meter output while reducing energy intensity. Nano Dimension’s repositioning following the Desktop Metal decision reinforces capital flows toward specialized CVD know-how as providers target both 3D-printed electronics and functional coating subcontracts.
Physical vapor deposition continues as a workhorse for premium cosmetic finishes and micro-electronics passivation layers. Apple’s PVD-boosted aluminum enclosure remains a benchmark, highlighting consumer electronics pull. Atomic layer deposition answers atomic-scale uniformity demands in MEMS sensors and biomedical stents. Electrospray and electrospinning thrive in drug-eluting patches, and sol-gel coatings gather pace in infrastructure where fast, low-temperature curing is prized. Inter-method hybrids emerge, combining CVD seed layers with sol-gel over-coats to mix high adhesion and cost efficiency.
By End-User Industry: Biomedical catches up with aerospace leadership
Aerospace and defense retained 25.20% of 2025 spending, as mission-critical aircraft, drones, and naval assets adopt nano layers to beat weight and corrosion. Composite airframes rely on ultra-thin protective skins that do not hinder radar stealth or dielectric properties. For instance, U.S. fighter upgrade programs now list nano-sealants in corrosion control standards. The biomedical segment, clocking a 5.18% CAGR, climbs on approvals for antibacterial catheters, orthopedic implants, and sustained drug-release coatings. Hospitals value nano-silver barriers on high-touch surfaces, paired with regulatory pathways that now recognize ISO-standard test methods.
Automotive growth links to electric drivetrain cooling and scratch-resistant body trims. Electronics benefit from anti-smudge, EMI-shielding, and moisture-barrier layers critical for foldable screens and wearable devices. Food packaging pilots integrate nano-ZnO to curb microbial spoilage but tread carefully under food safety oversight. Marine and offshore operators deploy foul-resistant nano-filled resins to shave fuel burn and dry-dock costs. Construction upscales nano-TiO₂ façade paints that break down pollutants under sunlight, underpinning urban air-quality initiatives.
Geography Analysis
Asia-Pacific anchored 45.05% of global revenue in 2025, keeping the lead with a 4.65% CAGR outlook. China’s electronics supply chains, Japan’s materials science clusters, and South Korea’s display fabs guarantee a stable baseline. Policy incentives, such as China’s Made-in-China 2025 priorities and Japan’s Moonshot R&D goals, accelerate nano production capability, shortening lead times. Local CVD reactor suppliers help diffuse technology beyond top-tier conglomerates, enabling mid-size coating shops to certify nano offerings.
North America’s demand profile centers on aerospace, defense, and medical devices. U.S. Air Force sustainment commands and space launch primes view nano-layering as strategic maintenance cost reducers. Mexico’s ascending EV assembly ecosystem imports nano thermal films and battery coating systems, integrating seamlessly with regional supply. Europe champions eco-design and worker safety, thus driving the adoption of nano-formulated water-borne coatings that satisfy REACH and green building labels. Germany’s automotive Tier-1 suppliers and France’s aerospace OEMs lock up multi-year framework agreements with nano-coating specialists.
South America injects momentum from infrastructure rehabilitation commitments in Brazil’s transport corridors and Argentina’s shale play servicing. Exposure to salt spray, high humidity, and UV intensity places a premium on high-performance coatings, and local paint majors partner with Japanese and German nanomaterial producers to localize blends. The Middle East’s energy sector trials nano layers on downhole pumps and export pipelines to combat sour corrosion, while Africa’s growth story lies in water networks, where internally applied nano sealants cut leak rates under high ambient heat.

Competitive Landscape
The nano paints and coatings market is fragmented. Market leaders compete on formulation IP, nanomaterial supply integration, and application engineering rather than sheer volume. Traditional paint giants, such as PPG, leverage distribution but still outsource critical nanoparticles. Conversely, niche firms focus on protective films for wearables and automotive displays, anchoring revenue on patent-backed technologies. The value proposition gravitates toward multifunctionality: a coating that blocks corrosion, scatters heat, and neutralizes bacteria secures higher margins and reduces procurement complexity for OEMs.
Joint development agreements proliferate in battery supply chains as cell makers hedge material risk. Barriers to entry stem from nanomaterial sourcing, capital-intensive deposition lines, and stringent aerospace or medical validations. Despite consolidation moves, room remains for start-ups exploiting machine-learning-aided dispersion or bio-sourced precursors.
Industry consortia, including the Graphene Flagship and NNI workgroups, foster pre-competitive standards, but IP fences around dispersion chemistry and substrate adhesion remain tall. The field thus balances collaborative ecosystem building with proprietary edge retention.
Nano Paints And Coatings Industry Leaders
Artekya Teknoloji
BASF
Henkel AG and Co. KGaA
Nanoshine Group Corp
PPG Industries, Inc.
- *Disclaimer: Major Players sorted in no particular order

Recent Industry Developments
- February 2025: Pellucere Technologies has opened its first manufacturing facility in Chakan, Maharashtra, India. The plant, with an annual capacity of 8,500 metric tons, is India’s first dedicated nano coatings facility for antireflective and anti-soiling applications, emphasizing innovation, sustainability, and local supply chain efficiency.
- January 2025: Radix Ventures has invested EUR 1.5 million in SIA Naco Technologies to drive international growth and establish a high-capacity production facility in Poland. This investment will scale production to meet Europe's rising demand for nano-coated components and advance research to enhance nano-coating solutions for green energy technologies.


Global Nano Paints And Coatings Market Report Scope
The nano paints & coatings market report includes:
| Graphene |
| Carbon Nanotubes |
| Nano-TiO₂ (Titanium Dioxide) |
| Nano-SiO₂ (Silicon Dioxide) |
| Nano-ZnO |
| Nano Silver |
| Electrospray and Electrospinning |
| Chemical Vapor Deposition (CVD) |
| Physical Vapor Deposition (PVD) |
| Atomic Layer Deposition (ALD) |
| Aerosol Coating |
| Self-Assembly |
| Sol-Gel |
| Aerospace and Defense |
| Automotive |
| Electronics and Optics |
| Biomedical |
| Food and Packaging |
| Marine |
| Oil and Gas |
| Other End-user Industries (Energy and Power, Construction and Infrastructure, etc.) |
| Asia-Pacific | China |
| India | |
| Japan | |
| South Korea | |
| ASEAN Countries | |
| Rest of Asia-Pacific | |
| North America | United States |
| Canada | |
| Mexico | |
| Europe | Germany |
| United Kingdom | |
| France | |
| Italy | |
| Rest of Europe | |
| South America | Brazil |
| Argentina | |
| Rest of South America | |
| Middle East and Africa | Saudi Arabia |
| South Africa | |
| Rest of Middle East and Africa |
| By Resin Type | Graphene | |
| Carbon Nanotubes | ||
| Nano-TiO₂ (Titanium Dioxide) | ||
| Nano-SiO₂ (Silicon Dioxide) | ||
| Nano-ZnO | ||
| Nano Silver | ||
| By Method | Electrospray and Electrospinning | |
| Chemical Vapor Deposition (CVD) | ||
| Physical Vapor Deposition (PVD) | ||
| Atomic Layer Deposition (ALD) | ||
| Aerosol Coating | ||
| Self-Assembly | ||
| Sol-Gel | ||
| By End-User Industry | Aerospace and Defense | |
| Automotive | ||
| Electronics and Optics | ||
| Biomedical | ||
| Food and Packaging | ||
| Marine | ||
| Oil and Gas | ||
| Other End-user Industries (Energy and Power, Construction and Infrastructure, etc.) | ||
| By Geography | Asia-Pacific | China |
| India | ||
| Japan | ||
| South Korea | ||
| ASEAN Countries | ||
| Rest of Asia-Pacific | ||
| North America | United States | |
| Canada | ||
| Mexico | ||
| Europe | Germany | |
| United Kingdom | ||
| France | ||
| Italy | ||
| Rest of Europe | ||
| South America | Brazil | |
| Argentina | ||
| Rest of South America | ||
| Middle East and Africa | Saudi Arabia | |
| South Africa | ||
| Rest of Middle East and Africa | ||


Key Questions Answered in the Report
What is the current valuation of the nano paints & coatings market?
The nano paints & coatings market size is valued at USD 13.43 billion in 2026.
How fast is the nano paints & coatings market expected to grow?
The market is projected to expand at a 4.38% CAGR from 2026 to 2031.
Which resin type dominates nano paints & coatings demand?
Nano-TiO₂ holds the top position with 38.62% of 2025 revenues, owing to its versatile self-cleaning and photocatalytic benefits.
Why is Asia-Pacific a key region for nano paints & coatings?
Asia-Pacific represents 45.05% of global turnover and offers the fastest growth at 4.65% CAGR due to strong electronics, automotive, and infrastructure activity.
What sectors are driving new nano coating applications?
Aerospace, electric vehicles, biomedical devices, and infrastructure projects are leading adopters, seeking corrosion resistance, thermal management, and antimicrobial functionality.
What main challenges could slow market expansion?
High nanomaterial production costs, evolving nano-toxicity regulations, and limited graphene CVD reactor capacity currently constrain wider adoption.
Page last updated on:


