Multi-Touch Attribution Market Size and Share
Market Overview
| Study Period | 2020 - 2031 |
|---|---|
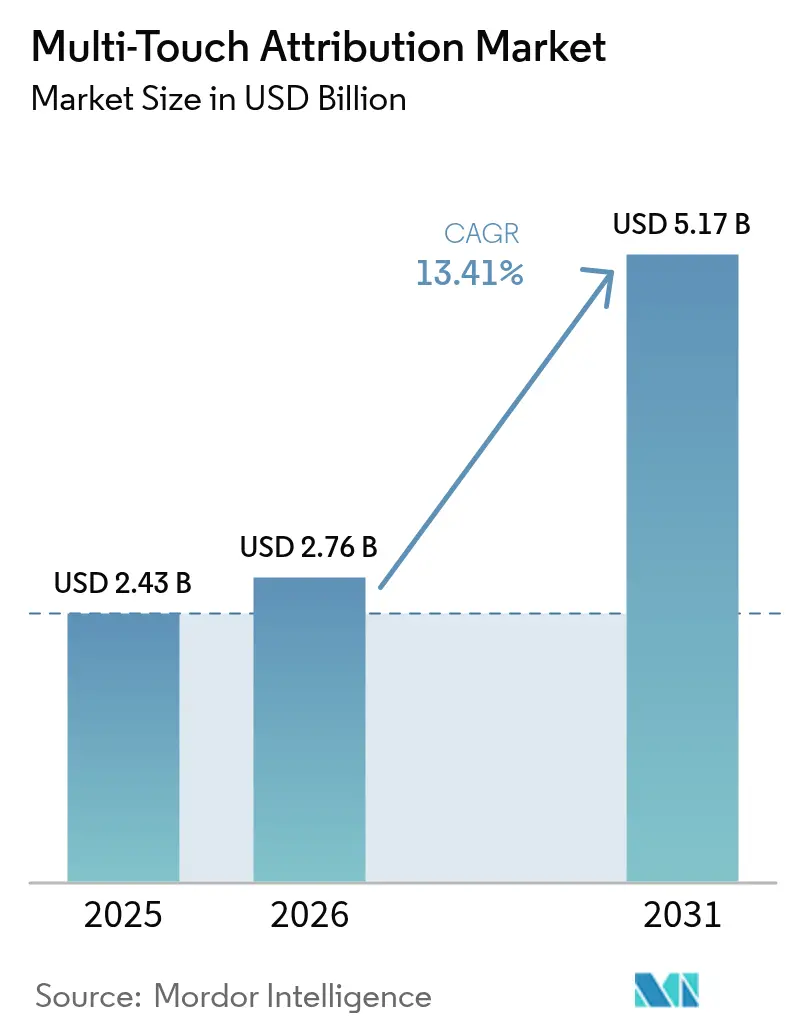
| Market Size (2026) | USD 2.76 Billion |
| Market Size (2031) | USD 5.17 Billion |
| Growth Rate (2026 - 2031) | 13.41% CAGR |
| Fastest Growing Market | Asia Pacific |
| Largest Market | North America |
| Market Concentration | Medium |
Major Players *Disclaimer: Major Players sorted in no particular order Image © Mordor Intelligence. Reuse requires attribution under CC BY 4.0. | |
Multi-Touch Attribution Market Analysis by Mordor Intelligence
Multi-touch attribution market size in 2026 is estimated at USD 2.76 billion, growing from 2025 value of USD 2.43 billion with 2031 projections showing USD 5.17 billion, growing at 13.41% CAGR over 2026-2031. Sustained growth reflects the rapid pivot to privacy-first marketing, the spread of omnichannel commerce, and the rising need to connect online and offline customer data. Demand is strongest where programmatic advertising, connected TV, and retail media intersect, prompting vendors to embed advanced identity resolution and consent management features.[1]Interactive Advertising Bureau, “Digital Out-of-Home & In-Store Retail Media Playbook 2024,” iab.com Algorithmic models have become the preferred choice for sophisticated marketers, while cloud-native deployments dominate as enterprises process ever-larger datasets in real time. Concurrently, software-as-a-service pricing and low-code interfaces are enabling small and medium enterprises to adopt measurement once reserved for large brands. Competitive dynamics remain active, with technology majors enhancing AI-driven insights and specialist providers tailoring tools for mobile-first campaigns.
Key Report Takeaways
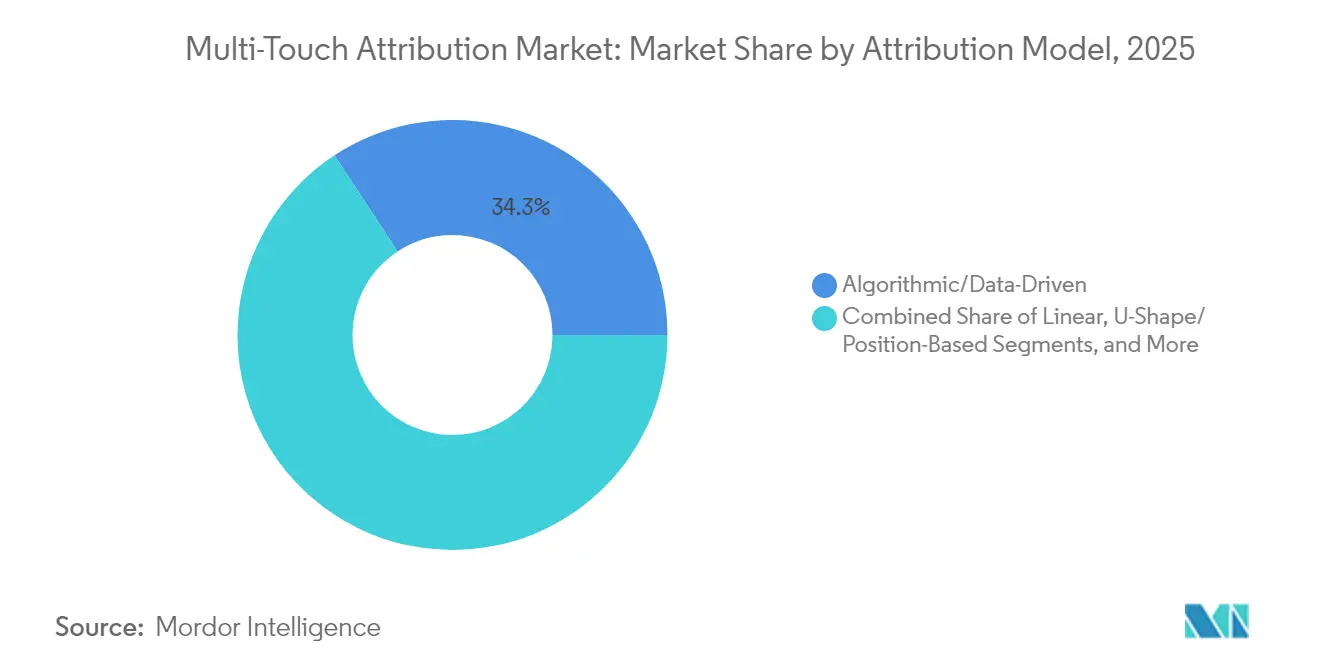
- By attribution model, algorithmic and data-driven approaches held 34.25% of the multi-touch attribution market share in 2025 and are growing at 14.05% CAGR through 2031.
- By component, solutions retained 69.10% revenue share in 2025, while services are tracking the fastest expansion at 15.85% CAGR to 2031.
- By deployment mode, cloud platforms accounted for 73.90% of the multi-touch attribution market size in 2025 and are rising at 13.22% CAGR through 2031.
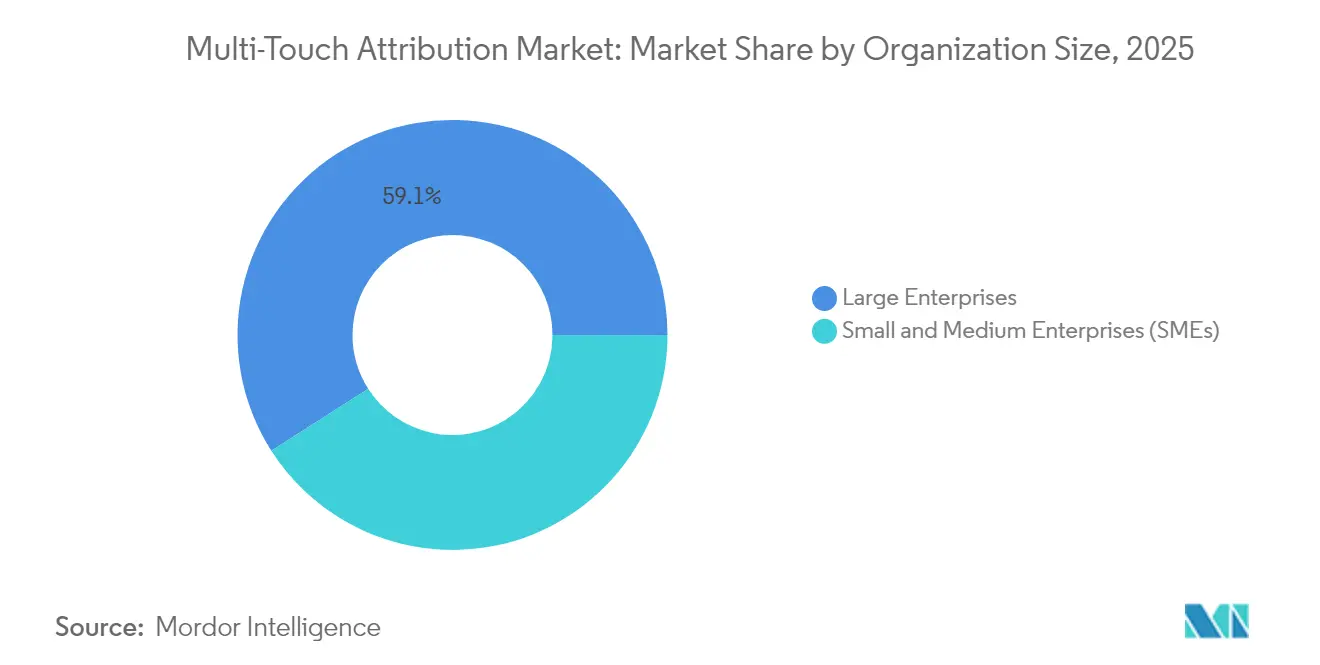
- By organization size, large enterprises commanded 59.05% share in 2025, yet SMEs demonstrate the strongest CAGR at 15.90% through 2031.
- By end user, retail and e-commerce led with 24.10% share in 2025; healthcare and life sciences are accelerating at 16.85% CAGR to 2031.
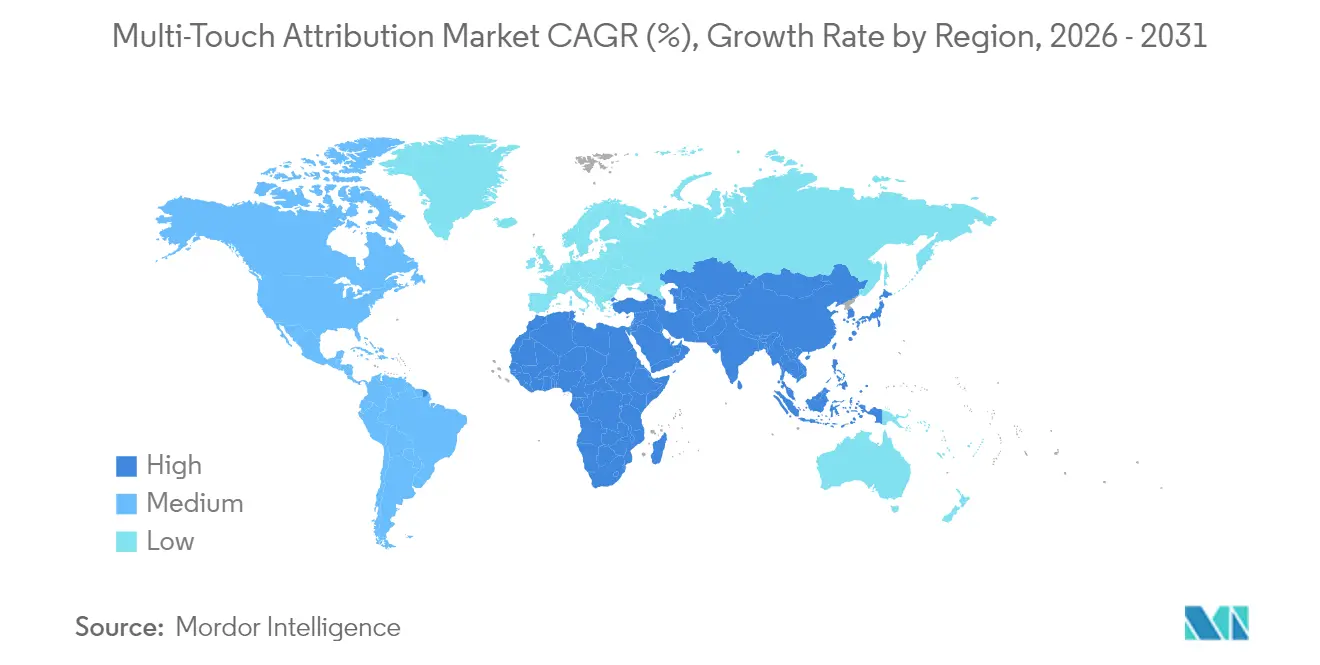
- By geography, North America contributed 39.20% of 2025 revenue, while Asia-Pacific is projected to outpace all regions at 14.85% CAGR through 2031.
Note: Market size and forecast figures in this report are generated using Mordor Intelligence’s proprietary estimation framework, updated with the latest available data and insights as of 2026.
Global Multi-Touch Attribution Market Trends and Insights
Drivers Impact Analysis*
| Driver | (~) % Impact on CAGR Forecast | Geographic Relevance | Impact Timeline |
|---|---|---|---|
| Increasing first-party data strategies | +2.8% | Global; early uptake in North America and EU | Medium term (2-4 years) |
| Omnichannel retail complexity in Asia | +3.2% | Asia-Pacific core; spill-over to Middle East Africa | Long term (≥ 4 years) |
| Expansion of retail media networks | +2.1% | North America and EU; emerging in Asia-Pacific | Medium term (2-4 years) |
| Programmatic CTV adoption | +1.9% | North America; early rollout in EU | Short term (≤ 2 years) |
| AI-powered marketing automation bundles | +2.4% | Global; led by North America | Medium term (2-4 years) |
| Self-serve SaaS platforms for SMEs | +1.5% | Global | Short term (≤ 2 years) |
| Source: Mordor Intelligence | |||
Increasing First-Party Data Strategies Spurred by Cookie-Less Browsers
Third-party cookie deprecation has pushed companies to build consent-based data foundations anchored in customer data platforms.[2]Teradata, “First-Party Data: Thriving in the Age of Privacy Regulation,” teradata.com Brands integrating identity resolution, differential privacy, and secure computation are reporting higher lifetime value and lower acquisition costs. As data flows shift from probabilistic to deterministic, demand rises for attribution engines able to ingest hashed emails, loyalty IDs, and clean-room outputs while honoring regional privacy laws. Vendors that embed native consent orchestration and robust governance are winning large contracts, particularly in regulated industries.
Proliferation of Omnichannel Retail in Asia Fueling Complex Journeys
Asia-Pacific retailers now blend in-app, live-stream, and in-store touchpoints inside super-apps and unified wallets, generating intricate conversion paths. Gen Z shoppers expect seamless experiences, forcing merchants to deploy attribution that maps social discovery, QR-code activations, and store purchases in one graph. Early adopters confirm double-digit improvements in marketing efficiency after shifting from last-click to algorithmic models able to weight upper-funnel engagements.
Rise of Retail Media Networks Elevating Offline-to-Online Attribution Needs
Retailers have turned first-party basket data into a USD 100 billion advertising opportunity, yet advertisers still lack clarity on how onsite impressions translate to store sales. Integration of in-store digital screens, connected TV, and curbside pickup requires measurement that joins point-of-sale, loyalty, and media logs. Platforms supporting closed-loop reporting and AI-driven yield management are emerging as preferred partners for both brands and retailers, accelerating spend toward networks that can prove incremental revenue.
Programmatic CTV Advertising Adoption in North America
Streaming households now outnumber traditional cable viewers, driving brands to shift budgets toward programmatic connected TV. Marketers need to trace household-level exposures to cross-device web visits and app installs. Attribution vendors are building graph-based links between smart-TV identifiers and mobile IDs, allowing real-time budget re-allocation. Compliance mandates around viewer consent and data sharing have expanded the role of privacy-preserving measurement features.
Restraints Impact Analysis*
| Restraint | (~) % Impact on CAGR Forecast | Geographic Relevance | Impact Timeline |
|---|---|---|---|
| Privacy regulations limiting signal capture | -1.8% | EU and California; expanding global | Long term (≥ 4 years) |
| Marketing-ops talent shortage | -1.2% | Global; acute in North America, EU | Medium term (2-4 years) |
| Rising data-storage costs | -0.9% | Global | Medium term (2-4 years) |
| API restrictions from walled gardens | -0.7% | Global | Short term (≤ 2 years) |
| Source: Mordor Intelligence | |||
Signal Loss from Privacy Regulations Hindering Data Collection
Rules such as GDPR and CPRA restrict cookies, cross-site tracking, and user profiling. Marketers face thinner datasets, heavier reliance on modeled conversions, and tougher consent workflows. Many respond by investing in clean rooms and additive noise techniques, yet attribution precision still drops when opt-out rates climb. Compliance expenses divert budgets from innovation, and perpetual policy changes create planning uncertainty.
Marketing-Ops Talent Shortage for Advanced Analytics Deployment
Effective multi-touch attribution requires specialists fluent in data engineering, statistics, and media activation. Demand far outstrips supply, lengthening deployment cycles and inflating salaries. Organizations often outsource integration, model calibration, and experimentation, raising total cost of ownership. The deficit is most acute for high-skill tasks such as incrementality testing and causal inference, limiting the pace at which enterprises can exploit advanced capabilities.
*Our forecasts treat driver/restraint impacts as directional, not additive. The impact forecasts reflect baseline growth, mix effects, and variable interactions.
Segment Analysis
By Attribution Model: Algorithmic Dominance as Measurement Matures
Algorithmic and data-driven frameworks controlled 34.25% share in 2025 and will expand at 14.05% CAGR to 2031, marking the clear shift from rule-based to machine-learning approaches. These models parse billions of touchpoints to assign conversion credit dynamically, eliminating constant rule tweaking and boosting predictive accuracy. Linear, time-decay, and U-shape approaches persist for transitional mandates or single-channel campaigns but are ceding ground as marketers witness higher return on ad spend under probabilistic, AI-powered calculations. Meridian, Mix Modeler, and similar offerings embed causal inference that benchmarks true lift, while self-serve interfaces let non-technical teams launch tests without coding.
Continued investment in algorithmic engines will lift the multi-touch attribution market as brands demand faster insights and cross-device granularity. When advanced methodologies are paired with privacy-tech layers, enterprises balance compliance and performance, reinforcing adoption momentum. Early pilots reveal that brands replacing last-click with algorithmic models have trimmed wasted spend by double digits, steering budget to channels previously undervalued.


By Component: Services Growth Signals Implementation Complexity
Solutions still provided 69.10% of 2025 revenue by delivering the core data ingestion, modeling, and visualization stack that defines the multi-touch attribution market. Yet services are accelerating at a 15.85% CAGR as enterprises realize the need for strategy consulting, data mapping, and model governance. Large brands tap integration partners to link point-of-sale data, CRM events, streaming logs, and consent strings, underscoring why services revenue rises faster than licenses.
Managed services further appeal to organizations confronting skill shortages. Outsourced analysts fine-tune algorithm weights, run incrementality studies, and interpret dashboards for C-suite decisions. This hands-on support not only raises renewal rates for platform vendors but also drives incremental market revenue as post-implementation optimization becomes a multi-year engagement.
By Deployment Mode: Cloud-Native Scale Underpins Real-Time Insights
Cloud deployments owned 73.90% of 2025 revenue and are growing at 13.22% CAGR through 2031. Elastic compute allows models to refresh conversion probabilities within minutes, a critical capability when marketers shift spend daily. Leading providers also embed encryption key management, zero-trust access, and compliance certifications, persuading risk-averse buyers to leave legacy on-premise stacks. Hybrid options have appeared for firms bound by data-sovereignty mandates, keeping raw identifiers in private clusters while sending anonymized aggregates to the cloud for processing.
Latency-sensitive use cases, such as programmatic bidding and dynamic creative, further validate cloud importance. Edge nodes can execute lightweight attribution close to the user, then sync results back to centralized stores for model refinement. Vendors invested in serverless micro-services and vectorized databases are gaining share as query volumes soar.
By Organization Size: SaaS Democratizes Advanced Measurement for SMEs
Large enterprises captured 59.05% of 2025 spend thanks to global footprints, omnichannel media budgets, and dedicated analytics teams. However, SMEs are registering 15.90% CAGR as subscription models, quick-start templates, and drag-and-drop connectors lower adoption barriers. Vendors embed automated recommendations that translate attribution findings into bid and budget changes, helping lean teams act without data scientists.
These trends broaden the addressable base for the multi-touch attribution market. As smaller advertisers grow digital share of voice, they seek proof of incremental sales before scaling budgets. Affordable tiers with usage-based pricing satisfy this need, driving vendor land-and-expand strategies that elevate long-term revenue.
By End-User Industry: Healthcare Rises on Patient Journey Insights
Retail and e-commerce remained the primary buyers, holding 24.10% revenue in 2025, because granular purchase data lets merchants test channel mixes quickly. Still, healthcare and life sciences now outpace all sectors at 16.85% CAGR. Providers and insurers must trace patient journeys that span awareness, telehealth consults, and in-clinic visits while meeting stringent privacy rules. Attribution platforms configured for HIPAA-compliant environments offer hashed-ID processing, consent dashboards, and audit trails, unlocking adoption.
Finance, travel, and media firms follow closely, each leveraging attribution to cut acquisition costs and personalize content. Finance-app publishers, for instance, improved user retention after shifting to multi-touch models that spotlight early-funnel education campaigns. Such cross-industry learning keeps solution roadmaps broad and encourages verticalized offerings with specialized schema and reporting templates.
Geography Analysis
North America generated 39.20% of global revenue in 2025, driven by deep programmatic spend, connected-TV scale, and early traction for privacy-enhancing technologies. The United States is the epicenter for AI experimentation in marketing measurement, while Canada advances omnichannel retail analytics and Mexico emerges as a high-growth frontier for e-commerce attribution.
Europe ranks second, shaped by the General Data Protection Regulation, which positions privacy-by-design as a non-negotiable buying criterion. Germany favors B2B attribution for manufacturing export chains, the United Kingdom emphasizes finance and retail, and France is scaling retail-media measurement as supermarkets diversify revenue streams. Nordic countries stand out for mobile-first attribution sophistication, aided by broad 5G coverage and high app penetration.
Asia-Pacific is the fastest-growing region at 14.85% CAGR to 2031, reflecting mobile-centric consumer behavior, super-app ecosystems, and live-stream commerce. China pilots attribution that stitches live-stream interactions, social referrals, and in-store QR code scans, illustrating demand for models that parse intertwined touchpoints. Japan pushes cross-device attribution for connected-TV and gaming, while India’s expanding digital payments infrastructure fuels attribution needs in retail and fintech. Southeast Asian markets, from Singapore to Indonesia, prioritize omnichannel analytics as brick-and-mortar chains launch digital storefronts. Collectively, these dynamics ensure the multi-touch attribution market captures expanding budgets across all major geographies.

Competitive Landscape
The market remains moderately semi-fragmented, yet consolidation is gathering pace. Technology titans enrich native clouds with AI-driven attribution, for instance, Adobe increased Digital Experience revenue to USD 1.46 billion in Q2 2025, supported by AI-powered Mix Modeler. Meanwhile, DoubleVerify’s USD 85 million purchase of Rockerbox in February 2025 combined outcome measurement with verification, signaling a trend toward full-funnel performance suites.[4] DoubleVerify, “DoubleVerify To Acquire Rockerbox,” ir.doubleverify.com
Specialist vendors such as Adjust and AppsFlyer defend mobile and in-app niches through deep SDK integrations and fraud-prevention layers. Edge-native players target privacy-sensitive buyers with server-side tagging and on-device modeling. Cloud hyperscalers embed attribution APIs into broader analytics ecosystems, appealing to enterprises seeking single-vendor convenience.
Strategic partnerships focus on identity resolution, clean-room connectivity, and real-time activation. Open-source frameworks for causal inference are being folded into commercial offerings, lowering experimentation costs. Vendors able to unify paid, owned, and earned touchpoints in one model, while complying with divergent global privacy regimes, will outperform peers in the coming five years.
Multi-Touch Attribution Industry Leaders
Adobe, Inc.
Neustar, Inc.
Engagio, Inc.
Conversion Logic, Inc.
LeanData Inc.
- *Disclaimer: Major Players sorted in no particular order

Recent Industry Developments
- February 2025: DoubleVerify agreed to acquire Rockerbox for USD 85 million, adding multi-touch attribution to its media quality suite
- December 2024: Adobe posted Digital Experience revenue of USD 1.46 billion, citing strong demand for AI-driven attribution
- November 2024: Adobe enhanced Experience Platform with generative AI services that deliver real-time attribution insights
- August 2024: Foursquare launched Sales Impact, merging transactional and financial data for outcome-based measurement


Global Multi-Touch Attribution Market Report Scope
Multi-touch attribution is a methodology for measuring marketing. All touchpoints on the consumer's journey are measured and assigned certain amounts of credit to each channel so that advertisers can understand what each one has contributed to their conversion.
The multi-touch attribution market is segmented by end-user industry (retail and e-commerce, BFSI, it and telecom, consumer electronics, travel & tourism, and other end-user industries (healthcare & life sciences and media & entertainment)) and geography (North America, Europe, Asia-Pacific, Latin America, and Middle East and Africa). The market sizes and forecasts are provided in value (USD) for all the above segments.
| Algorithmic/Data-Driven |
| Linear |
| Time-Decay |
| U-Shape/Position-Based |
| Others (Custom, First/Last Touch) |
| Solutions | |
| Services | Consulting |
| Integration and Deployment | |
| Support and Maintenance |
| Cloud |
| On-Premise |
| Small and Medium Enterprises (SMEs) |
| Large Enterprises |
| Retail and E-commerce |
| BFSI |
| IT and Telecom |
| Consumer Electronics and Durables |
| Travel and Tourism |
| Healthcare and Life Sciences |
| Media and Entertainment |
| North America | United States | |
| Canada | ||
| Mexico | ||
| Europe | Germany | |
| United Kingdom | ||
| France | ||
| Nordics | ||
| Rest of Europe | ||
| South America | Brazil | |
| Rest of South America | ||
| Asia Pacific | China | |
| Japan | ||
| India | ||
| South East Asia | ||
| Rest of Asia Pacific | ||
| Middle East and Africa | Middle East | Gulf Cooperation Council Countries |
| Turkey | ||
| Rest of Middle East | ||
| Africa | South Africa | |
| Rest of Africa | ||
| By Attribution Model | Algorithmic/Data-Driven | ||
| Linear | |||
| Time-Decay | |||
| U-Shape/Position-Based | |||
| Others (Custom, First/Last Touch) | |||
| By Component | Solutions | ||
| Services | Consulting | ||
| Integration and Deployment | |||
| Support and Maintenance | |||
| By Deployment Mode | Cloud | ||
| On-Premise | |||
| By Organization Size | Small and Medium Enterprises (SMEs) | ||
| Large Enterprises | |||
| By End-User Industry | Retail and E-commerce | ||
| BFSI | |||
| IT and Telecom | |||
| Consumer Electronics and Durables | |||
| Travel and Tourism | |||
| Healthcare and Life Sciences | |||
| Media and Entertainment | |||
| By Geography | North America | United States | |
| Canada | |||
| Mexico | |||
| Europe | Germany | ||
| United Kingdom | |||
| France | |||
| Nordics | |||
| Rest of Europe | |||
| South America | Brazil | ||
| Rest of South America | |||
| Asia Pacific | China | ||
| Japan | |||
| India | |||
| South East Asia | |||
| Rest of Asia Pacific | |||
| Middle East and Africa | Middle East | Gulf Cooperation Council Countries | |
| Turkey | |||
| Rest of Middle East | |||
| Africa | South Africa | ||
| Rest of Africa | |||


Key Questions Answered in the Report
What is the current size of the multi-touch attribution market?
The market stands at USD 2.76 billion in 2026 and is projected to reach USD 5.17 billion by 2031, reflecting a 13.41% CAGR.
Which attribution model is growing the fastest?
Algorithmic and data-driven models are expanding at 14.05% CAGR, holding 34.25% share in 2025 as brands move beyond rule-based approaches
Why are services outpacing solutions in growth?
Implementation complexity, privacy governance, and the marketing-ops talent gap are driving 15.85% CAGR for consulting, integration, and managed support.
Which region will see the quickest adoption?
Asia-Pacific is forecast to advance at 14.85% CAGR through 2031 due to mobile-first behaviors and super-app commerce ecosystems.
What vertical is emerging as the next big adopter?
Healthcare and life sciences lead future growth at 16.85% CAGR as providers pursue patient journey insights under strict privacy rules.
How fragmented is the competitive landscape?
The top five vendors control under 40% of revenue, leading to a moderate concentration score of 6 and ongoing consolidation activity.
Page last updated on:


