MIL-SPEC Connectors Market Size and Share
Market Overview
| Study Period | 2019 - 2030 |
|---|---|
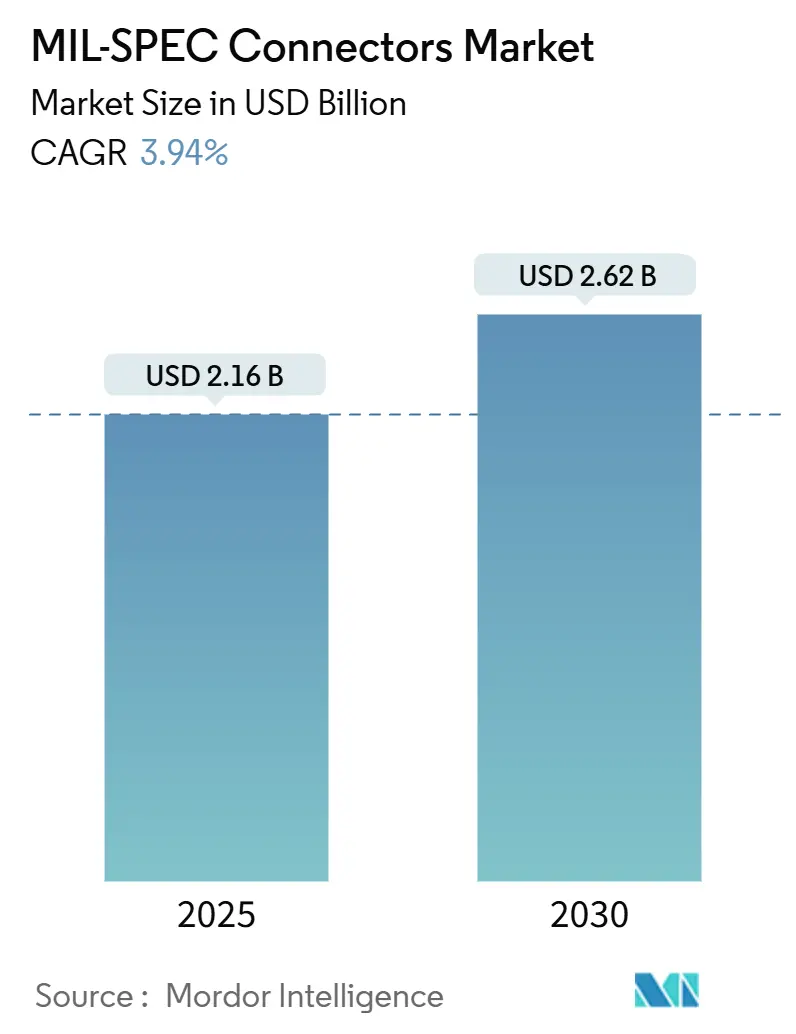
| Market Size (2025) | USD 2.16 Billion |
| Market Size (2030) | USD 2.62 Billion |
| Growth Rate (2025 - 2030) | 3.94% CAGR |
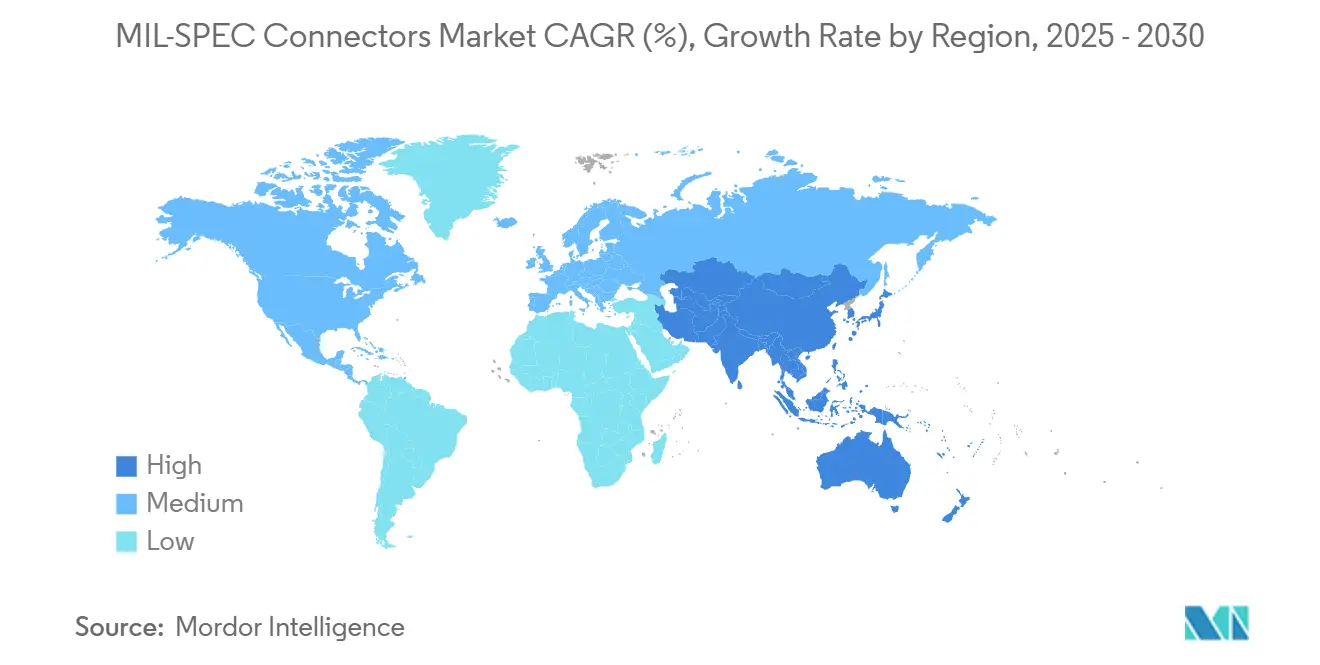
| Fastest Growing Market | Asia Pacific |
| Largest Market | North America |
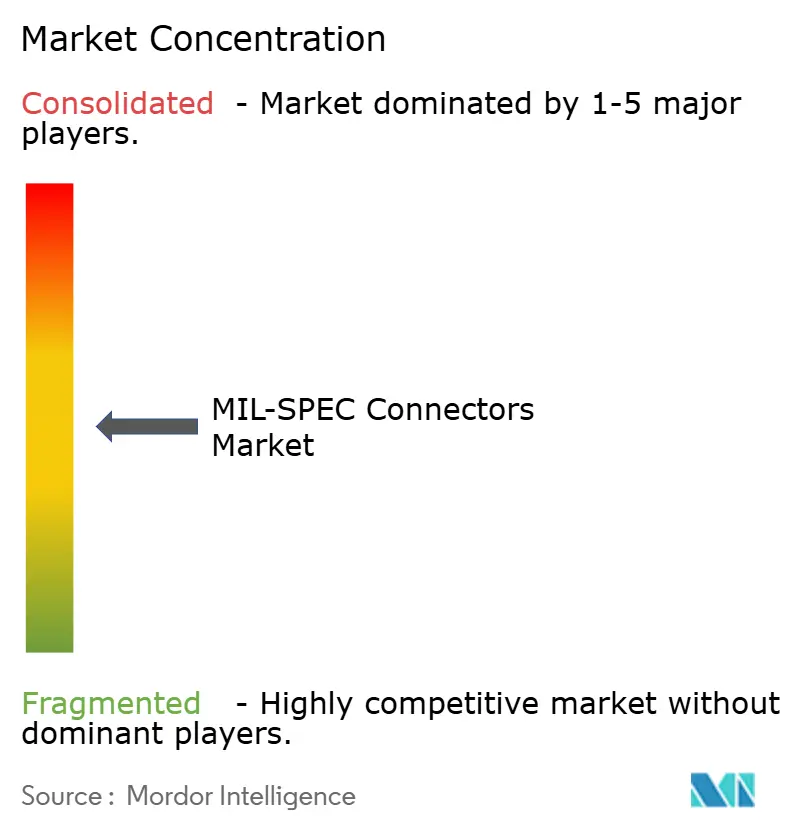
| Market Concentration | Medium |
Major Players *Disclaimer: Major Players sorted in no particular order Image © Mordor Intelligence. Reuse requires attribution under CC BY 4.0. | |
MIL-SPEC Connectors Market Analysis by Mordor Intelligence
The MIL-SPEC connectors market size stands at USD 2.16 billion in 2025 and is projected to reach USD 2.62 billion by 2030, reflecting a 3.94% CAGR. Demand is anchored in defense modernization programs that replace legacy cabling with qualified interconnects, while platform electrification elevates current-carrying requirements. MOSA mandates in the United States accelerate the adoption of standardized interfaces, and global procurement budgets exceeding USD 100 billion in Europe, plus sustained spending growth in Asia-Pacific, provide a stable order pipeline. Supply-chain reshoring incentives in North America encourage local connector production, though counterfeit risks in gray markets necessitate stricter vendor audits. Consolidation among established suppliers continues as qualification costs discourage new entrants and reinforce price premiums for high-reliability designs.
Key Report Takeaways
- By product type, fiber-optic connectors led with 38.55% of the MIL-SPEC connectors market share in 2024.
- By connector shape, circular connectors held 41.29% of revenue in 2024, while unmanned-system geometries are forecasted to expand at a 6.5% CAGR through 2030.
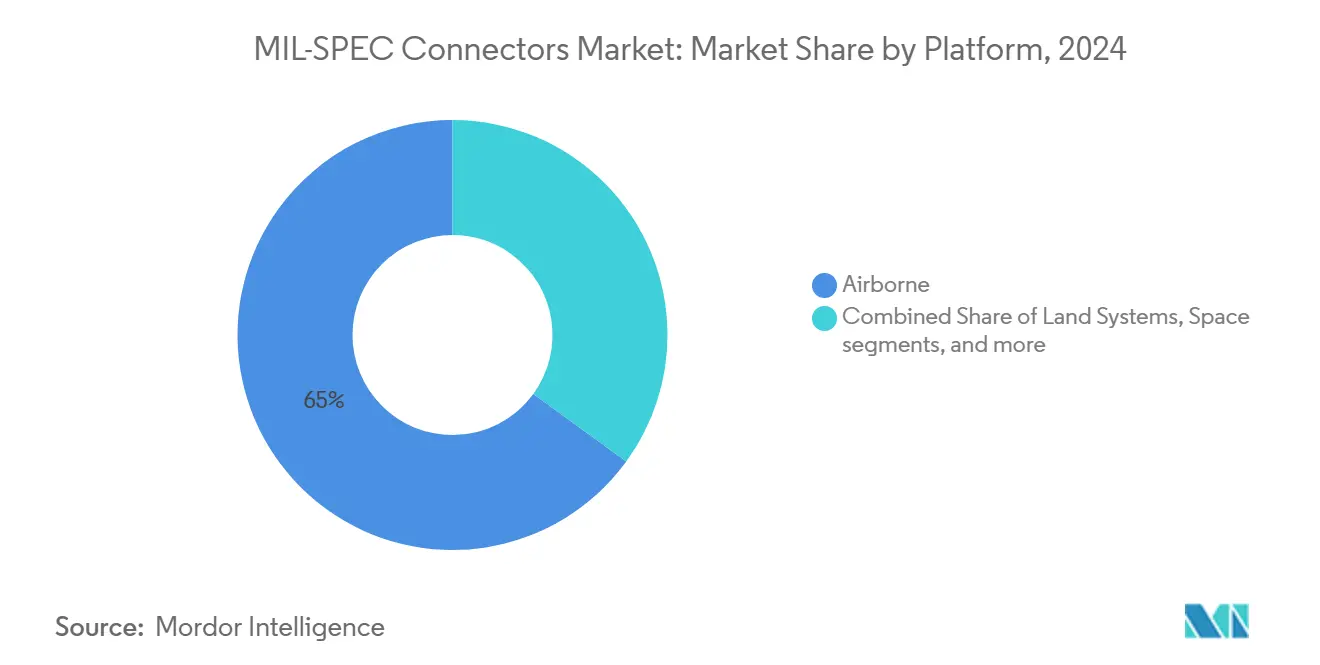
- By platform, airborne applications accounted for 64.98% of the MIL-SPEC connectors market size in 2024, and space platforms are set to advance at a 5.24% CAGR to 2030.
- By end user, OEM production captured a 59.28% share of the MIL-SPEC connectors market size in 2024 and is growing at a 4.62% CAGR through 2030.
- By geography, North America commanded 41.38% of 2024 revenue, whereas Asia-Pacific is projected to post the fastest 4.29% CAGR to 2030.
Global MIL-SPEC Connectors Market Trends and Insights
Drivers Impact Analysis*
| Driver | ( ~) % Impact on CAGR Forecast | Geographic Relevance | Impact Timeline |
|---|---|---|---|
| DoD Modular Open-Systems Architecture (MOSA) mandates | +1.20% | North America, NATO | Medium term (2-4 years) |
| Expansion of autonomous and unmanned defense platforms | +0.90% | Global, focus US and China | Long term (≥ 4 years) |
| Integration of MIL-grade connectors in commercial launch vehicles | +0.70% | North America, Europe | Long term (≥ 4 years) |
| Avionics miniaturization across retrofit programs | +0.60% | Global | Medium term (2-4 years) |
| Cyclical uplift in global defense procurement budgets | +0.80% | Global | Short term (≤ 2 years) |
| Supply-chain reshoring incentives for critical components | +0.50% | North America, Europe | Medium term (2-4 years) |
| Source: Mordor Intelligence | |||
DoD MOSA Mandates Spur Standardization
The 10 United States Code (USC) 4401 obliges every major Pentagon acquisition program to embed modular open-systems architecture, forcing a shift away from proprietary sockets toward qualified MIL-DTL families. Program Executive Offices now include MOSA milestones in their acquisition baselines, which ties funding release to evidence of connector standardization. Prime contractors, therefore, specify Series III and Micro-D parts at the concept stage instead of late in engineering, increasing connector content in each new line-replaceable unit. Suppliers already holding QPL status across multiple MIL-DTL lines gain preferred-vendor status because program managers see lower schedule risk. GAO’s 2024 audit found uneven adherence, but the report recommended corrective actions that the Office of the Secretary of Defense accepted, signaling tighter enforcement over the next budget cycle. As compliance solidifies, recurring demand for MOSA-qualified parts reinforces sustained growth in the MIL-SPEC connectors market.
Autonomous Platform Expansion Fuels Miniaturization
The surge in unmanned aerial vehicles (UAVs), autonomous ground robots, and sea drones pushes designers to favor nano-pitch interconnects such as the 0.635 mm MIL-DTL-32139 family.[1]Omnetics Connector Corporation, “Nano-D Connectors,” omnetics.com Weight budgets on Group-2 UAVs fall below 25 kg, so every gram saved in cabling directly extends endurance. Nano-D connectors deliver up to 20 GHz signal integrity while occupying one-quarter the volume of legacy Micro-Ds, enabling higher sensor density without enlarging airframes. Defense agencies now issue separate connector specifications within their unmanned-system road maps, ensuring that miniaturized devices remain QPL-listed, not commercial off-the-shelf substitutions. Production lots for loitering munitions exceed tens of thousands of units annually, driving real volume rather than niche prototype runs. This sustained procurement broadens the MIL-SPEC connectors market beyond crewed platforms and secures a long-run demand curve.
Commercial Space Drives New Qualification Paths
Blue Origin’s Artemis V lunar lander contract mandates MIL-DTL-38999 connectors on flight-critical systems to align with NASA human-rating criteria. Commercial launch providers follow suit because re-qualification of a new custom interface would jeopardize schedule margins in competitive bid cycles. Connector vendors respond by offering “spaceflight” revisions that carry the same shell geometry as defense variants but undergo additional outgassing and radiation tests. This dual-use strategy lets suppliers amortize test costs across both markets while giving NewSpace companies proven reliability at minimal engineering overhead. The practice also compresses lead times: launch integrators can order QPL stock rather than wait for bespoke parts. Hence, convergence between commercial-space cadence and military qualification frameworks unlocks incremental revenue without diluting performance expectations.
Avionics Miniaturization Boosts Retrofit Programs
Service life extension projects for fighters such as the F-16 integrate modular mission computers, panoramic displays, and advanced data links that demand higher pin counts in smaller bays. Engineers therefore migrate from legacy Series II circulars to Micro-D packages, gaining up to 40% space savings while maintaining MIL-STD-810 vibration resistance. Retrofit installations often require custom backshells and over-molded cable assemblies, elevating average connector revenue per aircraft compared with new-build programs. Because airworthiness authorities treat connector changes as major modifications, only fully qualified suppliers can compete, concentrating orders among the top tier. The US Air Force estimates each F-16 upgrade kit includes roughly 1,200 new or re-terminated connectors, illustrating the scale of demand embedded in sustainment budgets. Similar dynamics play out in transport, rotary-wing, and tanker fleets, expanding the MIL-SPEC connectors market size inside the aftermarket channel.
Restraints Impact Analysis*
| Restraint | ( ) % Impact on CAGR Forecast | Geographic Relevance | Impact Timeline |
|---|---|---|---|
| Lengthy MIL-qualification and certification cycles | –0.8% | Global | Long term (≥ 4 years) |
| Proliferation of counterfeit components in gray markets | –0.6% | Asia-Pacific focus | Medium term (2-4 years) |
| High pricing versus COTS substitutes in cost-sensitive programs | –0.4% | Emerging markets | Medium term (2-4 years) |
| Tin-whisker and RoHS compliance conflicts | –0.3% | Space and storage apps | Long term (≥ 4 years) |
| Source: Mordor Intelligence | |||
Qualification Cycles Limit Agility
Defense Logistics Agency rules require every new connector family to pass thermal shock, salt-spray, mating-cycle, and electrical-continuity tests before a part number joins the Qualified Products List.[2]Defense Logistics Agency, “MIL-STD-1651,” dla.milCompleting this matrix can consume 18-24 months and more than USD 500,000, which deters small or fast-moving entrants from releasing innovative geometries. Even incumbent vendors face backlog queues at certified labs, delaying time-to-market for derivative products needed to match emerging signal-integrity demands. Program offices sometimes issue temporary “deviations,” yet those waivers rarely span full production runs, so suppliers still must secure full QPL status to win long-term contracts. The extended timeline means designers lock in older connector technologies simply to safeguard schedules, limiting the adoption of next-generation solutions. Consequently, the protracted qualification process tempers overall MIL-SPEC connectors market expansion despite healthy end-user demand.
Counterfeit Risk Adds Compliance Overhead
The Defense Counterintelligence and Security Agency recorded a 22% jump in counterfeit-connector interceptions during 2024 customs inspections, with most incidents tied to gray-market brokers in multi-tier Asian supply chains. Program managers now mandate destructive-testing protocols—X-ray, scanning acoustic microscopy, and metallurgical cross-sectioning—on suspect lots before acceptance. These added steps inflate acquisition lead times by several weeks and raise procurement costs, especially for small-run spares where test fees form a higher share of unit price. Prime contractors also embed serialization and blockchain-based traceability in new harness contracts, further increasing administrative overhead. Some buyers double-source critical part numbers only from QPL OEMs, bypassing independent distributors entirely and narrowing competitive choice. Collectively, the counterfeit threat forces risk-mitigation expenses that offset part of the cost advantage traditionally enjoyed by established suppliers, squeezing margins and slowing contract execution.
*Our forecasts treat driver/restraint impacts as directional, not additive. The impact forecasts reflect baseline growth, mix effects, and variable interactions.
Segment Analysis
By Product Type: Fiber-Optic Uptake Outpaces Legacy Electrical
Fiber-optic products commanded 38.55% of revenue in 2024, anchoring the MIL-SPEC connectors market to bandwidth-intensive C4ISR upgrades.[3]Glenair Inc., “ARINC 801 Fiber Optic Connectors,” glenair.com Hybrid high-speed designs that embed optical and power contacts exhibit the fastest 5.64% CAGR, reflecting weight and integration benefits. Electrical power connectors remain vital for platform electrification; TE Connectivity introduced 1000 A-rated devices that align with the MIL-SPEC connectors market size premium segments.
Advances in expanded-beam termini improve contamination tolerance, unlocking field-deployable optics. Amphenol, ITT Cannon, and Glenair roll out field-cleanable solutions, enhancing reliability on forward operating bases. These innovations help optical categories defend share against ruggedized copper alternatives in harsh combat zones.


By Connector Shape: Circular Dominance Meets Miniature Disruption
Circular styles held 41.29% of 2024 demand, underpinned by MIL-DTL-38999 Series III prevalence in aerospace. Board-to-board formats gain traction as embedded computing migrates into defense electronics. The unmanned-system sub-shape, covering nano and micro miniature housings, is forecasted for a 6.50% CAGR, showing how size, weight, and power constraints reshape the MIL-SPEC connectors market.
Omnetics’ Nano-D line demonstrates performance parity with larger counterparts while saving 50% of space. Amphenol Aerospace Series 5 further compresses shell dimensions by 20% yet sustains environmental sealing, legitimizing miniature circular hybrids for mission computers.
By Platform: Airborne Systems Anchor Revenue Leadership
Airborne programs generated 64.98% of sales in 2024, and cockpit digitalization keeps content high. The MIL-SPEC connectors market size for space applications grows at a 5.24% CAGR as commercial launch vehicle builders replicate defense-grade interconnect bills of materials. Land systems modernize through electrified turrets, while naval projects favor corrosion-resistant platings that drive premium pricing.
NASA’s Artemis human-rated spec cascades MIL-DTL-38999 requirements into private spacecraft, boosting connector content per launch stack. On aircraft, digital fly-by-wire retrofits need additional signal lines, emphasizing contact-density improvements that sustain connector ASPs despite footprint reductions.
By End User: OEM Production Maintains Volume Edge
OEM production captured 59.28% of 2024 spend, leading growth at 4.62% CAGR. New-build fighters such as the F-35 embed 15,000 interconnects each, almost double a fourth-generation jet. The aftermarket trails as improved connector longevity extends mean time between replacement, yet sustainment contracts still rely on QPL-listed vendors to avoid flight-safety risk.
Modular avionics accelerate OEM demand because each line-replaceable unit carries its own I/O suite, multiplying connector counts. Meanwhile, upgrade kits for ground vehicles bundle pre-terminated harnesses that include next-generation power connectors, cushioning aftermarket revenue even as swap-out frequency falls.
Geography Analysis
North America contributes the most significant revenue stream and maintains the deepest qualification bench. Tier-1 suppliers cluster production near aircraft OEMs, reducing logistics costs and ensuring ITAR compliance. Under the Defense Production Act, government incentives prioritize critical-component capacity, cushioning the MIL-SPEC connectors market during external shocks.
Asia-Pacific’s compound growth pivots on rising regional security tensions that accelerate inventory buildup of precision-guided munitions and autonomous platforms. Indigenous programs such as South Korea’s KF-21 and India’s TEDBF fighter prototypes embed MIL-DTL-compatible harnesses, creating incremental demand for international connector vendors offering technology transfer.
Europe’s procurement collaboratives promote connector interface harmonization under STANAG frameworks. This drives multi-country volume orders that improve price-performance ratios yet retain stringent reliability tests. Supply-chain sovereignty goals stimulate investments in plating, molding, and environmental testing within the EU, lowering dependence on single-region sourcing.
Middle East and Africa observe steady adoption as Gulf Cooperation Council states field next-generation air defense systems. However, lower domestic manufacturing capacity means sustained reliance on US and European QPL suppliers. Latin America registers limited volume but could accelerate under fleet-replacement cycles for aging transport aircraft.

Competitive Landscape
Amphenol Corporation, TE Connectivity plc, ITT Inc., Glenair, Inc., and Smiths Interconnect Group Limited (Smiths Group plc) constitute the top quintet, estimated at roughly two-thirds global revenue. Their scale allows concurrent qualification across dozens of MIL-DTL families, yielding high switching barriers. TE’s USD 2.3 billion acquisition of Richards Manufacturing and Amphenol’s USD 2 billion purchase of CIT extend high-frequency and harsh-environment portfolios.
Strategic differentiation hinges on miniaturization, hybrid signal modules, and high-current power designs. Amphenol Aerospace Series 5 shortens shell length by 20% yet meets Series III performance, appealing to UAV integrators. Glenair focuses on fiber-optic expanded-beam contacts for field repair, while ITT Cannon develops filtered variants to mitigate electromagnetic interference in C4ISR nodes.
Emerging players in Turkey, South Korea, and India gain ground with government backing but face export-license hurdles. Qualification capital needs and QPL backlog limit disruptive entry in core aviation segments. Consequently, established brands sustain double-digit operating margins even as raw-material costs rise.
MIL-SPEC Connectors Industry Leaders
Amphenol Corporation
ITT Inc.
Glenair, Inc.
TE Connectivity plc
Smiths Interconnect Group Limited (Smiths Group plc)
- *Disclaimer: Major Players sorted in no particular order

Recent Industry Developments
- September 2024: Amphenol unveiled Rhino Guard MIL-DTL-38999 connectors rated to 1000 A for electric combat vehicles.
- July 2024: PEI-Genesis has introduced the Series Five from Amphenol Aerospace, an enhanced version of the 38999 MIL-SPEC connectors. This connector supports advanced military and space-grade technology applications.


Global MIL-SPEC Connectors Market Report Scope
| Electrical Signal and Power |
| Fiber-Optic |
| RF/Microwave |
| Hybrid High-Speed |
| High-Power/HVDC |
| Circular |
| Rectangular |
| Board-to-Board (BTB) |
| Nano/Micro-Miniature |
| Airborne |
| Land Systems |
| Naval and Sub-Surface |
| Space (Launchers and Satellites) |
| OEM Production |
| Aftermarket/MRO |
| North America | United States | |
| Canada | ||
| Mexico | ||
| Europe | United Kingdom | |
| France | ||
| Germany | ||
| Russia | ||
| Rest of Europe | ||
| Asia-Pacific | China | |
| India | ||
| Japan | ||
| South Korea | ||
| Australia | ||
| Rest of Asia-Pacific | ||
| South America | Brazil | |
| Rest of South America | ||
| Middle East and Africa | Middle East | Saudi Arabia |
| United Arab Emirates | ||
| Rest of Middle East | ||
| Africa | South Africa | |
| Rest of Africa | ||
| By Product Type | Electrical Signal and Power | ||
| Fiber-Optic | |||
| RF/Microwave | |||
| Hybrid High-Speed | |||
| High-Power/HVDC | |||
| By Connector Shape | Circular | ||
| Rectangular | |||
| Board-to-Board (BTB) | |||
| Nano/Micro-Miniature | |||
| By Platform | Airborne | ||
| Land Systems | |||
| Naval and Sub-Surface | |||
| Space (Launchers and Satellites) | |||
| By End User | OEM Production | ||
| Aftermarket/MRO | |||
| By Geography | North America | United States | |
| Canada | |||
| Mexico | |||
| Europe | United Kingdom | ||
| France | |||
| Germany | |||
| Russia | |||
| Rest of Europe | |||
| Asia-Pacific | China | ||
| India | |||
| Japan | |||
| South Korea | |||
| Australia | |||
| Rest of Asia-Pacific | |||
| South America | Brazil | ||
| Rest of South America | |||
| Middle East and Africa | Middle East | Saudi Arabia | |
| United Arab Emirates | |||
| Rest of Middle East | |||
| Africa | South Africa | ||
| Rest of Africa | |||


Key Questions Answered in the Report
What is the current size and projected growth rate of the MIL-SPEC connectors market?
The MIL-SPEC connectors market size stands at USD 2.16 billion in 2025 and is projected to reach USD 2.62 billion by 2030, reflecting a 3.94% CAGR.
Which product category commands the largest revenue share?
Fiber-optic connectors hold 38.55% of 2024 sales, reflecting growing bandwidth needs.
Which connector shape remains dominant in defense platforms?
Circular styles, especially MIL-DTL-38999 Series III, account for 41.29% of revenue.
Which platform segment delivers the bulk of demand?
Airborne systems generate 64.98% of 2024 revenue thanks to avionics-heavy architectures.
Which geographic region is expanding the fastest?
Asia-Pacific is projected to grow at a 4.29% CAGR through 2030 on rising defense budgets.
What main factor slows new product introduction?
DLA qualification cycles can reach 24 months and cost USD 0.5 million per connector family.
How do counterfeit components impact procurement?
Added inspection and traceability requirements extend lead times and elevate acquisition costs.
Why are nano-pitch connectors gaining popularity?
Autonomous and unmanned platforms favor Nano-D designs that cut weight while retaining MIL reliability.
Page last updated on:


