Middle East Snack Bar Market Size and Share
Market Overview
| Study Period | 2021 - 2031 |
|---|---|
| Forecast Data Period | 2026 - 2031 |
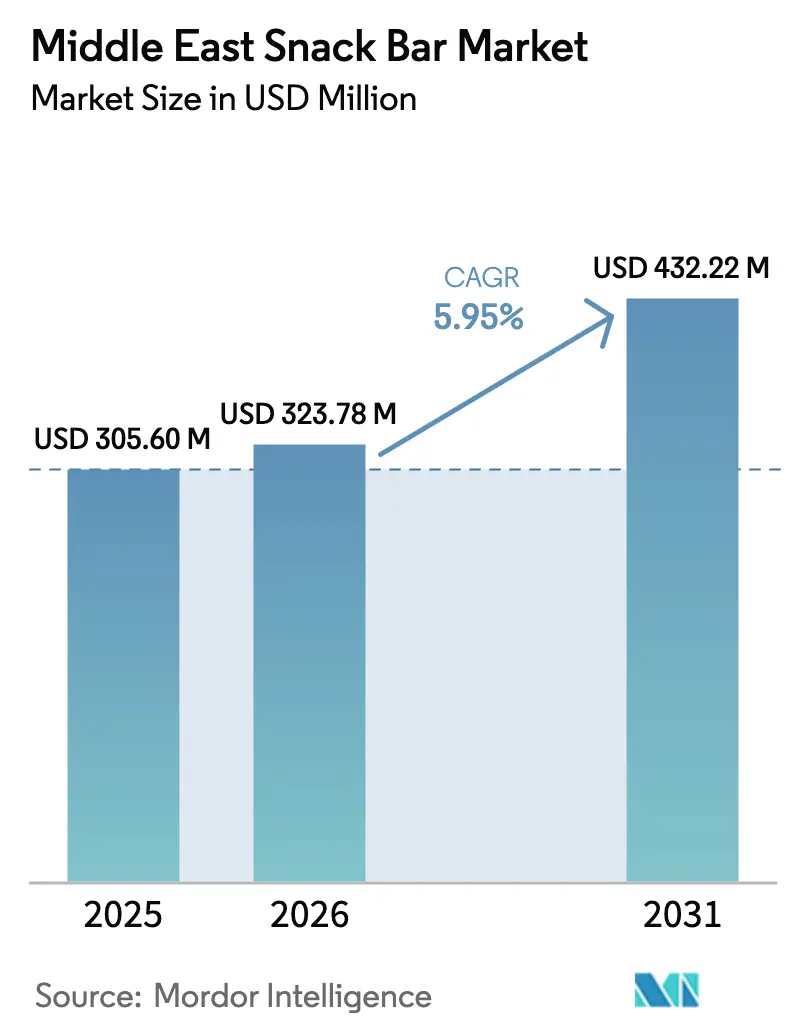
| Base Year Market Size (2025) | USD 305.60 Million |
| Market Size (2026) | USD 323.78 Million |
| Market Size (2031) | USD 432.22 Million |
| Growth Rate (2026 - 2031) | 5.95% CAGR |
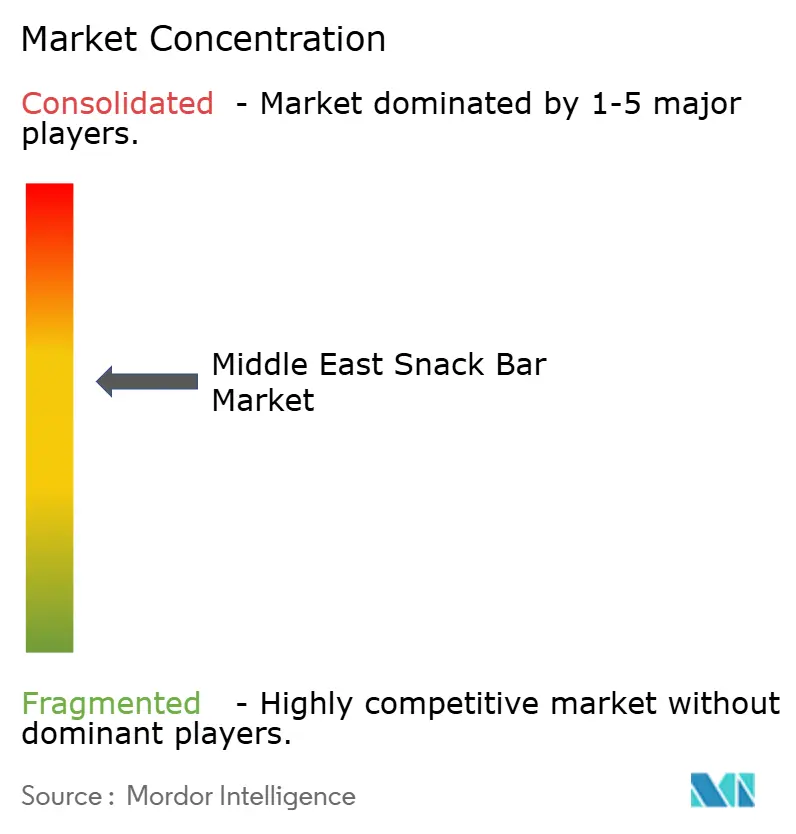
| Market Concentration | Medium |
Major Players *Disclaimer: Major Players sorted in no particular order Image © Mordor Intelligence. Reuse requires attribution under CC BY 4.0. | |
Middle East Snack Bar Market Analysis by Mordor Intelligence
The Middle East snack bar market size was valued at USD 305.60 million in 2025 and estimated to grow from USD 323.78 million in 2026 to reach USD 432.22 million by 2031, at a CAGR of 5.95% during the forecast period (2026-2031). Urbanization, longer commuting times, and the increasing participation of women in the workforce, particularly in the United Arab Emirates (UAE) and Saudi Arabia, are driving a shift in eating habits toward portable options that fill meal gaps. Manufacturers are leveraging government-led wellness initiatives, taxes on sugar-sweetened beverages, and the availability of shelf-stable products in fuel-station convenience stores, which enhance product visibility. The rapid expansion of electronic commerce (e-commerce), the trend of premiumization, and culturally relevant flavor innovations—such as date-based and pistachio-kunafa variants—are creating new opportunities for both established global players and emerging regional competitors. Stricter regulations on Arabic-language labeling and halal certification are increasing compliance costs but also discouraging low-cost, non-compliant imports, thereby strengthening the overall value of the category.
Key Report Takeaways
- By product type, cereal bars led with 83.67% of the Middle East snack bar market share in 2025, while protein bars are forecast to expand at a 7.70% CAGR through 2031.
- By ingredient base, granola and oat bars captured 33.42% of the Middle East snack bar market size in 2025, while dairy and protein formulations are advancing at a 7.58% CAGR to 2031.
- By price tier, mass products held 79.35% of regional revenue in 2025, while premium bars are projected to post a 7.62% CAGR through 2031.
- By distribution channel, supermarkets/hypermarkets commanded 54.74% of revenue in 2025, while online retail stores are growing fastest at a 7.76% CAGR.
- By geography, Saudi Arabia generated 24.10% of the 2025 value, while the United Arab Emirates is forecast to deliver the highest regional CAGR at 7.64% through 2031.
Note: Market size and forecast figures in this report are generated using Mordor Intelligence’s proprietary estimation framework, updated with the latest available data and insights as of 2026.
Middle East Snack Bar Market Trends and Insights
Drivers Impact Analysis*
| Driver | (~)% Impact on CAGR Forecast | Geographic Relevance | Impact Timeline |
|---|---|---|---|
| Rising awareness of healthy eating habits and nutrition | +1.2% | Saudi Arabia, United Arab Emirates, Qatar (strongest); spillover to Kuwait, Bahrain | Medium term (2-4 years) |
| Popularity of fitness, wellness, and weight management programs | +1.4% | United Arab Emirates, Saudi Arabia core; expanding to Oman, Kuwait | Medium term (2-4 years) |
| Introduction of organic, vegan, gluten-free, and allergen-friendly snack bars | +0.9% | United Arab Emirates, Saudi Arabia urban centers; niche adoption in Qatar, Bahrain | Long term (≥ 4 years) |
| Westernization of diets and food preferences among urban populations | +1.0% | United Arab Emirates, Saudi Arabia, Qatar metropolitan areas | Short term (≤ 2 years) |
| Rapid innovation in snack bar flavors and formats | +0.8% | United Arab Emirates (Dubai, Abu Dhabi), Saudi Arabia (Riyadh, Jeddah) | Short term (≤ 2 years) |
| Increasing demand for convenient, on-the-go nutrition | +1.3% | All GCC markets; strongest in United Arab Emirates and Saudi Arabia | Short term (≤ 2 years) |
| Source: Mordor Intelligence | |||


Rising Awareness of Healthy Eating Habits and Nutrition
Government-led wellness campaigns are significantly shaping consumer behavior across the Gulf region. Saudi Arabia's Healthy Habits initiative, which aims to achieve a 30% reduction in obesity rates by 2030, reflects the country's commitment to improving public health. Similarly, the United Arab Emirates' (UAE) National Nutrition Strategy 2030 mandates front-of-pack labeling for high-sugar products, ensuring greater transparency for consumers. These policies are driving a notable increase in demand for snack bars with clean-label claims, encouraging manufacturers to reformulate their products using natural sweeteners such as dates and stevia to meet consumer expectations. A 2024 survey conducted by YouGov revealed that 57% of UAE residents desire clearer health information on packaging, while 68% emphasize the importance of reducing plastic usage. This shift highlights that sustainability and transparency are no longer optional but have become essential factors influencing purchasing decisions. In Qatar, the National Action Plan on Obesity, launched in 2024, incorporates initiatives such as school-based nutrition education and retail incentives for healthier snack options. These measures are fostering growth opportunities for snack bars positioned as meal replacements or post-exercise recovery aids. Furthermore, the Saudi Food and Drug Authority's (SFDA) sugar-sweetened beverage tax, introduced in 2024, has indirectly benefited low-sugar snack bars by redirecting consumer spending from sugary soft drinks to solid snack options that provide satiety without incurring additional fiscal penalties.
Popularity of Fitness, Wellness, and Weight Management Programs
Gym penetration in the United Arab Emirates has significantly outpaced that of Saudi Arabia. Both markets are rapidly expanding their facilities, with the United Arab Emirates hosting a substantial number of gyms and Saudi Arabia exceeding this figure. Notably, women-only fitness centers in Saudi Arabia are experiencing robust growth at a compound annual growth rate through the end of the decade. This fitness boom is directly driving protein bar consumption, as the Middle East sports nutrition market is projected to grow steadily during the same period. Protein bars are increasingly popular as a convenient post-workout option, requiring no refrigeration or preparation. Brands such as Per4m, FRO ZEN, and Myprotein leveraged the viral "Dubai Chocolate" trend by introducing protein bars infused with pistachio and kunafa flavors. These products combine indulgence with functionality, appealing to younger consumers who monitor their macronutrient intake but prefer flavorful options over bland formulations. Additionally, the United Arab Emirates's significant share of female gym memberships and Saudi Arabia's increasing female workforce participation—exceeding the Vision 2030 target—are broadening the market beyond the traditional male bodybuilder demographic.
Introduction of Organic, Vegan, Gluten-Free, and Allergen-Friendly Snack Bars
Plant-based and free-from product formats are establishing premium niches, particularly in the UAE. In 2024, NotCo introduced a Dubai-style plant-based chocolate bar containing protein, available at specialty outlets and Carrefour hypermarkets. Examples of premium pricing in this segment include MRITA's vegan protein bars and Roobar's organic protein bars, which highlight consumers' willingness to pay a premium for certifications such as United States Department of Agriculture (USDA) Organic and Vegan Society approval. The Middle East organic food market is expected to grow at a compound annual growth rate (CAGR) in the coming years, driven by expatriate demand in Dubai and Abu Dhabi, as well as a growing local segment concerned about pesticide residues and animal welfare. Gluten-free and allergen-friendly bars cater to a smaller but vocal consumer base, with products like Misfits' vegan protein bar in Kuwait targeting individuals with celiac disease or lactose intolerance, addressing a previously underserved need for shelf-stable options. Halal certification remains a critical requirement, as composite bars containing whey or gelatin must carry Gulf Standards Organization (GSO)-compliant halal marks. However, organic and vegan labels are emerging as additional quality indicators, enabling products to command price premiums over conventional cereal bars. According to the Soil Association, organic and natural are no longer considered mere buzzwords in the Middle East; they are increasingly viewed as preventive medicine. Growing awareness of organic alternatives, combined with a renewed focus on health and wellbeing, has led to organic and natural product suppliers in the Middle East reporting a 300-400% increase in demand for their products[1]Source: Soil Association, “Growing opportunities for organic in the Middle East,” soilassociation.org.
Westernization of Diets and Food Preferences Among Urban Populations
Expatriates form a significant portion of the population in the United Arab Emirates and Saudi Arabia, bringing with them eating habits that favor grab-and-go formats over traditional sit-down meals. This demographic trend has driven the growth of snack bars, a category that was virtually nonexistent in Gulf Cooperation Council (GCC) retail a decade ago but now occupies dedicated aisles in stores such as LuLu, Carrefour, and Sultan Center. Long commute times in cities like Dubai and Riyadh create opportunities for consumption where traditional Arabic breakfast items like labneh and khubz are impractical, paving the way for cereal and protein bars that are portable and convenient. The expansion of international coffee chains, which stock branded snack bars at checkout counters, has further normalized this category. Starbucks and Costa Coffee outlets across the Gulf prominently display brands such as KIND, RXBAR, and LÄRABAR, integrating these products into daily routines. Additionally, younger, urban Saudis and Emiratis—many of whom have been educated abroad—demonstrate snacking habits similar to their Western counterparts, with a strong preference for ready-to-eat meals and convenience over home cooking.
Restraints Impact Analysis*
| Restraint | (~)% Impact on CAGR Forecast | Geographic Relevance | Impact Timeline |
|---|---|---|---|
| Cultural preferences for fresh or homemade snack options | -0.6% | Oman, Bahrain, Kuwait traditional segments; rural Saudi Arabia | Long term (≥ 4 years) |
| Stringent labeling, import, and ingredient regulations | -0.4% | All Gulf Cooperation Council markets; strongest enforcement in Saudi Arabia, United Arab Emirates | Medium term (2-4 years) |
| Limited shelf space in smaller retail outlets | -0.3% | Oman, Bahrain, Kuwait; rural areas across all Gulf Cooperation Council markets | Medium term (2-4 years) |
| Lack of consumer awareness regarding nutritional labels and their benefits | -0.2% | All Gulf Cooperation Council markets; most pronounced in Oman, Bahrain, rural Saudi Arabia | Long term (≥ 4 years) |
| Source: Mordor Intelligence | |||
Cultural Preferences for Fresh or Homemade Snack Options
Traditional retail formats, such as independent grocers and baqalas (small neighborhood stores), continue to play a significant role in the grocery markets of Oman and Bahrain. In these outlets, packaged snack bars face stiff competition for shelf space against fresh dates, nuts, and homemade halwa. Older consumers and rural households in Saudi Arabia's southern provinces tend to prefer freshly prepared snacks that align with their multigenerational eating traditions, resulting in lower trial rates for Western-style snack bars. Although clean-label reformulations have been introduced, many still perceive packaged bars as containing artificial preservatives or excessive sugar, a perception influenced by earlier products that prioritized shelf life over ingredient transparency. Retailers observe that snack bars often experience slower turnover in smaller outlets compared to ambient staples like biscuits or chips, which discourages inventory investment and relegates snack bars to less prominent display positions. This trend becomes particularly evident during Ramadan, when families focus on preparing elaborate iftar spreads at home, leading to a temporary decline in packaged snack sales, while beverages and confectionery products see increased demand.
Stringent Labeling, Import, and Ingredient Regulations
The Saudi Food and Drug Authority and the United Arab Emirates' Emirates Authority for Standardization and Metrology enforce requirements such as Arabic-language nutrition panels, allergen declarations, and halal certification for composite products [2]Source: Saudi Food and Drug Authority, “Halal,” sfda.gov.sa . These regulations significantly extend product-launch timelines and add certification costs per stock-keeping unit. Imported bars containing gelatin, non-halal emulsifiers, or alcohol-based flavorings are either banned outright or require reformulation, creating substantial barriers for several European brands attempting to enter the market. Furthermore, Gulf Cooperation Council standards require protein content claims to be validated through third-party laboratory testing, while front-of-pack health logos must receive prior approval. Smaller brands often face challenges navigating these processes without the support of local regulatory consultants. The United Arab Emirates' update to its Food Safety Law introduced traceability requirements for all imported food products, obligating distributors to maintain detailed batch-level documentation linking each product to its origin and manufacturing date. While these measures are designed to protect consumers, they also tend to favor established brands with dedicated regulatory teams in the Gulf Cooperation Council region, making it more difficult for startups to disrupt the market unless they collaborate with local distributors who can manage the compliance responsibilities.
*Our forecasts treat driver/restraint impacts as directional, not additive. The impact forecasts reflect baseline growth, mix effects, and variable interactions.
Segment Analysis
By Product Type: Protein Bars Outpace Legacy Cereal Formats
Protein bars are expected to grow at a CAGR of 7.70% from 2026 to 2031, marking the fastest growth among product types. This growth is attributed to the increasing number of gym-goers and heightened awareness of sports nutrition, which are driving demand for high-protein, low-sugar options that support muscle recovery and satiety. Cereal bars, holding 83.67% of the market share in 2025, continue to lead in volume due to their affordability. Energy bars, on the other hand, cater to endurance athletes and outdoor enthusiasts who value quick-release carbohydrates over protein content. Brands like Clif Bar and PowerBar distribute these products through specialty sports retailers and select hypermarkets. Meanwhile, fruit and nut bars, often positioned as organic or vegan, remain a niche segment with premium pricing.
The surge in protein bars is supported by a shift toward ingredients like whey isolate and casein, which deliver 15 to 20 grams of protein per 60-gram bar. Cereal bars, however, face challenges from commoditization, as private-label products from retailers such as Carrefour and LuLu undercut branded options by 15% to 20%. This has prompted established players like Kellogg and General Mills to focus on limited-edition flavors and on-pack promotions to retain shelf space. Energy bars are seeing moderate growth, driven by the UAE's growing trail-running and cycling communities. However, their reliance on high-glycemic syrups limits their appeal among health-conscious consumers who are increasingly mindful of sugar content.


By Ingredient Base: Dairy and Protein Formulations Lead Growth
Dairy and protein-based bars are expected to grow at a CAGR of 7.58% from 2026 to 2031, marking the fastest growth among ingredient bases. This trend is fueled by formulators using whey protein concentrate and milk protein isolate to meet the rising demand for sports nutrition. Granola and oat-based bars, projected to hold a 33.42% market share in 2025, continue to dominate the market. Their popularity stems from their cost efficiency—oats and rolled grains are more affordable than whey—and their appeal as wholesome breakfast options for families. Date-based bars, which resonate culturally, are also gaining traction, supported by regional brands like ZAD Food and Linah Farms.
Nut-based bars, while positioned as premium products, face challenges due to the price volatility of almonds and cashews. For example, global almond prices surged by 18% in 2024 due to droughts in California, squeezing margins for brands without long-term supplier contracts. To address ingredient risks, formulators are increasingly adopting hybrid blends that combine oats, dates, and nuts. This strategy not only diversifies ingredient sourcing but also enables claims such as "5 grams of protein" or "no added sugar" without relying on a single, high-cost ingredient.
By Price Tier: Premium Segment Gains as Affluence Rises
Premium bars are expected to grow at a CAGR of 7.62% from 2026 to 2031, as higher disposable incomes and increasing health awareness encourage consumers to spend more on organic, vegan, or protein-enriched options. In 2025, mass-tier bars dominated the market with an 79.35% share, largely driven by cereal bars that offer affordable breakfast or school-snack solutions for middle-income households. On the other hand, premium bars cater to affluent consumers in cities like Dubai, Abu Dhabi, and Riyadh, who value clean labels, sustainability, and functional benefits such as high protein content or low sugar levels.
A 2024 YouGov survey highlighted that 72% of shoppers in the United Arab Emirates and Saudi Arabia are willing to pay more for quality, while around 36% are ready to pay a premium for sustainable packaging. These preferences explain the 50% to 100% price difference between mass-tier and premium bars. The rise in the premium segment is also reflected in new product launches. For example, NotCo introduced a plant-based chocolate bar with 7 grams of protein, AMRITA launched vegan protein bars, and Roobar debuted an organic bar priced at AED 12.50. These products, launched in 2024, have secured placements in Carrefour and Spinneys, which cater to expatriates and high-net-worth local consumers.

By Distribution Channel: E-Commerce Disrupts Traditional Retail
Online retail stores are projected to grow at a CAGR of 7.76% from 2026 to 2031, emerging as the fastest-growing distribution channel in the market. This growth is primarily driven by the rising popularity of quick-commerce platforms such as Talabat, Noon, and Deliveroo. These platforms have enhanced convenience by delivering snack bars and other grocery items in under 30 minutes, accounting for over 40% of the United Arab Emirates' online grocery market volume. Their ability to address consumer demand for speed and convenience has established them as significant players in the evolving retail market. According to the International Trade Association, the United Arab Emirates leads eCommerce among Gulf Cooperation Council (GCC) states, with eCommerce sales comprising approximately 10% of total retail sales .
Meanwhile, supermarkets and hypermarkets maintained a dominant position in 2025, holding a 54.74% market share. This success is underpinned by strategic initiatives such as LuLu's rollout of 90 new stores across the Gulf Cooperation Council and Carrefour's expansion in Saudi Arabia, which includes partnerships for local sourcing and the introduction of private-label products that offer competitive pricing against branded snack bars. Additionally, convenience stores like Abu Dhabi National Oil Company (ADNOC) On the Go, with over 500 locations, and 7-Eleven, which plans to establish 200 stores in the UAE by 2025, continue to cater to commuters and impulse buyers. These stores focus on accessibility and proximity, addressing the needs of customers who prioritize convenience over a broad product selection.
Geography Analysis
Saudi Arabia emerged as the leading segment in the Middle East snack bar market in 2025, capturing 24.10% of the region's revenue. This significant share is driven by the Kingdom's large population of 36 million, alongside government-backed wellness initiatives such as the Healthy Habits campaign, which aims to reduce obesity by 30% by 2030. Additionally, the introduction of a sugar-sweetened beverage tax has encouraged consumers to shift towards healthier, lower-sugar alternatives, further boosting the demand for snack bars. These factors collectively position Saudi Arabia as a dominant force in the regional market.
The United Arab Emirates (UAE) stands out as the fastest-growing segment, with a projected Compound Annual Growth Rate (CAGR) of 7.64% from 2026 to 2031. This rapid growth is fueled by the increasing penetration of e-commerce, as online grocery sales are forecasted to grow from USD 2.7 billion in 2023 to USD 15.4 billion by 2032, reflecting a robust CAGR of 21.60%. Furthermore, the UAE benefits from an extensive network of convenience stores, including Abu Dhabi National Oil Company (ADNOC) On the Go's 500-plus locations and 7-Eleven's planned expansion to 200 stores by 2025. These developments, combined with the country's focus on modern retail infrastructure, make the UAE a key growth driver in the Middle East snack bar market.
Other markets, including Qatar, Oman, Kuwait, and Bahrain, collectively contribute to the remaining share of the market, with varying levels of modern retail penetration—55% in Qatar, 50% in Bahrain, 45% in Kuwait, and 40% in Oman—highlighting their differing stages of retail evolution. Qatar's National Action Plan on Obesity, launched in 2024, emphasizes school-based nutrition education and retail incentives for healthier snack options, creating opportunities for snack bars positioned as meal replacements. In Kuwait, established retailers such as Sultan Center, with over 70 stores, and Saveco, with more than 60 stores, provide strong distribution networks for multinational brands. However, traditional baqalas still dominate 55% of the grocery market, limiting shelf space for packaged snack bars. Meanwhile, the Rest of the Middle East, including Jordan, Lebanon, and Iraq, faces challenges such as currency volatility, import restrictions, and political instability, which complicate supply chains and deter multinational investment. Despite these hurdles, the convergence of fitness trends, expanding digital commerce infrastructure, and government-supported nutrition initiatives across the Gulf Cooperation Council (GCC) markets ensures sustained mid-single-digit growth. The UAE's rapid growth and Saudi Arabia's market scale together create a dual-engine model that offsets slower progress in smaller markets, while LuLu Retail's planned rollout of 90 stores across the GCC, announced at Gulfood 2025, is expected to further enhance market accessibility and growth potential.
Competitive Landscape
The Middle East snack bar market is moderately concentrated, with multinational corporations such as Nestlé, Mars, Kellogg, PepsiCo, General Mills, and Mondelēz holding significant market shares. These companies leverage their global supply chains, established distributor relationships, and extensive product portfolios to maintain their dominance. Products like Kellogg's Nutri-Grain and General Mills' Nature Valley occupy prime shelf positions in hypermarkets such as LuLu and Carrefour, supported by substantial trade-spend budgets that smaller brands often cannot match. Additionally, Mars' acquisition of KIND Snacks and Kellogg's ownership of RXBAR have strengthened their presence in the premium-tier segment, while their legacy cereal-bar portfolios continue to dominate the mass-tier segment, which accounts for 80.11% of the market share.
The premium-tier segment, growing at a compound annual growth rate (CAGR) of 7.78%, is a key area of focus for both multinational and regional players. PepsiCo's DuBiotech (Dubai Biotechnology and Research Park) innovation center, inaugurated in 2024, exemplifies the localization of research and development (R&D) efforts. This facility develops Middle East-specific formulations, such as date-sweetened Quaker bars and saffron-infused energy bites, which are tailored to regional tastes and preferences before being scaled across Gulf Cooperation Council (GCC) markets. Regional disruptors are also carving out niches by emphasizing local ingredients and cultural authenticity. Products like ZAD Food's tamriya bars, Bateel's date-and-almond bars, and Linah Farms' organic date snacks resonate with consumers seeking alternatives to Western-style granola bars, further driving growth in this segment.
Private-label products are emerging as a structural challenge for mid-tier brands. Retailers such as Carrefour and LuLu offer their own-brand granola bars at prices 15% to 20% lower than branded alternatives, appealing to the 66% of UAE and 79% of Saudi consumers who regularly purchase private-label products. E-commerce platforms like Noon and Talabat are also enabling niche brands to reach consumers without the need for hypermarket distribution, lowering barriers to entry and further fragmenting the market. Additionally, regulatory compliance, such as halal certification mandated by the Saudi Food and Drug Authority (SFDA) and the UAE's Emirates Authority for Standardization and Metrology (ESMA), creates a level playing field for all market participants. However, established players with dedicated regulatory teams are better positioned to navigate these requirements, ensuring their continued competitiveness in the market.
Middle East Snack Bar Industry Leaders
Associated British Foods PLC
Bright Lifecare Private Limited
Ferrero International SA
General Mills Inc.
Glanbia PLC
- *Disclaimer: Major Players sorted in no particular order

Recent Industry Developments
- June 2025: General Mills launched Mott's new soft-baked apple filled bars, featuring three fruity flavors with real fruit and whole wheat flour exterior. The product innovation addresses consumer demand for convenient, nutrient-dense snack bars combining wholesome ingredients and natural flavors.
- April 2025: PepsiCo Inc. announced plans to inaugurate its first innovation hub in Saudi Arabia, designed to foster innovation and development for snacks and beverages across the Kingdom. The facility will serve as a regional center for product development, research, and collaboration with local partners and entrepreneurs to drive market growth in the Middle East snacks sector.
- January 2025: Nature Valley, a brand under General Mills, has committed to achieving 100% recyclable packaging for its global snack bar portfolio by 2025. This initiative demonstrates the brand's focus on environmental sustainability and adherence to circular economy principles. The commitment applies to all Nature Valley product lines, including granola bars, soft-baked bars, and crispy creamy wafer bars, across key markets.


Middle East Snack Bar Market Report Scope
Cereal Bar, Fruit & Nut Bar, Protein Bar are covered as segments by Confectionery Variant. Convenience Store, Online Retail Store, Supermarket/Hypermarket, Others are covered as segments by Distribution Channel. Bahrain, Kuwait, Oman, Qatar, Saudi Arabia, United Arab Emirates are covered as segments by Country.| Cereal Bar |
| Energy Bar |
| Protein Bar |
| Fruit and Nut Bar |
| Nut-based bars |
| Granola/Oat-based |
| Date-based |
| Dairy/Protein-based |
| Hybrid blends |
| Other Forms |
| Mass |
| Premium |
| Supermarket/Hypermarket |
| Online Retail Store |
| Convenience Store |
| Other Distribution Channels |
| Bahrain |
| Kuwait |
| Oman |
| Qatar |
| Saudi Arabia |
| United Arab Emirates |
| Rest of Middle East |
| By Product Type | Cereal Bar |
| Energy Bar | |
| Protein Bar | |
| Fruit and Nut Bar | |
| By Ingredient Base | Nut-based bars |
| Granola/Oat-based | |
| Date-based | |
| Dairy/Protein-based | |
| Hybrid blends | |
| Other Forms | |
| By Price Tier | Mass |
| Premium | |
| By Distribution Channel | Supermarket/Hypermarket |
| Online Retail Store | |
| Convenience Store | |
| Other Distribution Channels | |
| By Geography | Bahrain |
| Kuwait | |
| Oman | |
| Qatar | |
| Saudi Arabia | |
| United Arab Emirates | |
| Rest of Middle East |


Market Definition
- Milk and White Chocolate - Milk chocolates is a solid chocolate made with milk (in the form of either milk powder, liquid milk, or condensed milk) and cocoa solids. White chocolate is made from cocoa butter and milk and contains no cocoa solids whatsoever. The scope includes regular chocolates, low-sugar, and sugar-free variants
- Toffees & Nougats - Toffees include hard, chewy, and small or one-bite candies marketed with labels as toffee or toffee-like confectionery. Nougat is a chewy confection with almond, sugar, and egg white as a basic ingredient; and it originated in Europe and Middle East countries.
- Cereals Bars - A snack composed of breakfast cereal that has been compressed into a bar shape and is held together with a form of edible adhesive. The scope includes snack bars made with cereals such as rice, oats, corn, etc. mixed with a binding syrup. These also include products labeled as cereal bars, cereal treat bars, or grain bars.
- Chewing Gum - This is a preparation for chewing, usually made of flavored and sweetened chicle or such substitutes as polyvinyl acetate. The types of chewing gums included in the scope are sugar-chewing gums and sugar-free chewing gums
| Keyword | Definition |
|---|---|
| Dark Chocolate | Dark chocolate is a form of chocolate containing cocoa solids and cocoa butter without the milk. |
| White Chocolate | White chocolate is the type of chocolate containing the highest percentage of milk solids, typically around or over 30 percent. |
| Milk Chocolate | Milk chocolate is made from dark chocolate that has a low cocoa solid content and higher sugar content, plus a milk product. |
| Hard Candy | A candy made of sugar and corn syrup boiled without crystallizing. |
| Toffees | A hard, chewy, often brown sweet that is made from sugar boiled with butter. |
| Nougats | A chewy or brittle candy containing almonds or other nuts and sometimes fruit. |
| Cereal bar | A cereal bar is a bar-shaped food product, made by pressing cereals and usually dried fruit or berries, which are in most cases held together by glucose syrup. |
| Protein bar | Protein bars are nutrition bars that contain a high proportion of protein to carbohydrates/fats. |
| Fruit & Nut bar | These are often based on dates with other dried fruit and nut additions and, in some cases, flavorings. |
| NCA | The National Confectioners Association is an American trade organization that promotes chocolate, candy, gum and mints, and the companies that make these treats. |
| CGMP | Current good manufacturing practices are those conforming to the guidelines recommended by relevant agencies. |
| Unstandardized foods | Unstandardized foods are those that do not have a standard of identity or that deviate from a prescribed standard in any manner. |
| GI | The glycemic index (GI) is a way of ranking carbohydrate-containing foods based on how slowly or quickly they are digested and increase blood glucose levels over a period of time |
| Skimmed milk powder | Skimmed milk powder is obtained by removing water from pasteurized skim milk by spray-drying. |
| Flavanols | Flavanols are a group of compounds found in cocoa, tea, apples, and many other plant-based foods and beverages. |
| WPC | Whey protein concentrate- the substance obtained by the removal of sufficient nonprotein constituents from pasteurized whey so that the finished dry product contains greater than 25% protein. |
| LDL | Low density Lipoprotein- the bad cholesterol |
| HDL | High density Lipoprotein- the good cholesterol |
| BHT | butylated Hydroxytoluene is a lab-made chemical that is added to foods as a preservative. |
| Carrageenan | Carrageenan is an additive used to thicken, emulsify, and preserve foods and drinks. |
| Free form | Not containing certain ingredients, such as gluten, dairy, or sugar. |
| Cocoa butter | It is a fatty substance obtained from cocoa beans, used in the manufacture of confectionery. |
| Pastellies | A type of of Brazilian candy made from sugar, eggs, and milk. |
| Draggees | Small, round candies that are coated with a hard sugar shell |
| CHOPRABISCO | Royal Belgian Association of the chocolate, pralines, biscuit, and confectionery industry- A trade association that represents the Belgian chocolate industry. |
| European Directive 2000/13 | A European Union directive that regulates the labeling of food products |
| Kakao-Verordnung | The German chocolate ordinance, a set of regulations that define what can be labeled as "chocolate" in Germany. |
| FASFC | Federal Agency for the Safety of the Food Chain |
| Pectin | A natural substance that is derived from fruits and vegetables. It is used in confectionery to create a gel-like texture. |
| Invert sugars | A type of sugar that is made up of glucose and fructose. |
| Emulsifier | A substance that helps to mix to liquids that does not mix together. |
| Anthocyanins | A type of flavonoid that is responsible for the red, purple, and blue colors of confectionery. |
| Functional Foods | Foods that have been modified to provide additional health benefits beyond basic nutrition. |
| Kosher certificate | This certification verifies that the ingredients, production process including all machinery, and/or food-service process complies with the standards of Jewish dietary law |
| Chicory root extract | A natural extract from the chicory root that is a good source of fiber, calcium, phosphorous, and folate |
| RDD | Recommended daily dose |
| Gummies | A chewy gelatin-based candy that is often flavored with fruit. |
| Nutraceuticals | Food or dietary supplements that are claimed to have health benefits. |
| Energy bars | Snack bars that are high in carbohydrates and calories are designed to provide energy on the go. |
| BFSO | Belgian Food Safety Organization for the food chain. |


Research Methodology
Mordor Intelligence follows a four-step methodology in all our reports.
- Step-1: Identify Key Variables: In order to build a robust forecasting methodology, the variables and factors identified in Step 1 are tested against available historical market numbers. Through an iterative process, the variables required for market forecast are set, and the model is built on the basis of these variables.
- Step-2: Build a Market Model: Market-size estimations for the forecast years are in nominal terms. Inflation is not a part of the pricing, and the average selling price (ASP) is kept constant throughout the forecast period for each country.
- Step-3: Validate and Finalize: In this important step, all market numbers, variables, and analyst calls are validated through an extensive network of primary research experts from the market studied. The respondents are selected across levels and functions to generate a holistic picture of the market studied.
- Step-4: Research Outputs: Syndicated Reports, Custom Consulting Assignments, Databases & Subscription Platforms


