
Market Overview
| Study Period | 2021 - 2031 |
|---|---|
| Forecast Data Period | 2026 - 2031 |
| Base Year Market Size (2025) | 49.26 gigawatt |
| Market Volume (2026) | 54.85 gigawatt |
| Market Volume (2031) | 102.40 gigawatt |
| Growth Rate (2026 - 2031) | 13.30 % |
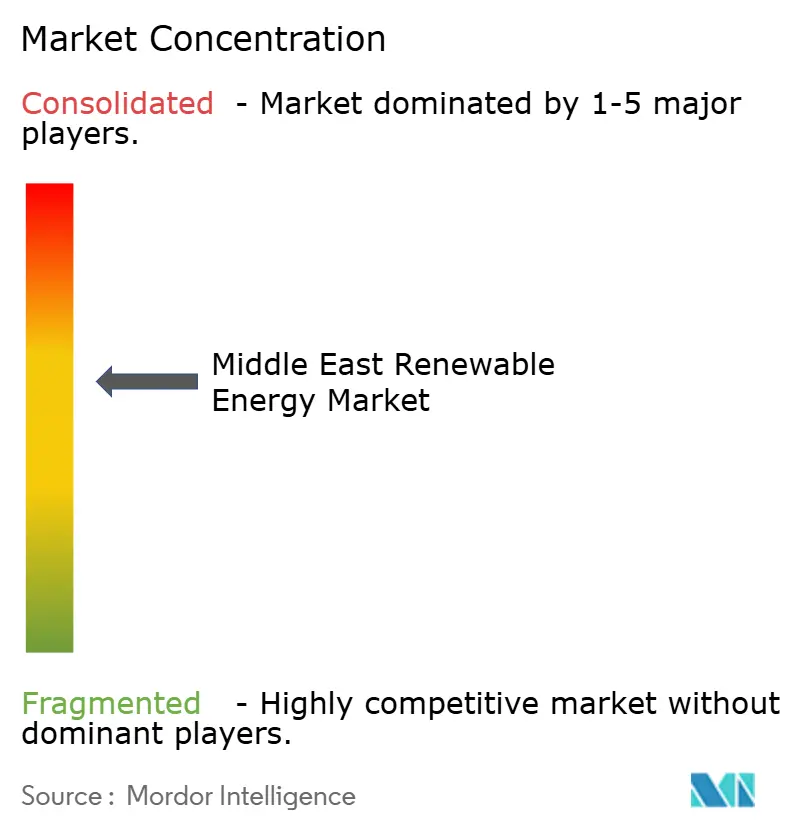
| Market Concentration | Medium |
Major Players *Disclaimer: Major Players sorted in no particular order Image © Mordor Intelligence. Reuse requires attribution under CC BY 4.0. | |
Middle East Renewable Energy Market Analysis by Mordor Intelligence
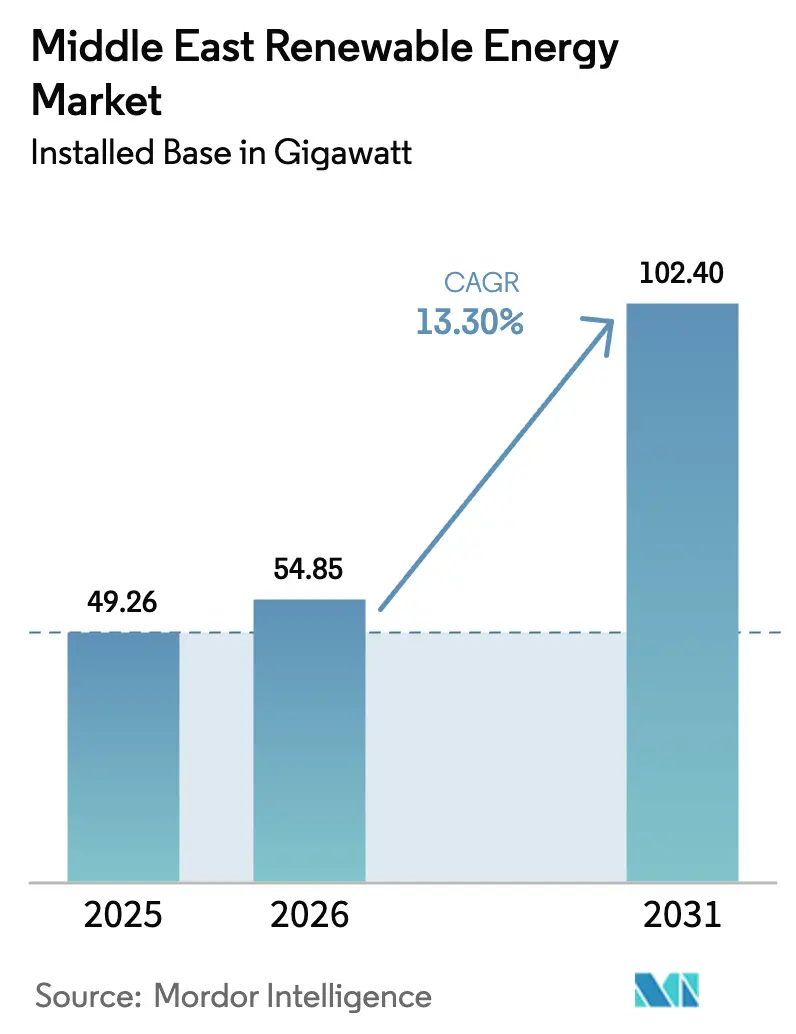
The Middle East Renewable Energy Market size in terms of installed base is projected to expand from 49.26 gigawatt in 2025 and 54.85 gigawatt in 2026 to 102.40 gigawatt by 2031, registering a CAGR of 13.30% between 2026 to 2031.
Strong national decarbonization targets, steep solar-and-wind cost declines, and green-hydrogen export ambitions are steering capital away from hydrocarbons and toward utility-scale and distributed projects. Sovereign wealth funds are underwriting tender pipelines, while European majors and Chinese module makers are locking in multi-gigawatt supply agreements. Grid-modernization programs, the rollout of battery-energy-storage systems, and an expanding power-purchase-agreement market are further accelerating deployment. Execution risk persists, yet the investment case strengthens as technology learning curves compress levelized costs and policy frameworks tighten around net-zero deadlines.
Key Report Takeaways
- By technology, Solar Energy led with a 54.51% Middle East renewable energy market share in 2025; Wind Energy is forecast to grow at an 18.56% CAGR to 2031.
- By end-user, the Utilities segment accounted for 75.29% of the Middle East renewable energy market size in 2025, while Commercial and Industrial installations are advancing at a 25.63% CAGR through 2031.
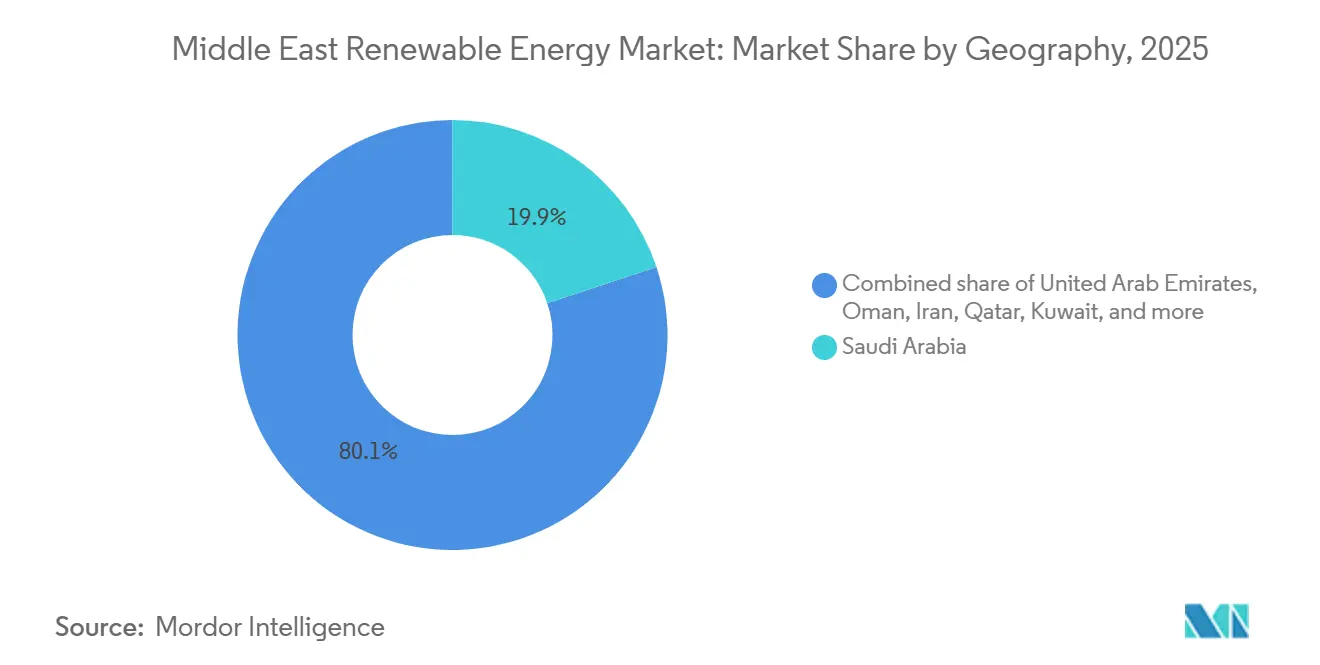
- By geography, Saudi Arabia held 19.87% of the Middle East renewable energy market share in 2025 and is expanding at a 34.22% CAGR to 2031.
Note: Market size and forecast figures in this report are generated using Mordor Intelligence’s proprietary estimation framework, updated with the latest available data and insights as of January 2026.
Market Trends and Insights
Drivers Impact Analysis of Middle East Renewable Energy Market*
| Driver | (~) % Impact on CAGR Forecast | Geographic Relevance | Impact Timeline |
|---|---|---|---|
| Ambitious 2030–2050 national renewable-energy targets | 4.5% | Saudi Arabia, UAE, Oman, Qatar, Kuwait; spillover to Jordan and Bahrain | Long term (≥ 4 years) |
| Rapid solar-PV and wind LCOE decline | 3.2% | Global, with acute impact in Saudi Arabia, UAE, Jordan, and Oman | Medium term (2-4 years) |
| Green-hydrogen export mega-projects pipeline | 2.8% | Saudi Arabia (NEOM), UAE, Oman; export corridors to Europe and Asia | Long term (≥ 4 years) |
| Off-grid hybrid micro-grids for desert tourism & mining | 1.5% | Saudi Arabia (NEOM tourism), UAE remote facilities, Oman mining zones | Short term (≤ 2 years) |
| Abundant solar irradiance & wind corridors | 2.5% | Saudi Arabia, UAE, Oman, Jordan; highest impact in desert regions with >2,200 kWh/m² annual irradiance | Long term (≥ 4 years) |
| Source: Mordor Intelligence | |||
Ambitious 2030–2050 National Renewable-Energy Targets
Binding clean-energy objectives are redirecting public spending, fast-tracking tenders, and crowding out new thermal capacity. Saudi Arabia must add 18 GW annually to hit its 130 GW 2030 goal, a pace that dwarfs its 2024 base.[1] The UAE’s 50% clean-power mandate funnels sovereign capital into public-private partnerships that de-risk early-stage development. Qatar and Kuwait have set smaller but symbolic quotas that broaden the regional procurement funnel. Targets anchor pipeline visibility, yet slippage in grid upgrades or land acquisition can delay follow-on investments in hydrogen and desalination, exposing financiers to cascading project-timeline risk.
Rapid Solar-PV and Wind LCOE Decline
Photovoltaic and onshore-wind tariffs now undercut gas-fired generation, making renewables the default choice for greenfield capacity. Regional solar LCOE averaged USD 37 per MWh in 2025 and is on track to hit USD 17 by 2060.[2] Saudi Arabia’s Dawadmi wind bid at 1.34 cents per kWh erased the economic rationale for new thermal plants.[3] Module oversupply, bifacial-panel efficiency gains, and tracker optimization have sliced balance-of-system costs by 22% since 2024. While utilities secure 25-year PPAs at sub-2-cent tariffs, equipment makers face thinner margins, forcing a pivot toward next-generation technologies and service revenues.
Green-Hydrogen Export Mega-Projects Pipeline
Gigawatt-scale hydrogen ventures convert domestic solar and wind resources into export commodities that diversify hydrocarbon economies. The USD 8.4 billion NEOM plant combines 4 GW of renewables to produce 600 t/d of hydrogen for ammonia conversion bound for Europe.[4] Masdar’s Abu Dhabi and Omani projects target 1 million t/y by 2030, demanding 15–20 GW of dedicated capacity. Long-dated offtake agreements de-risk renewable build-outs, but concentration in a handful of mega-facilities magnifies exposure to electrolyzer delays or construction overruns.
Off-Grid Hybrid Microgrids for Desert Tourism & Mining
Remote resorts, defense posts, and mineral sites are replacing diesel with solar-plus-storage systems that cut fuel use by up to 70%. NEOM’s hospitality zones deploy 500 kW–5 MW microgrids that align with luxury sustainability branding. High avoided-fuel costs, modular design, and quick permitting grant developers premium tariffs and faster paybacks. Standardizing microgrid controls under IEC 62898 is emerging as a priority to scale deployments across varied loads and harsh climates.
Restraints Impact Analysis of Middle East Renewable Energy Market*
| Restraint | (~) % Impact on CAGR Forecast | Geographic Relevance | Impact Timeline |
|---|---|---|---|
| Persistent fossil-fuel power subsidies | -1.8% | Saudi Arabia, UAE, Kuwait, Qatar, Bahrain; limited impact in Jordan and Oman | Medium term (2-4 years) |
| Limited grid interconnection & storage capacity | -1.4% | Saudi Arabia, UAE, Oman; acute in Kuwait and Bahrain | Short term (≤ 2 years) |
| Desert soiling & water-usage challenges for PV | -1.2% | Saudi Arabia, UAE, Kuwait, Qatar; regions with high dust concentration and water scarcity | Medium term (2-4 years) |
| Source: Mordor Intelligence | |||
Persistent Fossil-Fuel Power Subsidies
Gulf retail tariffs as low as USD 0.048 / kWh undercut rooftop-solar economics and slow distributed adoption. A 1% subsidy rollback correlates with a 10.61% jump in renewable generation, yet political sensitivities push reforms to 2027 and beyond in Kuwait and Qatar. Two-tier markets emerge where subsidized households stick with grid power while utility-scale solar flourishes under competitive tenders. The gap limits addressable demand for residential installers and defers mass-market battery uptake.
Limited Grid Interconnection & Storage Capacity
Legacy networks, built for baseload thermal plants, strain under variable solar and wind influx. Saudi Arabia’s 7.8 GWh storage project adds only four hours of cover, leaving multi-day wind lulls unresolved. The GCC Interconnection Authority’s USD 3.5 billion upgrade aims to double cross-border transfer capacity by 2028, but right-of-way hurdles are already pushing milestones into 2027. Developers are forced to co-locate storage, accept curtailment, or rethink project sizing, all of which compress returns.
*Our forecasts treat driver/restraint impacts as directional, not additive. The impact forecasts reflect baseline growth, mix effects, and variable interactions.
Middle East Renewable Energy Market Segment Analysis
By Technology:
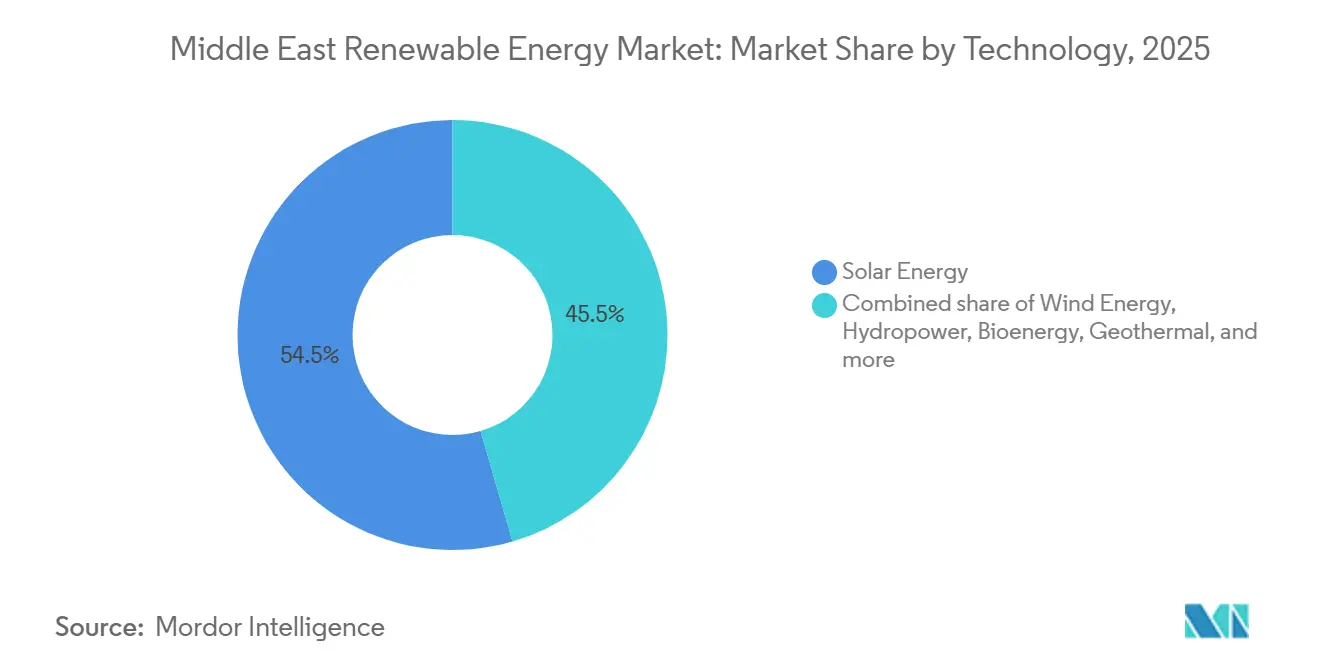
Solar Dominance Anchors TransitionSolar Energy held 54.51% of the Middle East renewable energy market in 2025 and is advancing at an 18.56% CAGR through 2031. This outsized share reflects irradiance levels above 2,200 kWh/m² in Saudi Arabia and the UAE, rapid module cost declines, and supportive tender frameworks. Concentrated-solar-power plants such as Dubai’s 950 MW Noor Energy 1 add 5,907 MWh of molten-salt storage, providing evening dispatch that photovoltaics alone cannot match. Wind installations cluster along Saudi Arabia’s northern highlands and Oman’s coasts, where capacity factors top 40%. Hydropower and bioenergy remain marginal due to resource limitations, while geothermal and ocean technologies sit at the pilot stage.
Aggressive procurement favors high-performance hardware. First Solar shipped 1.8 GW of cadmium-telluride panels prized for high-temperature resilience, whereas JinkoSolar delivered 3.1 GW of bifacial Tiger Neo modules that capitalize on ground-albedo gains. Siemens Gamesa and Vestas are vying to supply 1.5 GW of turbines for Saudi Arabia’s Dawadmi project. The Middle East renewable energy market size for wind could swell if forthcoming Red Sea offshore studies confirm 45%-plus capacity factors, yet solar will remain the anchor technology through 2031.

By End-User:
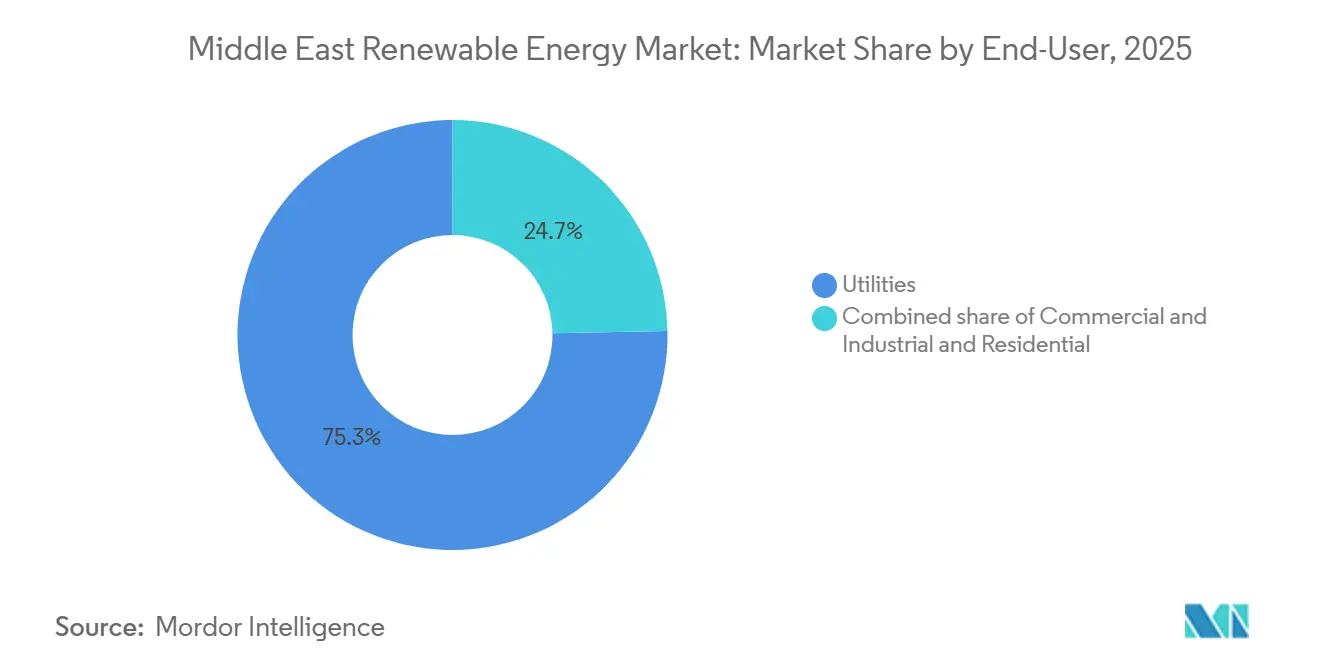
Commercial and Industrial Surge Reshapes DemandUtilities controlled 75.29% of 2025 capacity, reflecting sovereign-backed gigawatt tenders and long-term PPAs. Commercial and Industrial customers, however, are expanding at a 25.63% CAGR, outpacing every other category as multinational firms pursue on-site generation to meet global net-zero targets. Yellow Door Energy’s solar-as-a-service model covers more than 500 MW across 100 sites, helping clients shave 20–30% off energy bills in unsubsidized zones. Saudi Arabia’s rooftop-solar initiative seeks 3 GW of corporate installs by 2030, while the UAE already hosts 1.5 GW on warehouse and logistics roofs.
Residential uptake lags due to subsidized tariffs and split-incentive hurdles. Jordan is the exception, posting 10% household penetration thanks to higher retail rates and 30-day permit cycles. As commercial fleets scale, demand grows for modular batteries sized at 100 kW–2 MW and energy-management software that optimizes load shifting. The Middle East renewable energy market will therefore see distributed systems erode the utility share but complement rather than cannibalize grid-scale additions.
Geography Analysis
GCC Renewable Energy Market
Saudi Arabia’s procurement pipeline exceeds 50 GW, anchored by NEOM’s USD 8.4 billion hydrogen complex that absorbs 4 GW of solar and wind and guarantees long-term offtake. The UAE’s diversified pathway taps Masdar’s global 100 GW ambition and pairs 19 GW of domestic renewables with nuclear baseload to stabilize supply. Oman is positioning Duqm as a logistics bridge to European and Asian hydrogen markets, requiring dedicated transmission corridors and port retrofits.
Middle East Renewable Energy Market
Israel’s 7.5 GW renewables base meets 20% of power demand but faces land scarcity, steering growth to rooftops and agrivoltaics. Jordan’s streamlined permitting delivers 27% renewable penetration, the region’s highest, while Qatar’s Al Kharsaah and Siraj 1 plants push the emirate toward its 5 GW 2035 goal. Kuwait’s Shagaya park contends with land-use disputes that could delay its 15% 2030 target. Bahrain, with limited space, leans on distributed solar, initiating a 710 MW pipeline through 2035 to hedge reliance on imported gas.
Iran, Iraq and Yemen Renewable Energy Market
Iran’s 1.2 GW capacity reflects sanctions-constrained finance, yet high irradiance in Yazd and Semnan offers latent potential. Iraq’s 1 GW Basra solar plant signals interest in diversifying export-dependent revenues. Conflict-affected Yemen and smaller territories add less than 5% capacity, showing that governance quality outweighs resource endowment when scaling the Middle East renewable energy market.
Regulatory Landscape
Competitive IPP procurement and tighter climate and grid-compliance requirements continue to shape the Middle East renewable energy market. In Saudi Arabia, the National Renewable Energy Program, overseen by the Ministry of Energy and tendered through the Saudi Power Procurement Company (SPPC), remains the primary mechanism for awarding long-term PPAs. SPPC has expanded the qualified-developer pool for Round 7, covering 5,300 MW of solar and wind projects (announced July 2026). The Saudi Electricity Regulatory Authority (SERA) provides the licensing and market rules that support bankability for utility-scale projects.
Across the region, network-access pricing and climate compliance are also becoming more explicit. Morocco's National Electricity Regulatory Authority (ANRE) updated transmission and distribution network-use tariffs starting 1 March 2026 and set a time-bound tariff for surplus energy for 1 March 2026 to 28 February 2027, improving cost visibility for private developers and distributed generators. In the UAE, Federal Decree-Law No. 11 of 2024 on reduction of climate change effects entered full compliance requirements for all entities operating in the country as of 30 May 2026, pushing corporates and free-zone operators to integrate carbon-reduction governance alongside project-level permitting and grid-connection requirements.
Competitive Landscape
Utility-scale development is moderately concentrated. ACWA Power operates 9.5 GW with another 10 GW under development, leveraging sovereign guarantees to bid sub-2-cent tariffs. Masdar, armed with Abu Dhabi backing, targets a 100 GW global portfolio by 2030, coupling regional assets with ventures in Africa and Central Asia. TotalEnergies and Engie blend utility solar with hydrogen offtake and rooftop plays, diversifying revenue streams.
In the distributed segment, fragmentation is rising. Yellow Door Energy finances and operates on-site arrays for commercial customers across the UAE and Saudi Arabia, a capital-light model that skirts grid bottlenecks. Technological rivalry between JinkoSolar’s high-efficiency bifacial modules and First Solar’s high-temperature cadmium-telluride panels drives procurement decisions in sandy, high-heat environments. Battery providers and microgrid-software startups are entering to supply storage-as-a-service, signaling a pivot from pure capacity addition to integrated energy solutions. Regulatory heterogeneity around wheeling charges, net metering, and foreign ownership still favors incumbents with deep local partnerships.
Middle East Renewable Energy Industry Leaders
-
Yellow Door Energy
-
ACWA Power
-
Masdar
-
EDF Renewables
-
JinkoSolar
- *Disclaimer: Major Players sorted in no particular order
Middle East Renewable Energy Market Companies Covered in this Report
- ACWA Power
- Masdar (Abu Dhabi Future Energy Co.)
- EDF Renewables
- Yellow Door Energy
- JinkoSolar
- First Solar
- Siemens Gamesa
- GE Renewable Energy
- Vestas
- Engie
- TotalEnergies Renewables
- Enel Green Power
- Scatec Solar
- Abengoa
- Canadian Solar
- Siraj Power
- MASE
- Enerwhere Sustainable Energy
- Akuo Energy
- ACWA Power Barka SAOG
- Solarwind ME
Market Opportunities and Future Outlook
The most visible whitespace sits where utility-scale renewables are being paired with firmed, dispatchable supply. Masdar's solar plus battery program in Abu Dhabi provides a clear signal, reaching financial close in July 2026 for a 5.2 GW solar and 19 GWh BESS project, with procurement structured around grid needs beyond midday solar peaks. This supports demand for battery integrators, hybrid plant controls, and EPC capabilities suited to desert operating conditions and high cycling requirements.
Transmission planning and a more formal tender pipeline also create a second opportunity set in Oman and adjacent markets. Oman Electricity Transmission Company (OETC) published a 2026-2030 capability statement describing plans for four 1 GW solar IPPs starting from 2028-29, which increases near-term visibility for developers, lenders, and equipment suppliers looking for multi-project scale. At the same time, the region is working through a financing and delivery gap against 2030 targets. IRENA points to a collective GCC investment gap against its 165 GW ambition, leaving space for capital providers, structured PPAs, and local supply-chain investment that can reduce delivered cost and lead times.
Recent Industry Developments in Middle East Renewable Energy Market
- June 2026: Masdar finalized an agreement to acquire a 49.99% stake in Repsol's 705 MW renewable portfolio in Spain for around EUR 849 million (about USD 978 million), comprising operational wind and solar assets with a 565 MW hybridization pipeline. The deal extends Masdar's operational footprint and adds optionality around wind-solar-battery upgrades, reinforcing the region's shift toward hybridized, dispatchable renewables. Closing is subject to regulatory approvals, with completion targeted by end-2026.
- January 2026: ENGIE achieved financial closure on the 1.5 GW Khazna Solar Park in Abu Dhabi. The financing milestone advances a large utility-scale project through bankability gates, supporting the emirate's capacity build-out and reinforcing the role of competitively tendered IPPs in scaling solar.
- January 2025: Masdar and EWEC announced plans for a large solar and battery project combining 5.2 GW of solar generation with 19 GWh of storage to deliver up to 1 GW of steady output. The configuration highlighted an emerging procurement model focused on firm renewable power, widening demand for grid-scale BESS, energy management systems, and hybrid-plant engineering.
Middle East Renewable Energy Market Report Scope and Research Methodology
Market Definition and Coverage
For this methodology, the Middle East renewable energy market is defined as grid connected renewable electricity generation capacity additions and the resulting installed base across Middle East countries, tracked by technology and project commissioning status.
Scope exclusions: Off grid captive systems that are not reported in national power statistics, and upstream equipment manufacturing revenues, are excluded from the market size.
Segments Covered in This Report
- By Technology
- Solar Energy (PV and CSP)
- Wind Energy (Onshore and Offshore)
- Hydropower (Small, Large, PSH)
- Bioenergy
- Geothermal
- Ocean Energy (Tidal and Wave)
- By End-User
- Utilities
- Commercial and Industrial
- Residential
- By Geography
- United Arab Emirates
- Saudi Arabia
- Oman
- Iran
- Israel
- Jordan
- Qatar
- Kuwait
- Bahrain
- Rest of Middle East
Data Sources, Market Sizing, and Validation
Desk Research
Desk research was used to build the starting dataset for capacity, generation, and policy signals that drive renewable project commissioning in the Middle East. We relied on public releases and recurring statistical series, such as IRENA renewable capacity statistics, IEA regional energy data, the World Bank energy indicators, UN Comtrade trade statistics for key equipment proxies, and electricity market publications from OPEC and national energy ministries and regulators.
On the company side, annual reports, investor presentations, project press releases, and tender award notices helped us map major plants, planned additions, and timelines that later get checked in interviews. We also used paid subscriptions for company financials and news, and patent databases for tracking technology activity and localization moves, which supported assumption checks on build rates and cost learning. These desk sources are illustrative only, and additional public documents were reviewed to fill gaps, validate figures, and clarify definitions.
Primary Interviews and Surveys
Primary work focused on validating what gets commissioned versus what is only announced, and on aligning assumptions around grid readiness, permitting, and project financing timelines in major Middle East markets. We spoke with a mix of developers, EPC participants, utilities and system operators, and policy and advisory stakeholders to pressure test capacity pipelines, technology shares, and retirement or repowering plans.
Distribution of primary research fieldwork respondents
| Company type | Respondent position |
|---|---|
| Top tier: 33% | CXOs: 15% |
| Mid tier: 48% | Functional/Unit leaders: 40% |
| Smaller Players: 19% | Managers: 45% |
Market-Sizing & Forecasting
The market was sized mainly through a top-down reconstruction of the installed base, where official capacity series and project commissioning records are used to build yearly totals by technology, and then rolled up to the regional market number. To keep the result grounded, we corroborated totals with selective bottom-up checks, such as sampling large project capacities, tender award volumes, and typical build schedules, and then adjusting for slippages when dates did not line up.
Key model inputs included announced and awarded utility scale tenders, commissioning and grid connection timelines, technology mix shifts (solar, wind, hydro, and bioenergy where relevant), capacity factor expectations tied to resource quality, and policy targets and auction calendars that shape demand. Where country level data was sparse, gaps were handled by using conservative ranges for pipeline conversion rates and applying them only after being validated through interviews.
For forecasting, scenario analysis was used to reflect different build out paths that depend on permitting speed, grid expansion, and financing appetite, and then a central case was selected using expert consensus. The output is expressed in installed capacity terms, and it remains traceable to capacity additions and retirements rather than to price assumptions.
Data Validation & Update Cycle
Validation was done by comparing modeled capacity additions against multiple independent signals, including national statistics releases, auction award volumes, and known commissioning milestones. Large variances were flagged, reviewed, and then rechecked through follow up calls when the difference could be explained by delays, cancellations, or reclassification of projects.
Before sign off, the model and write up go through multi step analyst review, where inputs, math checks, and country roll ups are verified and anomalies are resolved. Reports are refreshed annually, and interim updates are made when material events occur, such as major auction rounds, policy changes, or large project cancellations. Right before delivery, a final pass is completed so the most current view is reflected in the final output.
Mordor Intelligence's Middle East Renewable Energy Market Size Measured Against Other Published Estimates
Published market sizes can look far apart because some sources size renewables as a dollar value, while others track the physical system footprint as installed capacity. Differences also come from geography choices, treatment of projects that are announced but not yet commissioned, and whether totals are reported as nameplate capacity or as generation equivalents.
The table shows a spread mainly because the benchmark here is capacity based, and in Mordor Intelligence's model the market is sized as installed renewable capacity in the Middle East and it counts additions when projects reach commissioning or verified grid connection, instead of valuing equipment or construction spend.
Benchmark comparison
| Source | Market Size | Gaps in Research Methodology |
|---|---|---|
| Mordor Intelligence | USD 49.26 B (2025) | |
| Industry Publisher A | USD 26.80 B (2024) | Reported as an investment or revenue style market value with a different base year, and it can include broader MENA coverage and value chain spend that is not tied to commissioned capacity. |
| Trade Source B | USD 52.00 B (2025) | Often reflects stated investment plans and policy target values, so projects that are announced or under development may be counted earlier than commissioning, which can inflate the current year total. |
Looking across the three figures, the main takeaway is that unit choice and timing rules drive most of the difference, not just growth expectations. By anchoring totals to commissioning linked capacity additions and checking those assumptions with on the ground stakeholders, the estimate stays repeatable and easier to audit year to year.
Key Questions Answered in the Report
What is the current installed renewable capacity in the Middle East renewable energy market?
Installed capacity stands at 54.85 GW in 2026 and is projected to climb to 102.40 GW by 2031.
Which technology dominates new additions in the Middle East renewable landscape?
Solar Energy leads, accounting for 54.51% of 2025 capacity and growing at an 18.56% CAGR.
How fast is Saudi Arabia expanding clean-energy assets?
Saudi Arabia is adding renewables at a 34.22% CAGR, supported by Vision 2030 targets and record-low tender tariffs.
Why are Commercial and Industrial buyers accelerating procurement?
Corporate sustainability mandates and sub-grid-parity solar tariffs are driving a 25.63% CAGR for Commercial and Industrial installations.
What restrains rooftop-solar adoption despite strong irradiance?
Deep fossil-fuel subsidies keep retail electricity prices low, delaying parity for residential systems.