
Market Overview
| Study Period | 2020 - 2031 |
|---|---|
| Forecast Data Period | 2026 - 2031 |
| Base Year Market Size (2025) | USD 405.34 Million |
| Market Size (2026) | USD 426.33 Million |
| Market Size (2031) | USD 548.8 Million |
| Growth Rate (2026 - 2031) | 5.18 % |
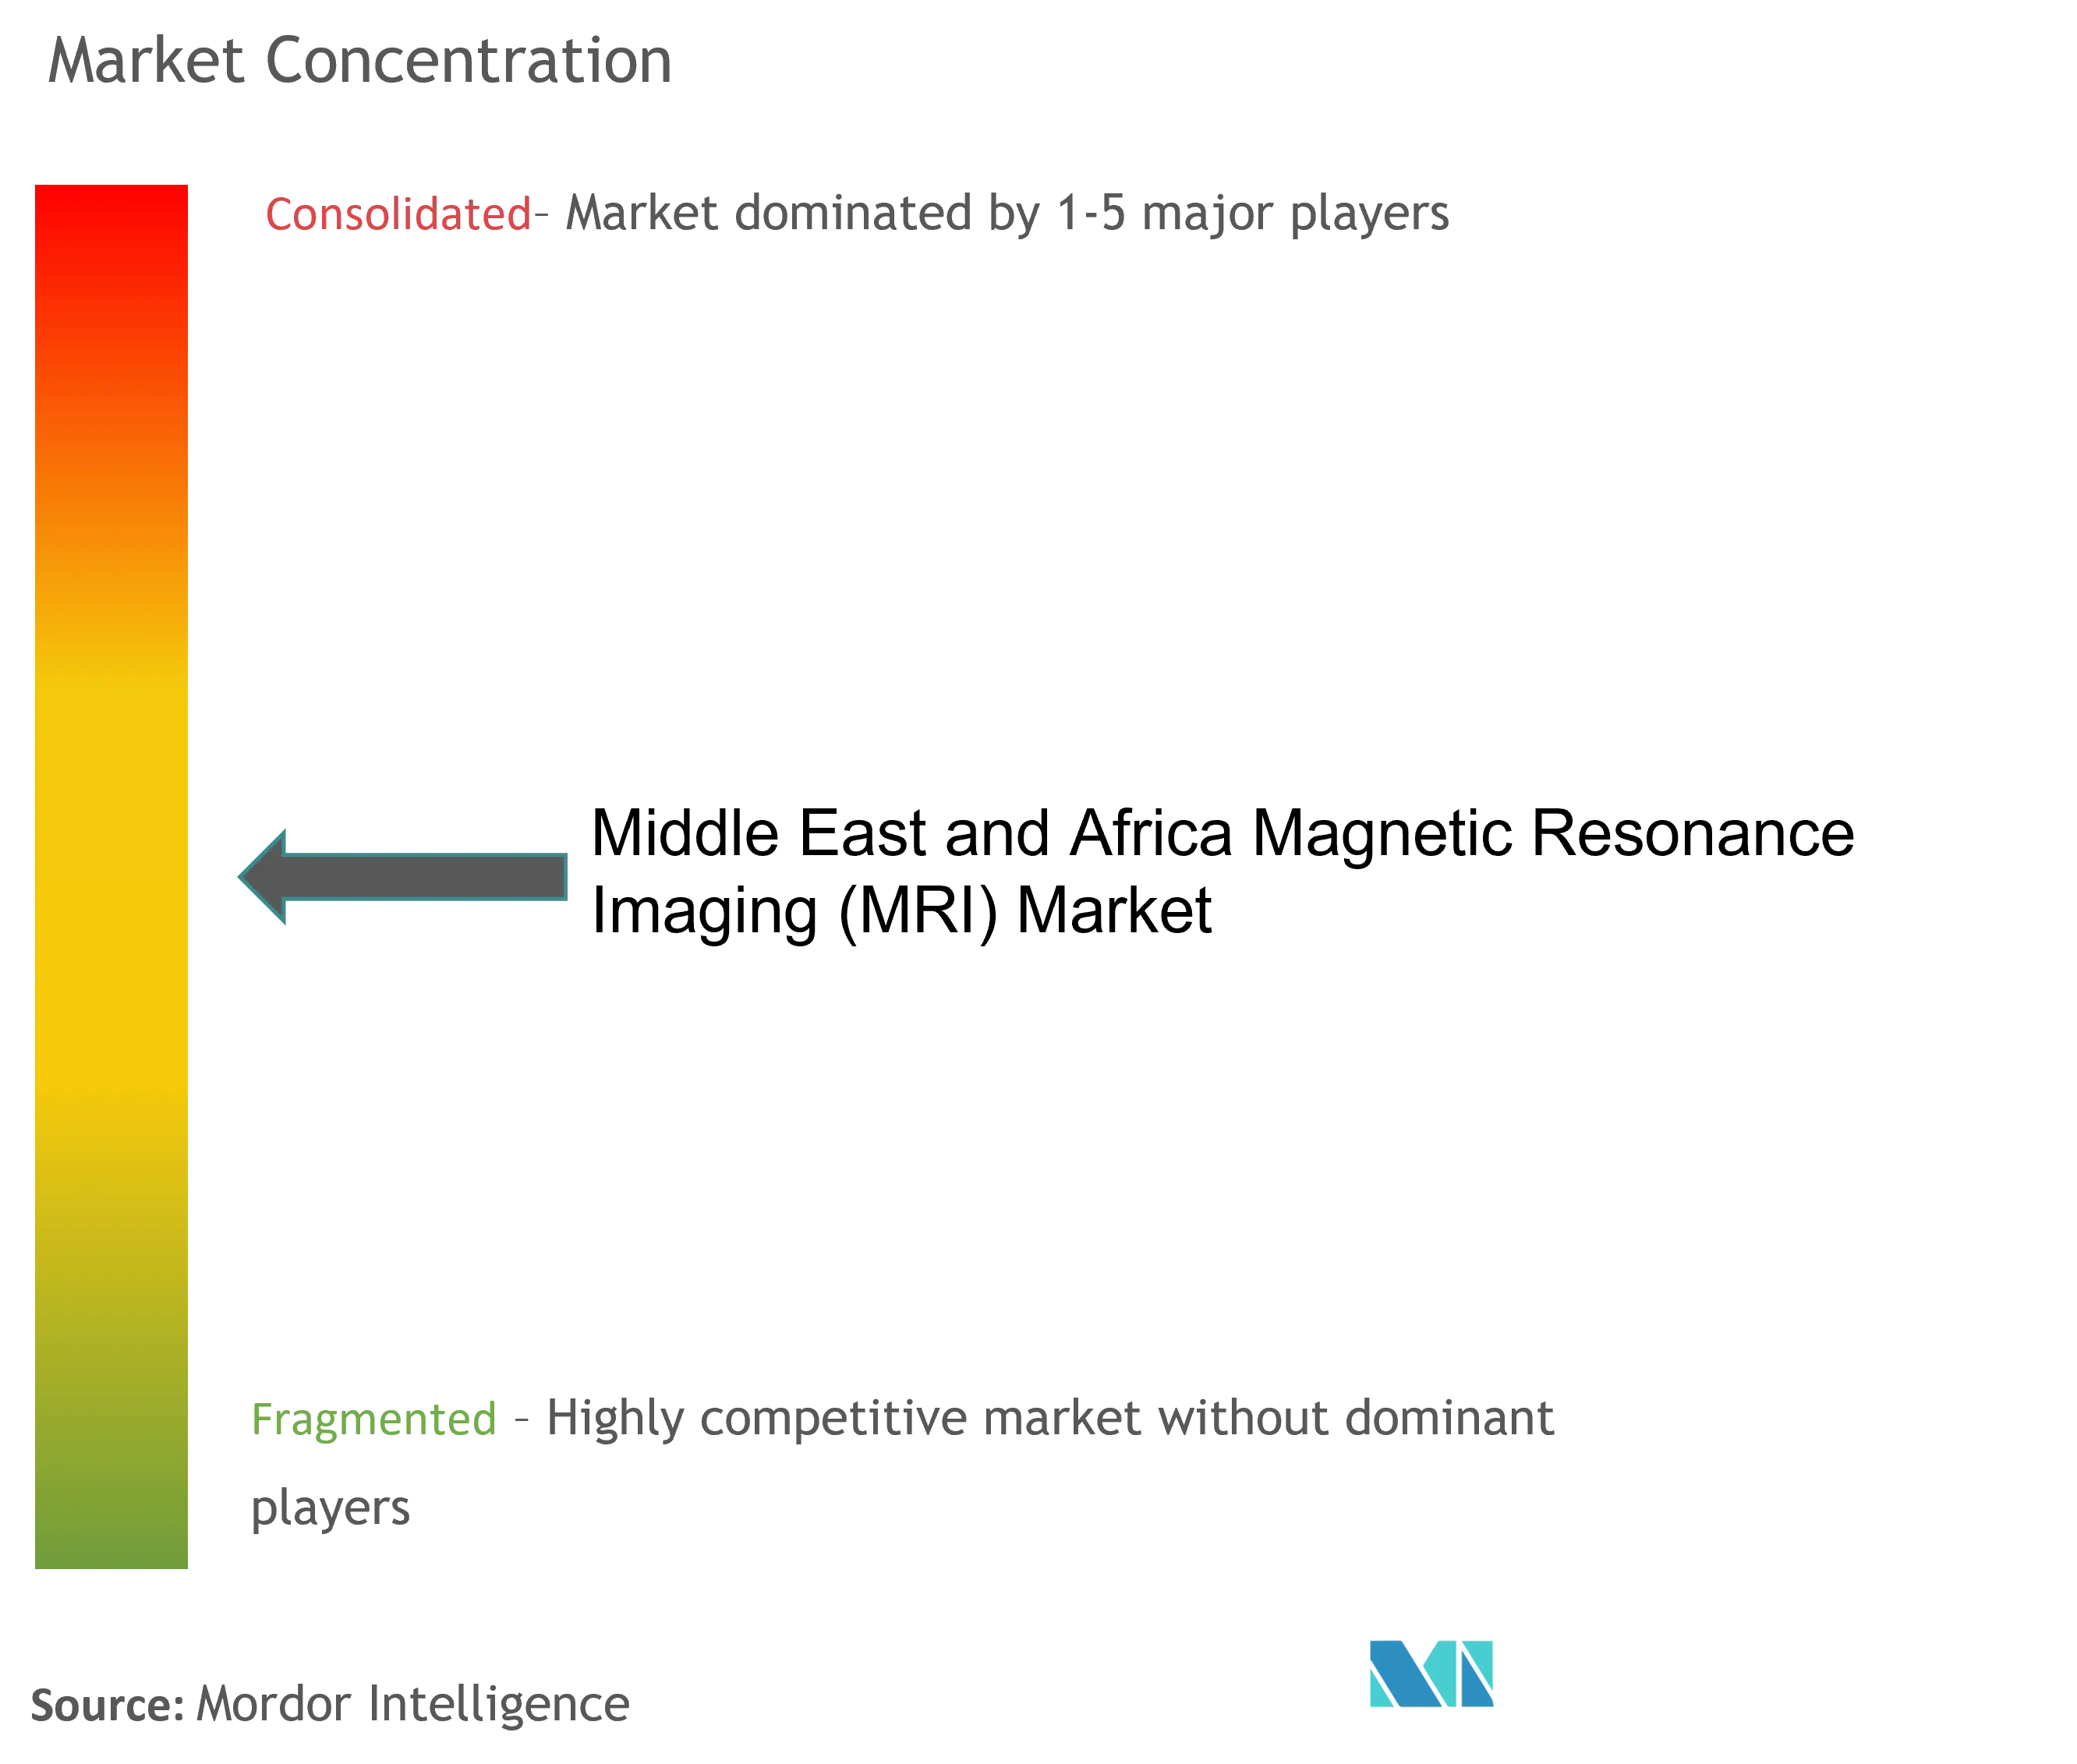
| Market Concentration | Medium |
Major Players
*Disclaimer: Major Players sorted in no particular order Image © Mordor Intelligence. Reuse requires attribution under CC BY 4.0. |
|
Middle East And Africa Magnetic Resonance Imaging (MRI) Market Analysis by Mordor Intelligence
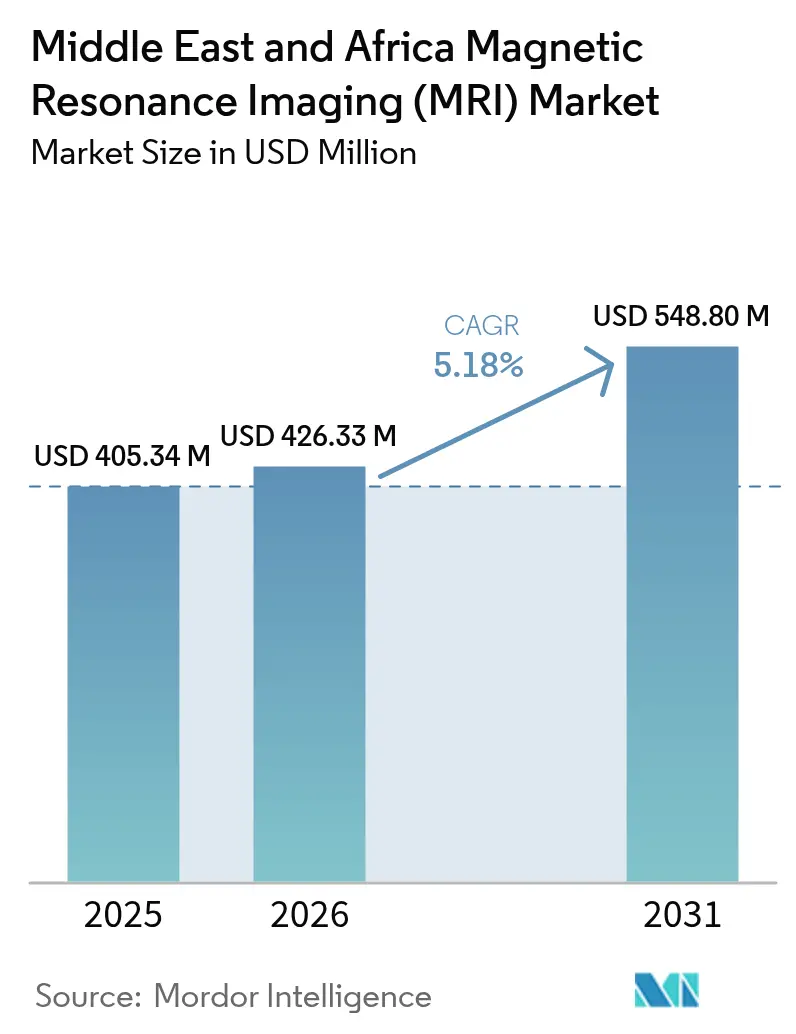
The Middle East and Africa MRI market size in 2026 is estimated at USD 426.33 million, growing from 2025 value of USD 405.34 million with 2031 projections showing USD 548.8 million, growing at 5.18% CAGR over 2026-2031. Rising chronic-disease incidence, government-funded screening mandates, and a pivot toward precision diagnostics anchor the growth trajectory. Large sovereign wealth funds in Saudi Arabia, the UAE, and Qatar are deploying multi-billion-dollar capital programs that bundle high-field scanners with AI-ready digital platforms, while portable low-field solutions widen access in resource-constrained settings. Vendor competition has shifted from raw magnet performance to workflow automation, helium-saving sustainability, and service contracting flexibility. Hospitals remain the primary buyers, yet independent imaging centers are expanding faster as systems decentralize care delivery and pursue higher scanner utilization efficiency.
Key Report Takeaways
- By architecture, closed systems led with 63.78% revenue share in 2025, while open units are forecast to advance at 5.69% CAGR through 2031.
- By field strength, high-field 1.5 T platforms captured 54.25% share of the Middle East and Africa MRI market size in 2025, whereas very-high 3 T and ultra-high ≥7 T installations are poised for 5.74% CAGR growth to 2031.
- By application, neurology retained 44.62% share in 2025; oncology is set to accelerate at 6.01% CAGR to 2031.
- By end user, hospitals accounted for 47.60% of 2025 revenue, yet diagnostic imaging centers are expanding at 6.08% CAGR through 2031.
- By geography, GCC economies commanded 47.85% of 2025 spending, while South Africa is projected to post a 6.16% CAGR through 2031.
Note: Market size and forecast figures in this report are generated using Mordor Intelligence’s proprietary estimation framework, updated with the latest available data and insights as of 2026.
Market Trends and Insights
Drivers Impact Analysis of Middle East And Africa Magnetic Resonance Imaging (MRI) Market*
| Driver | (~) % Impact on CAGR Forecast | Geographic Relevance | Impact Timeline |
|---|---|---|---|
| Growing Chronic-Disease & Ageing Burden | +1.2% | Global, with concentration in GCC and South Africa | Long term (≥ 4 years) |
| National Insurance Reforms And Cancer/Cardiac Screening Programmes In Saudi Arabia, UAE And South Africa | +0.9% | GCC core, South Africa | Medium term (2-4 years) |
| Expansion Of Public-Sector Healthcare Projects | +0.8% | GCC, Egypt, Nigeria | Medium term (2-4 years) |
| AI-Enhanced 3T Imaging & Workflow Automation | +0.7% | GCC, South Africa, urban centers across MEA | Short term (≤ 2 years) |
| Rise Of Portable Low-Field POC MRI Units | +0.6% | Sub-Saharan Africa, rural MEA regions | Medium term (2-4 years) |
| Gulf Sovereign-Fund PPP Diagnostic Clusters | + 0.5% | GCC countries | Long term (≥ 4 years) |
| Source: Mordor Intelligence | |||
Growing Chronic-Disease & Aging Burden
Chronic illnesses such as diabetes, cardiovascular disease, and prostate cancer continue to climb, driving demand for stroke, cardiac, and whole-body MRI protocols across the Middle East and Africa MRI market. GCC governments finance prevention campaigns that make advanced imaging a front-line tool for population health management. Egypt’s universal insurance expansion alone targets 12.8 million new beneficiaries by 2030, guaranteeing reimbursement for medically necessary scans. MRI vendors benefit from predictable throughput and the associated service revenue tied to long-term disease monitoring.
National Insurance Reforms and Screening Programs
Mandatory screening frameworks in Saudi Arabia, the UAE, and South Africa embed MRI volumes directly into reimbursement schedules, stabilizing cash flow for providers and creating scale economies for equipment suppliers. Cloud-based health-information exchanges unify scheduling, reporting, and archival, ensuring that scanners reach higher utilization thresholds. Volume-based reimbursement negotiations tighten per-scan margins yet reward manufacturers that market uptime-focused service contracts and AI engines that shorten acquisition times.
AI-Enhanced 3 T Imaging & Workflow Automation
AI reconstruction and triage engines reduce scan times by up to 80% and sharpen image quality by 80%, enabling 24/7 operations even where radiologist density is below one per million population [1]Philips, “Philips collaborates with NVIDIA to improve patient care in MR with latest AI advances,” PHILIPS.COM . Vendors emphasize subscription-style software licensing and cloud inference to bring premium performance to mid-tier hospitals without costly on-prem servers.
Rise of Portable Low-Field POC MRI Units
Point-of-care 0.05 T scanners eliminate the need for specialized shielding, plug into standard wall power, and travel to rural clinics. Clinical studies confirm their utility in emergent neuroimaging. Distribution agreements in Turkey, Israel, and Saudi Arabia accelerate reach, and humanitarian deployments in Malawi validate resilience in low-resource environments [2]AJNR, “Implementation of a Low-Field Portable MRI Scanner in a Resource-Constrained Environment,” AJNR.ORG .
Restraints Impact Analysis of Middle East And Africa Magnetic Resonance Imaging (MRI) Market*
| Restraint | (~) % Impact on CAGR Forecast | Geographic Relevance | Impact Timeline |
|---|---|---|---|
| High Acquisition & Lifecycle Cost | -1.1% | Global, particularly Sub-Saharan Africa | Long term (≥ 4 years) |
| Radiologist / Technologist Shortage | -0.8% | Sub-Saharan Africa, rural MEA regions | Medium term (2-4 years) |
| Power-Grid & Cooling-Water Instability | -0.6% | Sub-Saharan Africa, rural and semi-urban MEA | Medium term (2-4 years) |
| Limited Reimbursement For Advanced Sequences | -0.4% | Global MEA, with acute impact in low-income countries | Long term (≥ 4 years) |
| Source: Mordor Intelligence | |||
High Acquisition & Lifecycle Cost
Conventional 1.5 T installations range from USD 1-3 million plus 8-12% annual maintenance, stretching limited capital in low-income economies. Cooling, shielding, and helium demands add 30-50% to project budgets, forcing many hospitals to opt for refurbished systems or vendor-financed leasing that extends payback horizons. Helium-free magnet designs now reduce running expenses, but sticker prices remain a hurdle until bulk-purchase consortia mature.
Radiologist / Technologist Shortage
Radiologist density across several Sub-Saharan states is below 1 per million inhabitants, limiting MRI throughput despite rising scanner counts. AI-guided acquisition and teleradiology alleviate bottlenecks, but inconsistent broadband and regulatory silos delay full adoption. Workforce migration to higher-income nations sustains the deficit, underscoring the value of automation, remote supervision, and accelerated upskilling programs.
*Our forecasts treat driver/restraint impacts as directional, not additive. The impact forecasts reflect baseline growth, mix effects, and variable interactions.
Middle East And Africa Magnetic Resonance Imaging (MRI) Market Segment Analysis
By Architecture:
Closed Systems Dominate Yet Open Designs Gain MomentumClosed scanners generated 63.78% of 2025 revenue in the Middle East and Africa MRI market. High signal-to-noise ratio and compatibility with advanced neurological protocols sustain their primacy. Hospitals favor these systems for stroke and oncology pathways that require sub-millimeter resolution. Open designs, meanwhile, are advancing at 5.69% CAGR as claustrophobia-sensitive patient groups and interventional teams demand lateral access and comfort.
Fujifilm’s 0.4 T platform couples wide bores with motion-compensated RADAR sequences, narrowing the image-quality gap to closed units and satisfying ISO 13485 compliance. Independent imaging centers leverage lower purchase prices and faster room turnover to reach breakeven sooner, pushing additional closed-to-open mix shifts in outpatient settings.




By Field Strength:
High-Field Leadership Meets Ultra-High ExpansionHigh-field 1.5 T systems accounted for 54.25% of 2025 scanner installations because they balance diagnostic versatility with manageable siting requirements. The Middle East and Africa MRI market share for ultra-high 3 T and ≥7 T units is rising quickly as research hospitals and cancer centers seek superior tissue contrast. Virtually helium-free 1.5 T and 3 T magnets from Philips have already conserved 5 million L of helium worldwide.
Canon Medical’s 3 T Supreme Edition integrates deep-learning reconstruction to shorten protocols and minimize operator steps. Portable low-field models below 1.5 T cater to emergency neurology and neonatal wards that lack the infrastructure for superconducting magnets. Collectively, these tiers expand the accessible customer base without cannibalizing core high-field demand.
By Application:
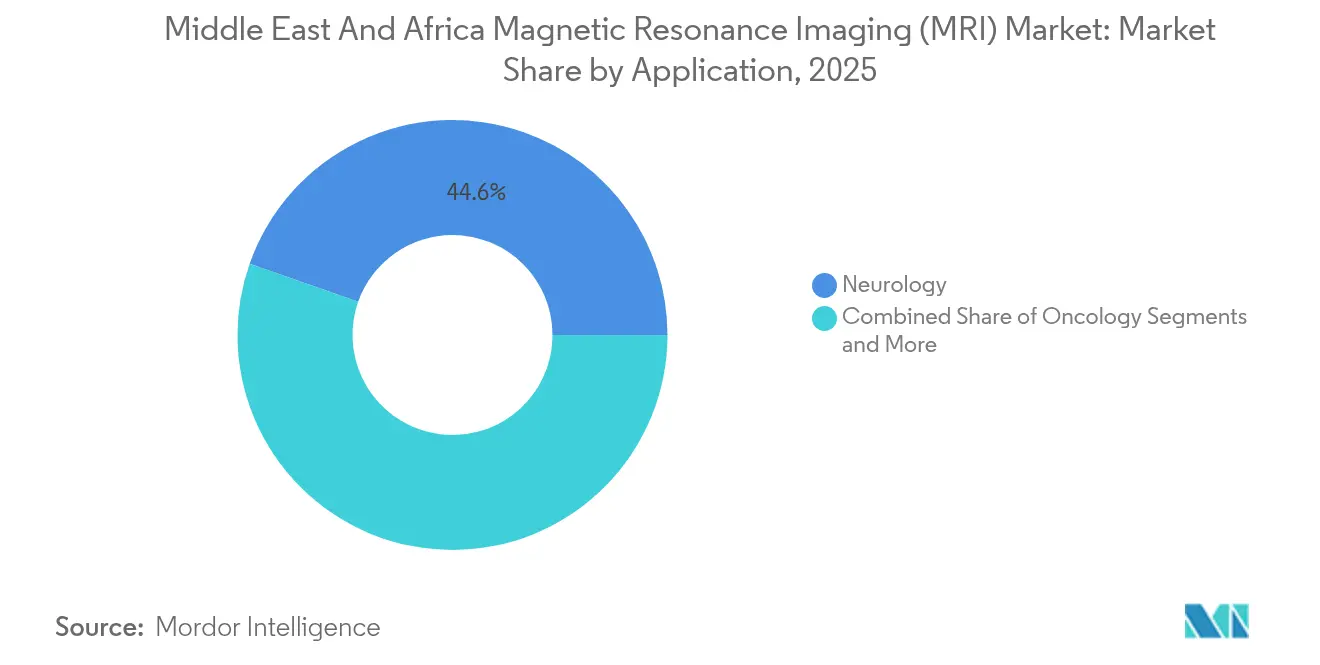
Neurology Remains Core as Oncology Overtakes GrowthNeurology delivered 44.62% of 2025 revenue, anchored in stroke detection protocols and diabetes-linked neuropathies prevalent across GCC states. Rapid-access brain MRI pathways reduce door-to-needle time for thrombolysis and drive scanner placement in emergency departments. Oncology scans, however, will post the fastest CAGR at 6.01% through 2031 as Saudi and Emirati screening programs extend coverage to breast, prostate, and colorectal cancers.
Cardiology uptake accelerates with 4D flow imaging that maps intracardiac hemodynamics. Musculoskeletal and gastroenterology sub-segments benefit from sports-medicine growth and fatty-liver monitoring, respectively. Across modalities, AI-enabled post-processing standardizes reporting and reduces turnaround, strengthening clinician confidence and payer reimbursement alignment.
By End User:
Hospital Anchors with Clinic-Driven OutperformanceHospitals contributed 47.60% of 2025 scanner revenue thanks to multi-disciplinary service lines and 24/7 emergency imaging. Their capital budgets absorb high-field purchases and advanced coils. Yet independent imaging centers and specialist clinics will expand fastest at 6.08% CAGR as health systems decentralize. Dedicated MRI sites achieve higher utilization and patient convenience, attracting private insurance referrals.
Burjeel Holdings illustrates the hybrid model: its 19 hospitals integrate acute care imaging, while 97 satellite clinics handle scheduled scans, boosting fleet productivity. Mobile services employing low-field units further broaden outreach to rural communities, aligning with national equity objectives.
Geography Analysis
GCC Magnetic Resonance Imaging (MRI) Market
GCC nations accounted for 47.85% of 2025 spending as sovereign wealth funds financed AI-ready diagnostic clusters linked to Vision 2030 roadmaps. Saudi Arabia’s plan to privatize 290 hospitals pushes private participation from 25% to 35%, yet universal coverage guarantees scan volumes and smooth cash flows. The UAE, investing more than USD 7.9 billion in digital platforms, deploys region-wide image-exchange networks that lift scanner utilization and inform risk-stratified screening. Qatar’s preparation for population expansion and medical-tourism inflows sustains high-field demand, while harmonized registration rules expedite foreign OEM launches.
South Africa Magnetic Resonance Imaging (MRI) Market
South Africa represents the fastest growing sub-market with a 6.16% CAGR projected through 2031. Universal Health Insurance shifts 15% of citizens from private to public cover, forecasting larger pooled procurements that favor vendors offering helium-free life-cycle savings. The new Artificial Intelligence Institute of South Africa accelerates research partnerships that rely on 3 T functional imaging. SAHPRA’s regulatory rigor obliges clinical-quality sourcing, benefiting premium manufacturers.
MEA Magnetic Resonance Imaging (MRI) Market
The rest of Middle East and Africa presents a heterogeneous outlook. Egypt’s medical-city projects and universal insurance rollout demand mid-range 1.5 T systems, yet currency swings and power-grid instability force flexible financing. Nigeria’s USD 5 billion initiative to unlock diagnostic value chains promises volume but contends with logistics complexity. Morocco, where 30% of hospitals use AI-assisted diagnosis, showcases the region’s innovation potential, driving interest in cloud-connected scanners that sidestep local compute shortages.
Regulatory Landscape
Regulation across the Middle East and Africa MRI market continues to be shaped by national medical device authorities that require establishment licensing, product registration, and evidence aligned to recognized international quality systems (for example, ISO 13485 and approvals or clearances from major reference regulators). In Saudi Arabia, the Saudi Food and Drug Authority (SFDA) oversees medical devices under the Law of Medical Devices and Supplies (issued in 2025), reinforcing technical and quality-assurance expectations for high-risk equipment such as MRI systems.
In North Africa and Sub-Saharan Africa, regulators are formalizing pathways that affect MRI import timelines and post-market obligations. Egypt’s Egyptian Drug Authority (EDA) maintains import-approval requirements for medical devices and, through its 2025 guidelines, streamlined registration procedures for imported and locally made devices that hold recognized international quality certificates. In South Africa, SAHPRA published the Medical Devices Reliance Guideline (SAHPGL-MD-22) in February 2026, introducing reliance pathways intended to accelerate premarket and post-market device activities by leveraging international regulatory decisions, a practical lever for multinational MRI OEMs and their local representatives.
Value Chain Analysis
The MRI value chain in the Middle East and Africa remains anchored in global manufacturing and regional distribution and integration. Core subsystems (superconducting magnets, gradient coils, and specialized materials such as niobium-titanium wire) are largely produced in established hubs outside the region, while local value addition centers on tendering, import compliance, site planning, RF shielding, installation, acceptance testing, and lifecycle service. Regional logistics and consolidation hubs, including Dubai, support cross-border delivery into African markets, where import documentation, sanitary certifications, and variable customs processes influence lead times and cost-to-serve.
Downstream execution is heavily influenced by facility readiness and service coverage. In the UAE, MRI room construction and operation requirements are governed through MOHAP diagnostic imaging regulation, including room sizing requirements that vary by magnet strength and vendor, linking equipment selection to civil works timelines and local contractors. Service delivery (preventive maintenance, uptime commitments, helium management for conventional systems, and software updates for AI reconstruction and workflow tools) remains a key differentiator, with OEMs using direct operations in select larger markets and distributor-led models in smaller markets. Large-scale public procurement and partnerships also shape the chain, as illustrated by Siemens Healthineers’ five-year agreement with the Government of Rwanda (January 2026) to modernize national diagnostics across 19 public hospitals with deployment of more than 230 medical systems, including MRI, reinforcing the role of vendor-led integration and long-term service structures.
Competitive Landscape
The Middle East and Africa MRI market favors global conglomerates that couple magnet engineering with AI ecosystems. Siemens Healthineers is investing USD 314 million in new manufacturing capacity while rolling out helium-light MAGNETOM Flow models, emphasizing lower operating costs. GE HealthCare reinforces platform stickiness via smart-technology collaborations with major imaging chains and the acquisition of advanced visualization firm MIM Software [3]GE HealthCare, “GE HealthCare announces agreement to acquire MIM Software,” INVESTOR.GEHEALTHCARE.COM . Philips differentiates through BlueSeal sealed magnets and cloud-hosted AI reconstruction, citing 40 MWh annual energy savings per 1.5 T unit.
Challenger brands such as Hyperfine and United Imaging target white-space opportunities. Hyperfine’s portable platform signed new distributors across Turkey, Israel, and Saudi Arabia to capture emergency-room and rural demand. United Imaging’s 5 T head-only scanner, cleared by the FDA, appeals to neuroscientific centers seeking ultra-high resolution without complete MRI suite renovation.
Sustainability and total cost of ownership trump raw Gauss races. Hospital groups now benchmark energy draw, helium consumption, uptime, and AI-workflow additions when scoring tenders. Vendors that bundle scanner, service, and software in outcome-linked contracts gain the inside track, especially where sovereign-fund buyers seek 10-year life-cycle guarantees that align with national health-care masterplans.
Middle East And Africa Magnetic Resonance Imaging (MRI) Industry Leaders
-
Canon Medical Systems Corporation
-
Koninklijke Philips N.V
-
General Electric Company (GE Healthcare)
-
Siemens Healthineers
-
FUJIFILM Corporation
- *Disclaimer: Major Players sorted in no particular order
Middle East And Africa Magnetic Resonance Imaging (MRI) Market Companies Covered in this Report
- Siemens Healthineers
- GE Healthcare
- Koninklijke Philips
- Canon
- FUJIFILM
- Esaote
- United Imaging Healthcare
- Hyperfine, Inc.
- Hitachi Ltd. (Medical)
- Fonar
- Shimadzu
- Neusoft Medical Systems
- Hologic Inc. (Breast MRI)
- Mediso
- Aurora Imaging Technology
- Time Medical Systems
- Wandong Medical
- Shenzhen Anke High-tech
- Imris Inc.
Read Analysis of Middle East And Africa Magnetic Resonance Imaging (MRI) Companies

Market Opportunities and Future Outlook
Opportunities are building around sustainability-driven system choices, private-sector diagnostic expansion, and national modernization programs that link equipment placement with long-term service and digital workflow. Helium-free MRI adoption offers a concrete pathway to reduce exposure to helium availability and running costs. In June 2026, HealthTech Ghana Limited opened Ghana’s first Philips BlueSeal 1.5T helium-free MRI system at the 37 Military Hospital in Accra under a public-private partnership, reflecting a procurement preference that ties operating resilience to access in public hospitals. A parallel premium tier is also visible in tertiary centers, with the American University of Beirut Medical Center deploying the Middle East’s first Philips BlueSeal XE MRI in July 2026, combining sealed magnet architecture with AI-enabled imaging (SmartSpeed Precise) and supporting demand for throughput-focused upgrades where workforce constraints are acute.
A second opportunity area is the build-out of independent imaging capacity and regional diagnostic networks that buy scanners as part of multi-site rollouts, which increases scope for bundled financing, standardized protocols, and managed services. In Egypt, Al Shroouk Scan and Lab launched a USD 20 million expansion in May 2026 that includes both closed and open MRI systems, reflecting a mixed-fleet strategy to balance advanced clinical capability with patient comfort and cost per scan. In the GCC, vendor-led AI differentiation is moving from feature-level offerings to site-level deployments, exemplified by Al Hilal Healthcare Group partnering with Fujifilm Middle East FZE in February 2026 to deploy the GCC’s first AI-powered MRI system (Echelon Synergy 1.5T) in Bahrain. This supports opportunities for OEMs that can localize training, application support, and service SLAs alongside the hardware sale.
Recent Industry Developments in Middle East And Africa Magnetic Resonance Imaging (MRI) Market
- July 2026: American University of Beirut Medical Center (AUBMC) deployed the Middle Easts first Philips BlueSeal XE MRI system featuring SmartSpeed Precise AI-powered imaging. The installation points to demand for sealed-magnet sustainability and workflow acceleration in tertiary centers, where throughput and consistency are procurement priorities.
- September 2025: Philips implemented the first mobile MRI truck in its Middle East, Turkey, and Africa region footprint, and reported serving more than 1,100 patients in Egypt within three months. Mobile deployment expands addressable scanning capacity without full suite construction, supporting outreach strategies for public providers and imaging networks.
- June 2025: Egypt advanced local capability with inspection of the first factory in Africa and the Middle East for ultrasound and MRI production in 6th of October City. The project signals policy support for domestic manufacturing and supply security, with potential to shorten lead times and broaden service and parts availability in North Africa.


Middle East And Africa Magnetic Resonance Imaging (MRI) Market Report Scope and Research Methodology
Market Definition and Coverage
For this study, the market covers revenues generated from MRI systems sold and installed across Middle East and Africa, including closed and open configurations, and demand linked to routine and advanced diagnostic imaging use.
Scope exclusions: We exclude CT, X-ray, ultrasound, nuclear imaging modalities, and non-MRI software-only offerings when they are not sold as part of an MRI system package.
Segments Covered in This Report
-
By Architecture
- Closed MRI Systems
- Open MRI Systems
-
By Field Strength
- Low-Field (< 1.5 T)
- High-Field (1.5 T)
- Very-High (3 T) & Ultra-High (≥ 7 T)
-
By Application
- Oncology
- Neurology
- Cardiology
- Gastroenterology
- Musculoskeletal
- Other Applications
-
By End User
- Hospitals
- Diagnostic Imaging Centers
- Others
-
By Geography
- GCC
- South Africa
- Rest of Middle East and Africa
Data Sources, Market Sizing, and Validation
Desk Research
Desk work started by mapping the installed base, replacement cycle, and healthcare capacity indicators that influence MRI purchases in the region. We referenced public and official sources such as the World Health Organization, World Bank health indicators, the International Atomic Energy Agency medical imaging resources, national health ministry publications, and customs and trade statistics portals for equipment import trends.
Alongside those, we used annual reports and investor presentations from relevant manufacturers and service providers, plus procurement notices and reputed press coverage to understand funding cycles and tender timing. A paid subscription for company financials and news was used to cross-check reported regional exposure, and a patent database helped track major MRI technology directions that can affect average selling prices. These examples are not exhaustive, and many other sources were also reviewed for data collection, validation, and research clarification.
Primary Interviews and Surveys
Primary work was used to pressure-test the desk assumptions on demand, pricing, and procurement behavior, particularly where public data does not separate MRI from broader imaging spends. We spoke with stakeholders such as hospital imaging heads, radiology managers, independent diagnostic center operators, distributors, and service engineers across key Middle East and Africa countries to validate volumes, the typical configuration mix, and replacement decisions.
Inputs from these discussions were used to confirm what gets counted as a market transaction, how ASPs move by field strength and configuration, and what timing lags exist between tender award and installation revenue recognition.
Distribution of primary research fieldwork respondents
| Company type | Respondent position |
|---|---|
| Top tier: 27% | CXOs: 14% |
| Mid tier: 59% | Functional/Unit leaders: 41% |
| Smaller Players: 14% | Managers: 45% |
Market-Sizing & Forecasting
Sizing was built using a top-down demand pool reconstruction where healthcare infrastructure build-outs, imaging capacity expansion, and equipment import signals are translated into annual MRI system purchases by country group. To keep the numbers realistic, selective bottom-up checks were then applied using sampled ASP-by-configuration ranges multiplied by expected unit volumes from channel checks, and the results are adjusted when the two views do not align.
Key inputs (illustrative) included installed base and replacement cycle by hospital type, public and private healthcare capex direction, tender pipeline timing, split of open versus closed MRI, field strength mix (low, 1.5T, 3T and above), and service coverage expectations that influence deal size. When bottom-up visibility was weak for smaller markets, gaps were handled by proxying from comparable countries using population, insured share, and hospital density, and then verifying reasonableness with interview feedback.
For forecasting, scenario analysis was used to reflect different funding and procurement conditions, and then a simple multivariate regression overlay was applied where consistent historical signals existed (such as equipment imports, hospital expansion, and diagnostic volumes). Assumptions were finalized only after they were accepted as plausible by regional experts, and a single set of currency and timing rules was applied across all countries to avoid mixing procurement year with installation year.
Data Validation & Update Cycle
Validation was done in steps so outliers were caught early, and not only at the end. Model outputs were compared against independent signals like import movements, public tender activity, and expected replacement needs from the installed base, and large variances were flagged for re-check.
Before sign-off, an analyst review pass was completed to confirm assumptions, math consistency, and whether the country totals roll up logically to the regional total. If a material shift was observed (for example, a major tender wave, currency movement affecting ASPs, or a sharp policy change), we re-contacted sources to confirm the direction and size of impact. Reports are refreshed annually, and an additional final update pass is done before delivery so clients receive the latest view.
Mordor Intelligence's Middle East Mri Market Market Size Versus Other Published Estimates
Published market sizes for MRI in the region can look far apart, even when they sound like they cover the same topic, because year timing, geographic boundaries, and what gets counted as a transaction are not always aligned. Differences also come from how average selling prices are set, whether service value is bundled into system pricing, and how quickly assumptions are refreshed when exchange rates and procurement schedules shift.
A refresh-led gap shows up most clearly when constant-currency assumptions are used across multiple years, or when pricing is carried forward without checking mix shifts between 1.5T and 3T systems, and the installation lag after tenders. In our work, quarterly currency timing checks and interview-validated ASP ranges by field strength are applied before totals are locked, and this is one reason Mordor Intelligence reports a different 2026 value than figures that use a single-year price point or narrower geography.
Benchmark comparison
| Source | Market Size | Gaps in Research Methodology |
|---|---|---|
| Mordor Intelligence | USD 426.33 M (2026) | |
| Global Consultancy A | USD 226.20 M (2024) | The scope is limited to the Middle East and focuses on MRI systems only, which compresses the total versus a Middle East and Africa roll-up. The base year is 2024, so the figure is also not directly comparable to a 2026 point without adjusting for procurement cycle timing and currency effects. |
| Industry Publisher B | USD 1.35 B (2024) | The estimate appears to use a broader value build that can inflate deal values if bundled service, accessories, or aggressive ASP escalation is applied across years. Using a high-growth assumption and a 2024 base without explicit install-versus-order timing can also widen the number versus a model tied to validated field strength mix and tender-to-install lags. |
The comparison mainly points to three practical drivers, geography coverage, what is included in the transaction value, and how price and currency are refreshed over time. By keeping scope boundaries clear and re-checking ASP and timing assumptions through primary validation, the resulting estimate stays traceable to repeatable steps and observable demand signals.


Key Questions Answered in the Report
How big is the Middle East And Africa Magnetic Resonance Imaging Market?
The Middle East And Africa Magnetic Resonance Imaging Market size is expected to reach USD 426.33 million in 2026 and grow at a CAGR of 5.18% to reach USD 548.8 million by 2031.
Which MRI architecture currently leads revenues?
Closed systems hold 63.78% of 2025 revenue, reflecting their superior image quality for complex diagnostics.
Who are the key players in Middle East And Africa Magnetic Resonance Imaging Market?
Canon Medical Systems Corporation, Koninklijke Philips N.V, General Electric Company (GE Healthcare), Siemens Healthineers and FUJIFILM Corporation are the major companies operating in the Middle East And Africa Magnetic Resonance Imaging Market.
How are AI advances influencing MRI purchasing decisions?
Providers prioritize scanners with AI reconstruction because they cut scan times by up to 80% and mitigate radiologist shortages.
Page last updated on:





