Market Overview
| Study Period | 2021 - 2031 |
|---|---|
| Forecast Data Period | 2026 - 2031 |
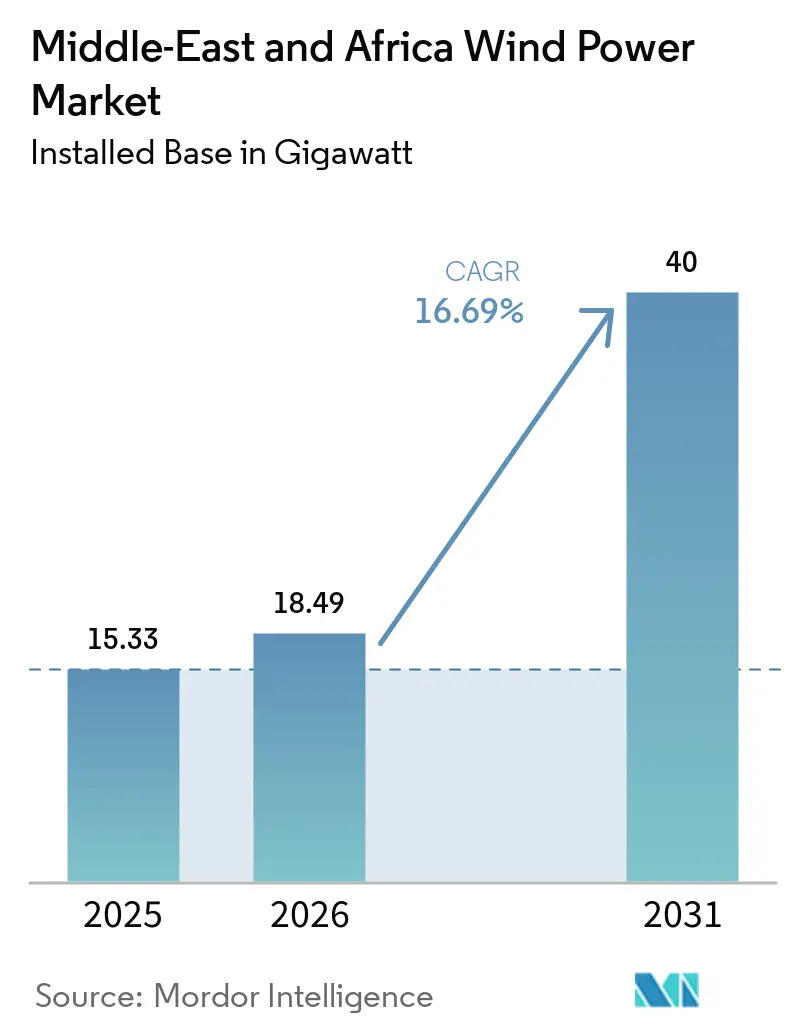
| Base Year Market Size (2025) | 15.33 gigawatt |
| Market Volume (2026) | 18.49 gigawatt |
| Market Volume (2031) | 40 gigawatt |
| Growth Rate (2026 - 2031) | 16.69% CAGR |
| Market Concentration | Medium |
Major Players *Disclaimer: Major Players sorted in no particular order Image © Mordor Intelligence. Reuse requires attribution under CC BY 4.0. | |
Middle-East And Africa Wind Power Market Analysis by Mordor Intelligence
The Middle-East And Africa Wind Power Market size in terms of installed base is projected to be 15.33 gigawatt in 2025, 18.49 gigawatt in 2026, and reach 40 gigawatt by 2031, growing at a CAGR of 16.69% from 2026 to 2031.
Record-low auction tariffs, large sovereign pipelines, and accelerating grid-expansion programs are propelling utility-scale build-outs, while corporate power-purchase agreements (PPAs) are emerging as a parallel growth engine that diversifies offtake risk and attracts commercial banks.[1]Gulf Cooperation Council Interconnection Authority, “Annual Report 2025,” gccia.com.sa Robust sovereign wealth-fund investments, especially the Saudi Public Investment Fund’s USD 50 billion renewable allocation, anchor this momentum. International turbine makers strengthen local footprints while Chinese entrants win cost-sensitive bids. Competitive dynamics are shifting as Chinese original-equipment manufacturers undercut Western incumbents by 10-12% on price and accept local-currency revenue exposure, intensifying pressure on established vendors to localize manufacturing in Saudi Arabia and Egypt.[2]Goldwind, “Global Operations,” goldwindglobal.com
Key Report Takeaways
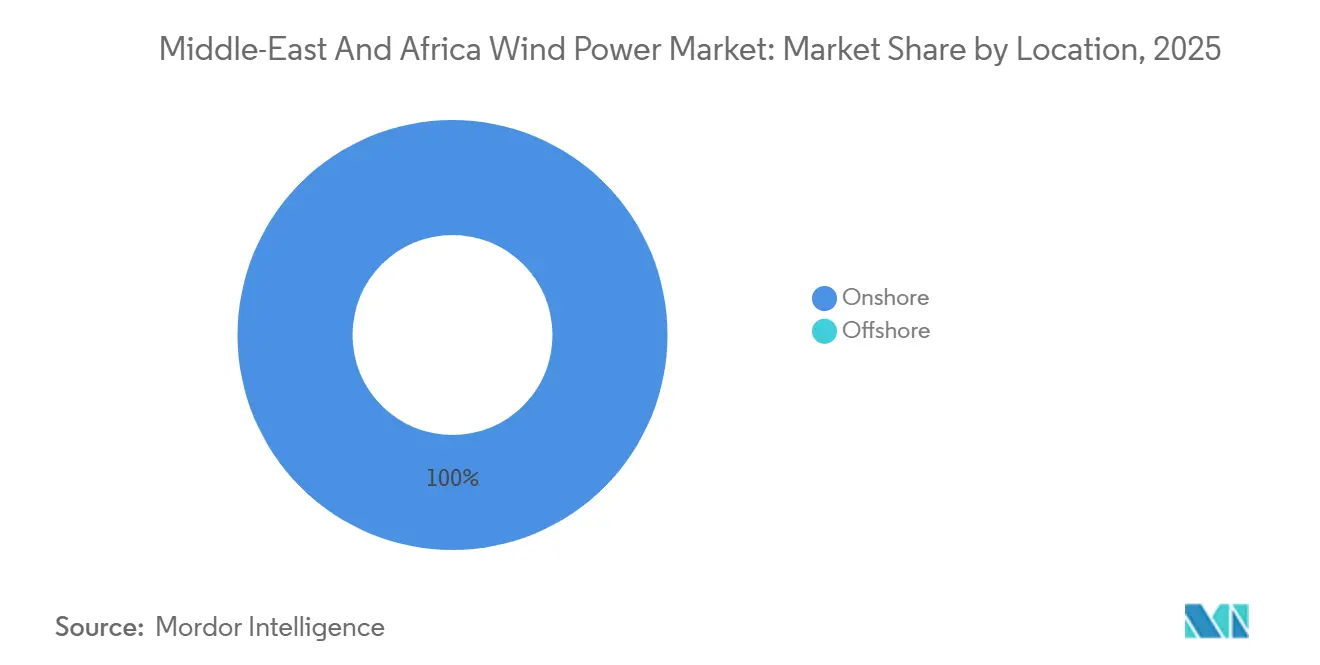
- By location, onshore projects commanded 100% of 2025 installations and are expected to grow at a 16.7% CAGR through 2031, reflecting streamlined permitting and the absence of offshore frameworks.
- By turbine capacity, the 3-6 MW segment captured 74.4% of the Middle East and Africa wind power market share in 2025, while the above-6 MW class is projected to expand at a 19.5% CAGR to 2031.
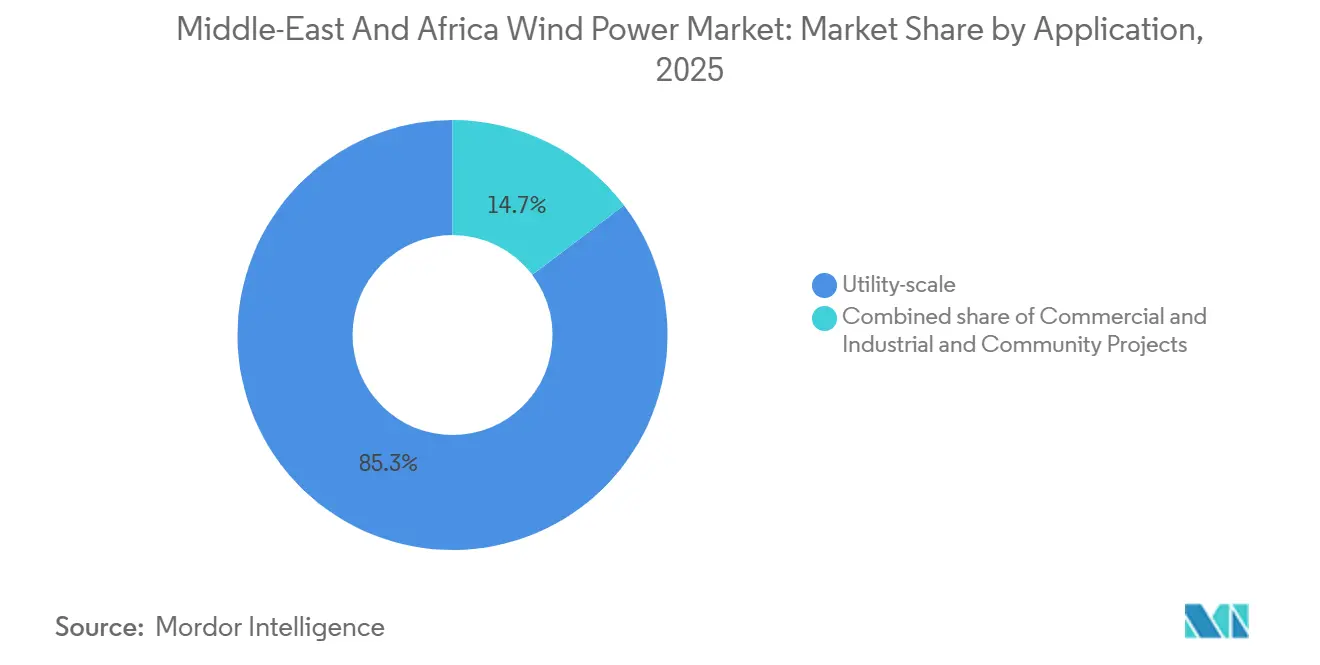
- By application, utility-scale plants accounted for 85.3% of the Middle East and Africa wind power market size in 2025, yet commercial and industrial projects are expected to grow at a 21.0% CAGR to 2031.
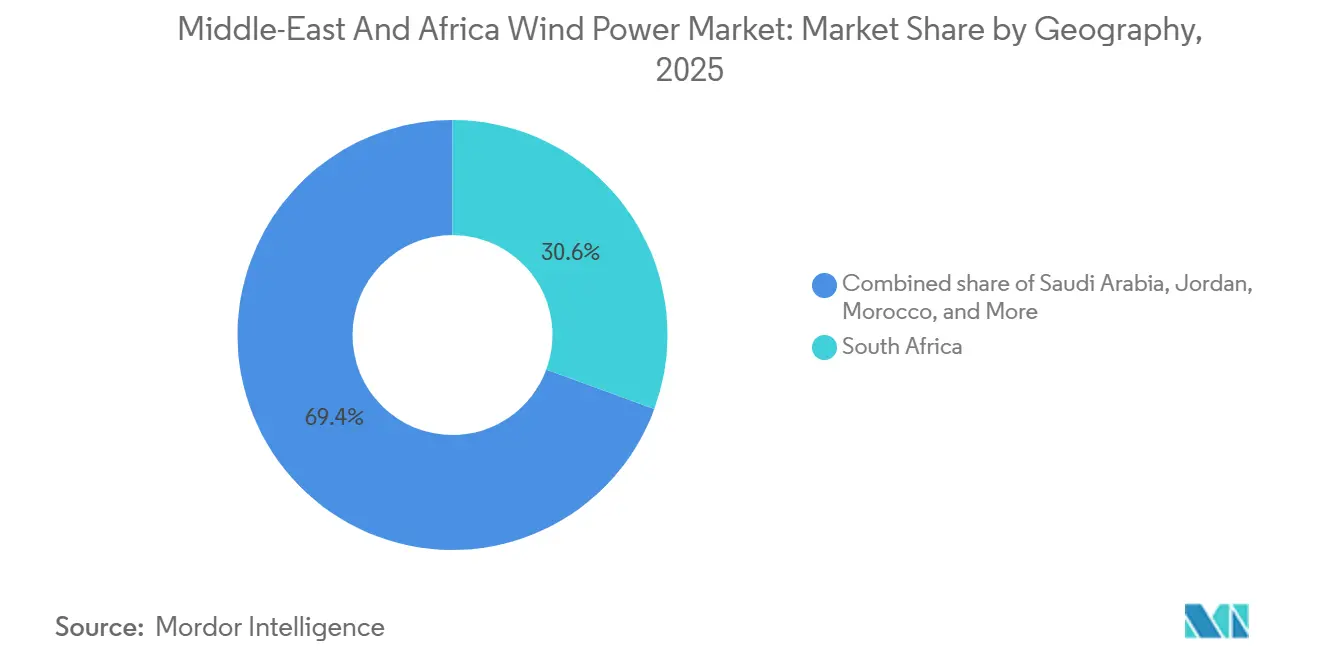
- By geography, South Africa led with 30.6% of 2025 capacity; Saudi Arabia is the fastest-growing market and is expected to grow at a 25.7% CAGR through 2031.
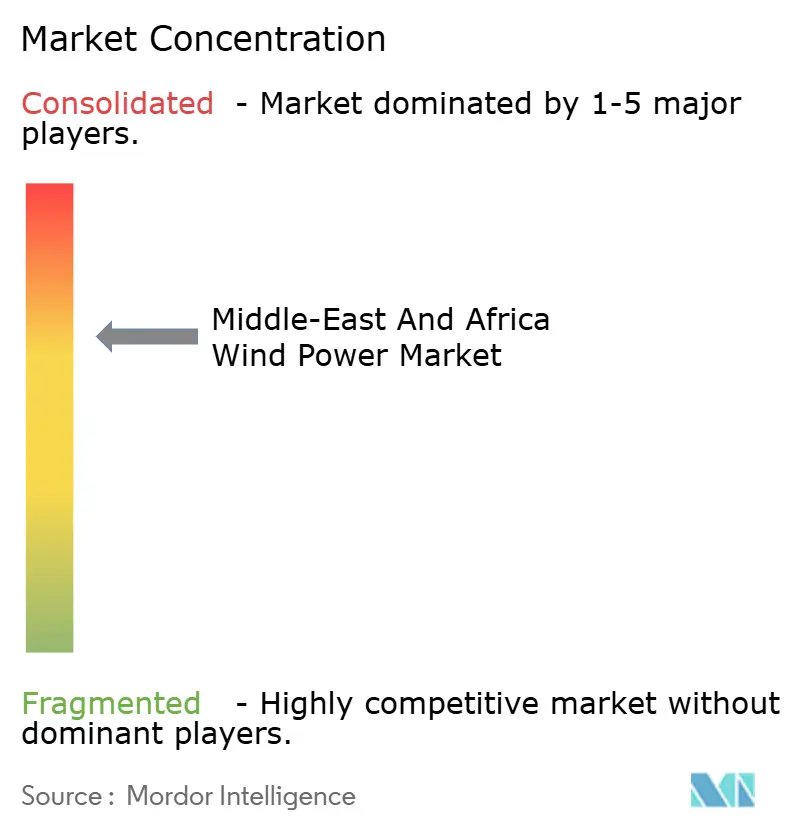
- The top five developers controlled 55% of commissioned and near-term pipeline capacity in 2025, indicating a moderately concentrated competitive field.
Note: Market size and forecast figures in this report are generated using Mordor Intelligence’s proprietary estimation framework, updated with the latest available data and insights as of 2026.
Middle-East And Africa Wind Power Market Trends and Insights
Drivers Impact Analysis*
| Driver | (~) % Impact on CAGR Forecast | Geographic Relevance | Impact Timeline |
|---|---|---|---|
| Government renewable-energy targets & auctions | 4.2% | Saudi Arabia, Egypt, Morocco, Tunisia, South Africa | Medium term (2-4 years) |
| Falling onshore LCOE below regional fossil benchmarks | 3.8% | Saudi Arabia, UAE, Jordan, Egypt, Morocco | Short term (≤ 2 years) |
| Expansion of corporate PPAs from data-center & mining sectors | 2.1% | South Africa, Egypt, Saudi Arabia, UAE | Medium term (2-4 years) |
| Grid-expansion investments across GCC & East Africa | 2.9% | GCC states, Kenya, Tanzania, Uganda, Zambia | Long term (≥ 4 years) |
| Offshore wind-to-hydrogen pilots along the Red Sea | 1.6% | Saudi Arabia (NEOM), Egypt, Oman | Long term (≥ 4 years) |
| Saudi localization incentives for turbine manufacturing | 1.8% | Saudi Arabia, with spillover to GCC | Medium term (2-4 years) |
| Source: Mordor Intelligence | |||
Government Renewable-Energy Targets & Auctions
Sovereign auction programs are anchoring the Middle East and Africa wind power market by offering hard-currency PPAs, sovereign guarantees, and rapid bid-award cycles that shorten financial-close timelines by up to nine months.[3]Egyptian Electricity Transmission Company, “Annual Grid Curtailment Report 2024,” eetc.gov.eg Saudi Arabia’s Round 6 awarded 1.5 GW of wind at USD 0.0133 per kWh, 40% below prevailing gas generation costs, and Round 7 has pre-qualified 5.3 GW of bids slated for award in 2026. Egypt issued land allocations exceeding 10 GW in 2024, front-loading its 2030 renewables target and catalyzing USD 3.5 billion of incoming foreign direct investment. Morocco and Tunisia scheduled 1.7 GW and 2 GW auctions beginning in 2026, both featuring indexed tariffs to hedge currency risk. The cumulative effect is a predictable demand pipeline that underwrites localization investments in towers, nacelles, and blades.
Falling Onshore LCOE Below Fossil Benchmarks
Levelized cost of energy for prime onshore projects in the GCC and North Africa has dropped to USD 0.030-0.035 per kWh, materially undercutting combined-cycle gas even before carbon-pricing assumptions.[4]International Renewable Energy Agency, “Renewable Cost Database 2024,” irena.org Bulk procurement of nacelles, dedicated port berths at Jeddah and Sokhna, and declining financing spreads shaved capital expenditure by 13% during 2024. Capacity factors now average 38-42% against a global mean of 35%, aided by taller towers and high-energy blades. As a result, grid operators are forecasting merit-order displacement of mid-merit gas plants by 2028, accelerating planned retirements of 15-20 GW of thermal capacity. Cheaper wind also enhances fiscal positions by freeing subsidy budgets previously earmarked for imported liquefied natural gas.
Expansion of Corporate PPAs
Mining conglomerates, cement producers, and hyperscale data-center operators are locking in 10- to 20-year wind PPAs to hedge tariff escalation and address Scope 2 emissions. South African miners wheel Northern Cape wind through Eskom’s network, bypassing municipal surcharges that have risen 12% annually since 2020. In Morocco, ACWA Power’s 500 MW wind-plus-2,000 MWh battery system supplies Gotion’s EV-battery gigafactory under a fixed tariff that qualifies the factory for EU Carbon Border Adjustment Mechanism exemptions. Corporate offtakers value predictable monthly output, which varies less than 8% from long-run averages in Class 5 sites, simplifying treasury hedging. This emerging C&I segment is attracting commercial-bank club loans priced 150-200 basis points above export-credit agency debt but remains accretive given rising grid tariffs.
Grid-Expansion Investments Across GCC & East Africa
Transmission build-outs are converting stranded wind resources into bankable assets. The 530 km GCC-Oman interconnector will carry 1,600 MW when commissioned in 2027, enabling Saudi wind surpluses to meet Omani evening peaks. Extension plans toward Iraq and Jordan create a 180 GW synchronized market that can absorb 25 GW of variable renewables without curtailment. In East Africa, the Kenya-Tanzania 400 kV line energized in 2024, and the pending Tanzania-Zambia corridor will unlock eight GW of high-wind zones, lifting capacity factors to 38-42% and boosting project internal rates of return by up to four percentage points. Improved grid access reduces reliance on diesel backup, enhancing bankability and drawing pension-fund capital previously deterred by infrastructure risk.
Restraints Impact Analysis*
| Restraint | (~) % Impact on CAGR Forecast | Geographic Relevance | Impact Timeline |
|---|---|---|---|
| Policy uncertainty in Sub-Saharan markets | -2.3% | Nigeria, Ghana, Ethiopia, Kenya | Medium term (2-4 years) |
| Grid stability and curtailment risk | -1.9% | South Africa, Kenya, Tanzania | Short term (≤ 2 years) |
| High upfront CAPEX for offshore projects | -1.2% | Morocco, Egypt, South Africa | Long term (≥ 4 years) |
| Supply-chain congestion at key regional ports | -1.1% | Djibouti, Mombasa, Port Sudan, Dar es Salaam | Short term (≤ 2 years) |
| Source: Mordor Intelligence | |||
Policy Uncertainty in Several Sub-Saharan Markets
Nigeria, Kenya, and Ethiopia illustrate how absent or shifting policy frameworks deter capital despite solid wind resources. Nigeria’s lack of sovereign guarantees leaves a 2 GW theoretical pipeline stalled at feasibility. Kenya imposed a 12-month licensing moratorium in 2024 pending grid-stability studies, freezing 800 MW of shovel-ready projects. Ethiopia’s civil conflict delayed the 300 MW Aysha plant by two years, activating force-majeure claims that spooked lenders. These markets now demand internal rates of return of 14-16%, versus 8-10% in North Africa and the GCC, to offset perceived political and currency risk. Until multilateral partial-risk guarantees scale, capital will continue flowing toward auction-driven markets with hard-currency revenue streams.
Grid Stability & Curtailment Risk
Legacy networks designed for centralized coal or gas dispatch struggle with low-inertia wind penetration. South Africa curtailed 1.2 GW of renewable output during 180 days of Stage 6 load shedding in 2024 to maintain 49.8-50.2 Hz frequency. Kenya’s 310 MW Lake Turkana project lost 22% of potential generation due to a single-circuit evacuation line, while Tanzania’s grid code requires a 10% spinning reserve that forces developers to co-locate costly battery storage. Solving these issues demands USD 8 billion for synchronous condensers, grid-forming inverters, and 4-hour batteries, investments that utilities hesitate to pass through to end-users. Curtailment, therefore, acts as an implicit 15-25% tax on wind revenues in weak-grid jurisdictions.
*Our forecasts treat driver/restraint impacts as directional, not additive. The impact forecasts reflect baseline growth, mix effects, and variable interactions.
Segment Analysis
By Location: Onshore Dominance Reflects Regulatory Gaps
Onshore projects represented the entire 18.49 GW installed base in 2025, and that figure is forecast to climb at a 16.7% CAGR to 2031, keeping onshore above 90% of the Middle East and Africa wind power market size for the rest of the decade. Developers gravitate to Saudi interior deserts, Egypt’s Gulf of Suez corridor, and South Africa’s Northern Cape because Class 4-6 resources intersect with paved roads and 132 kV interties, reducing soft-cost contingencies. Liberalized auction regimes allow rapid capital recycling, so financial close is often reached within two years of site award, versus the four-plus years typical for offshore zones.
The absence of firm seabed-leasing rules outside Morocco and Egypt leaves offshore risk matrices unresolved, so lenders demand higher equity cushions that dilute sponsor returns. While Morocco completed feasibility work for 10 GW of Atlantic capacity, and Egypt for Red Sea export hubs, neither government has issued a contract for difference templates. As a result, offshore will account for less than 5% of incremental capacity through 2031, limiting its influence on the overall Middle East and Africa wind power market share. Near term, hybrid onshore-plus-battery designs, such as the 500 MW Kenitra project, are out-competing offshore by firming output to baseload profiles without incurring marine costs.


By Turbine Capacity: Scaling Up for LCOE Compression
Turbines rated 3-6 MW held 74.4% of 2025 deployments, anchoring the cost curve and defining transport-route requirements across the Middle East and Africa wind power market. Above-6 MW machines are now the fastest expanding class at a 19.5% CAGR, aided by local tower fabrication in Saudi Arabia that cuts logistics by up to 15%.
A 7 MW turbine on a 140 m tower can lift site capacity factor by nearly 18% versus legacy 5 MW models, which slices levelized cost by 9-11 cents over a 20-year term. OEMs respond by shipping segmented blades and partnering with Gulf steel firms to sidestep over-height bridge restrictions. The result is a steady climb in average rating, with 6 MW-plus orders projected to approach 50% of annual additions in 2028, pushing the weighted average toward 5.8 MW. That technology pivot underpins future declines in the Middle East and Africa wind power market size per-megawatt capital requirement, a metric closely watched by Gulf sovereign-wealth funds.
By Application: Utility-Scale Anchors, C&I Accelerates
Utility plants supplied 85.3% of installed capacity in 2025, reflecting the dominance of 20-25-year sovereign-backed PPAs that attract export-credit agency debt at sub-200 basis points. These multigigawatt pipelines stabilize order books for Western and Chinese OEMs alike, anchoring the revenue base of the Middle East and Africa wind power market.
Commercial and industrial demand is rising at a 21.0% CAGR as miners, cement makers, and hyperscale data-center operators hedge grid-tariff inflation and Scope 2 exposure. Fixed 10-15-year contracts, such as the Kenitra wind-plus-storage deal, now account for about 12% of annual offtake. Although the segment remains smaller in absolute megawatts, shorter development cycles enable quicker compound growth, which broadens the customer base and diversifies cash-flow risk for independent power producers. Community schemes stay marginal because net-metering laws are either absent or capped at low quotas in most markets, so they contribute less than 2% to the Middle East and Africa wind power market share.
Geography Analysis
South Africa retained 30.6% of installed capacity in 2025, benefiting from six bid windows under its Independent Power Producer Procurement Program that locked in 3.8 GW of wind. Bid Window 7 added another 1.4 GW scheduled for grid connection between 2027 and 2029, yet Eskom’s Stage 6 load shedding curtailed 1.2 GW of renewable output during 2024, underscoring an urgent need for grid-forming inverters and synchronous condensers. The state utility prioritizes coal retirement in its Just Energy Transition Plan, so transmission upgrades lag generation additions, placing a soft cap on future wind awards until wheeling charges and grid bottlenecks ease.
Saudi Arabia stands out as the fastest-growing contributor to the Middle East and Africa wind power market, projected to expand at 25.7% CAGR through 2031 on the back of Vision 2030’s 50% renewable target. Round 6 and Round 7 auctions together exceed 6.8 GW of wind, while localization policies funnel USD 27.69 billion into tower, nacelle, and generator plants that will cover 60% of domestic needs by 2028. NEOM’s integrated 1,670 MW wind-to-hydrogen complex advances the export narrative and diversifies offtake beyond the Saudi grid.
Egypt, Morocco, and the wider North Africa corridor represent the third growth pole, with Egypt alone hosting a pipeline above 10 GW. Egypt’s pound depreciation of 38% versus the US dollar during 2024-2025 pushes developers to insist on hard-currency tariffs indexed to inflation. Morocco’s 1.7 GW auction program plus feasibility studies for 10 GW offshore align with a 52% renewable electricity goal, while cross-Strait proximity to Europe attracts hydrogen-linked offtake. East-African opportunities remain contingent on transmission corridors such as the Kenya-Tanzania 400 kV line, energized in late 2024, which trimmed Lake Turkana curtailment by eight percentage points.
Competitive Landscape
The Middle East and Africa wind power market features a moderately concentrated developer tier, with ACWA Power, Masdar, Lekela/Infinity Power, Mainstream, and Scatec together holding close to 55% of operational and committed capacity. ACWA Power benefits from Saudi Public Investment Fund backing, enabling sub-USD 0.015 per kWh bids that few rivals can match. Masdar’s 2023 acquisition of Lekela created a 1.3 GW operational platform plus a 13.8 GW development pipeline, instantly vaulting it to Africa’s largest pure-play renewables company.
OEM rivalry is intensifying. Goldwind and Envision undercut Western vendors by 10-12% on equipment price and accept limited local-currency exposure, capturing Egyptian and Moroccan orders where currency hedges prove costly. Western leaders Vestas and Siemens Gamesa defend their share by offering extended availability guarantees and by partnering with Al Yamamah Steel to localize tower fabrication, shaving four to six weeks off Saudi project timelines.
Value-chain integration blurs the lines between developer and manufacturer. Several Gulf independent power producers now negotiate turbine supply, 20-year service, and energy-as-a-service packages in single procurement rounds, compressing OEM gross margins but elevating overall project bankability. Chinese component makers that lack IEC 61400-22 certificates face exclusion from Saudi and Egyptian auctions, which keeps the quality bar high and protects early movers that invested in accredited test facilities.
Middle-East And Africa Wind Power Industry Leaders
Siemens Gamesa Renewable Energy
Vestas Wind Systems A/S
GE Renewable Energy
Goldwind
Envision Energy
- *Disclaimer: Major Players sorted in no particular order

Recent Industry Developments
- December 2025: TPG and MAVCO rebranded Siemens Gamesa’s India–Sri Lanka wind business as Vayona Energy, a 12-GW OEM. While focused on South Asia, its strengthened supply chain, technology base, and investor confidence could indirectly support MEA wind markets through increased competition and OEM diversification.
- December 2025: ABB acquired Gamesa Electric’s power-electronics division, including wind converters and grid-scale renewable systems. This strengthens ABB’s global wind-technology footprint, benefiting MEA wind growth through improved converter availability, enhanced grid-integration technology, and expanded service networks relevant to developing wind markets in the region.
- November 2025: Natco Pharma completed a 35.75% acquisition of South Africa’s Adcock Ingram. While not wind-sector specific, the deal signals growing foreign investment confidence in African markets, supporting broader economic conditions that could indirectly help MEA renewable sectors attract capital and expand industrial capacity.
- August 2025: HitecVision and Reinova launched Lirion Power by acquiring a 166-MW Irish wind portfolio. Although Europe-focused, the JV’s financing strength, operational expertise, and repowering strategy demonstrate models applicable to MEA markets seeking mature-asset upgrades and expanded renewable investment structures.


Middle-East And Africa Wind Power Market Report Scope
The Wind Power Market encompasses the global industry focused on the development, manufacturing, installation, operation, and maintenance of technologies that transform wind energy into electricity. This market includes both onshore and offshore wind power projects, covering the entire value chain, such as turbine components, power infrastructure, software and control systems, grid integration solutions, and associated services.
The Middle East and Africa wind power market is segmented into location, turbine capacity, application, and geography. By location, the market is segmented into onshore and offshore. By turbine capacity, the market is segmented into Up to 3 MW, 3 to 6 MW, and Above 6 MW. By application, the market is segmented into utility-scale, commercial and industrial, and community projects. By component, which is given in qualitative analysis only, is segmented into nacelle/turbine, blade, tower, generator, gearbox, and balance-of-system. By geography, the market is divided into Saudi Arabia, the United Arab Emirates, Jordan, Iran, South Africa, Egypt, Morocco, and the rest of the Middle East and Africa. For each segment, market sizing and forecasts have been done based on volume (GW).
By Location
| Onshore |
| Offshore |
By Turbine Capacity
| Up to 3 MW |
| 3 to 6 MW |
| Above 6 MW |
By Application
| Utility-scale |
| Commercial and Industrial |
| Community Projects |
By Component (Qualitative Analysis)
| Nacelle/Turbine |
| Blade |
| Tower |
| Generator and Gearbox |
| Balance-of-System |
By Geography
| Saudi Arabia |
| United Arab Emirates |
| Jordan |
| Iran |
| South Africa |
| Egypt |
| Morocco |
| Rest of Middle East & Africa |
| By Location | Onshore |
| Offshore | |
| By Turbine Capacity | Up to 3 MW |
| 3 to 6 MW | |
| Above 6 MW | |
| By Application | Utility-scale |
| Commercial and Industrial | |
| Community Projects | |
| By Component (Qualitative Analysis) | Nacelle/Turbine |
| Blade | |
| Tower | |
| Generator and Gearbox | |
| Balance-of-System | |
| By Geography | Saudi Arabia |
| United Arab Emirates | |
| Jordan | |
| Iran | |
| South Africa | |
| Egypt | |
| Morocco | |
| Rest of Middle East & Africa |


Key Questions Answered in the Report
How fast is wind capacity expanding across the region?
Installed wind power capacity in the Middle East and Africa is projected to jump from 18.49 GW in 2026 to 40 GW by 2031, at a 16.69% CAGR.
Which country will add turbines the quickest?
Saudi Arabia is forecast to post a 25.7% CAGR through 2031 on the back of Vision 2030 auctions and localization incentives.
What turbine rating now dominates new orders?
Models in the 3-6 MW class still lead with a 74.4% share, but 6 MW-plus machines are expanding at nearly 20% annually.
Why are corporate PPAs gaining traction?
Mining and data-center operators sign 10-20-year PPAs to hedge tariff inflation and meet Scope 2 targets, accelerating C&I demand at a 21% CAGR.
What share of forthcoming projects is offshore?
Offshore remains below 5% of the Middle East and Africa wind power market through 2031 because seabed-leasing terms are still in draft form.
How concentrated is the competitive landscape?
The five largest developers hold roughly 55% of current and near-term capacity, giving the market a moderate concentration.
Page last updated on:


