Market Overview
| Study Period | 2021 - 2031 |
|---|---|
| Forecast Data Period | 2026 - 2031 |
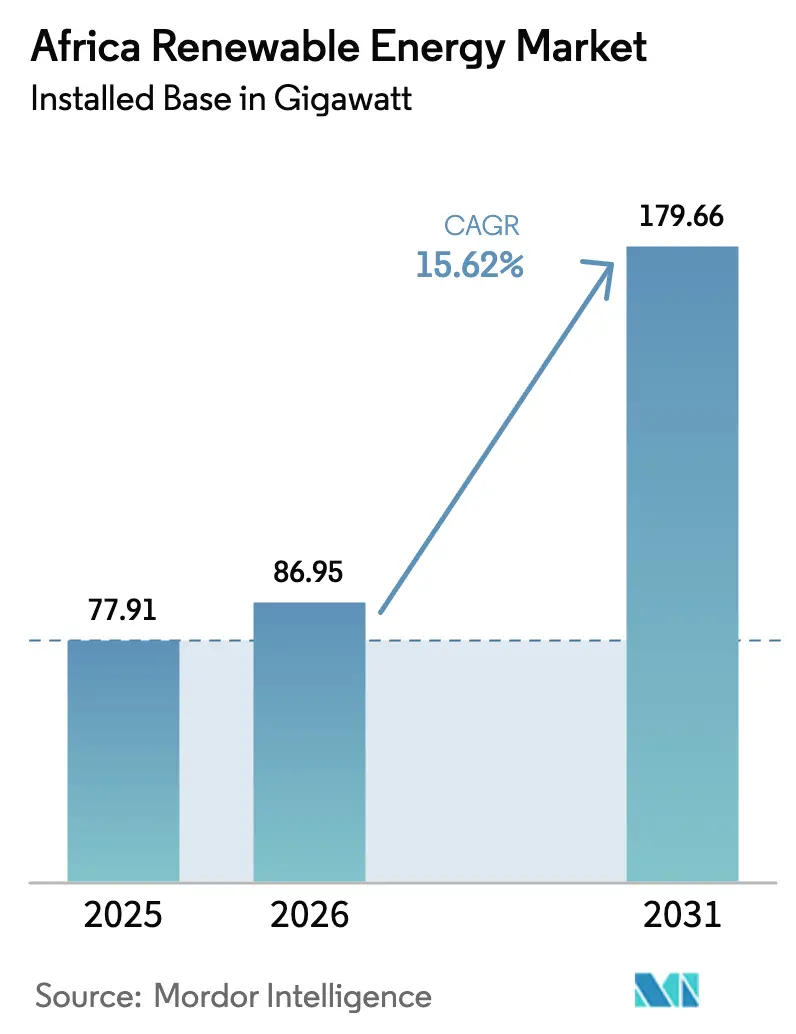
| Base Year Market Size (2025) | 77.91 gigawatt |
| Market Volume (2026) | 86.95 gigawatt |
| Market Volume (2031) | 179.66 gigawatt |
| Growth Rate (2026 - 2031) | 15.62% CAGR |
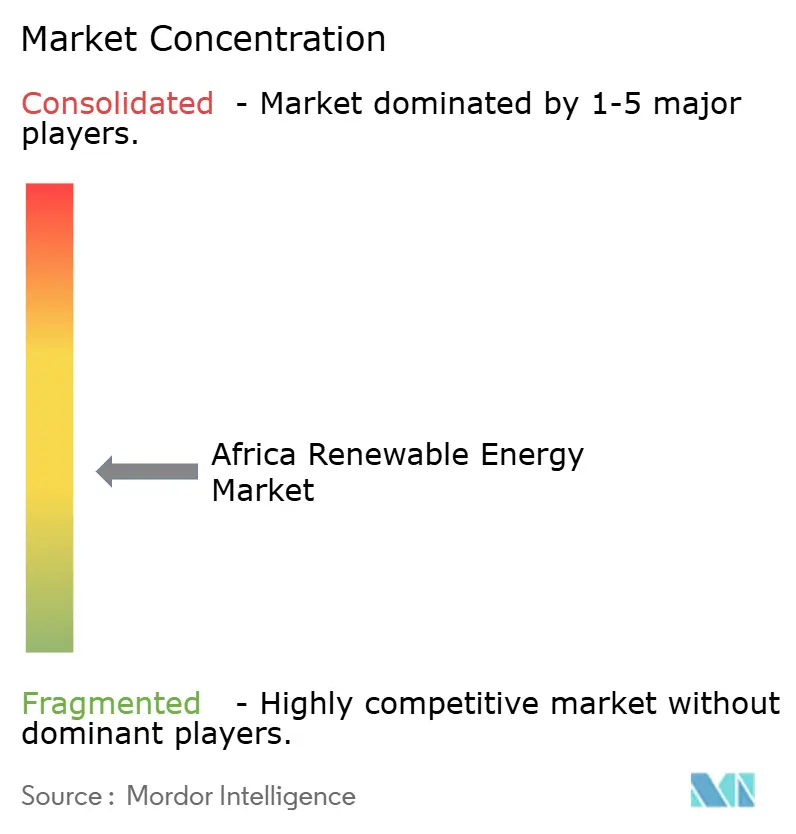
| Market Concentration | Medium |
Major Players *Disclaimer: Major Players sorted in no particular order Image © Mordor Intelligence. Reuse requires attribution under CC BY 4.0. | |
Africa Renewable Energy Market Analysis by Mordor Intelligence
The Africa Renewable Energy Market size in terms of installed base is projected to expand from 77.91 gigawatt in 2025 and 86.95 gigawatt in 2026 to 179.66 gigawatt by 2031, registering a CAGR of 15.62% between 2026 to 2031.
Solar photovoltaic costs keep falling, development-finance institutions (DFIs) funnel concessional capital into mini-grids, and half a dozen North African states are racing to build green-hydrogen corridors that will supply European offtakers. These factors accelerate project pipelines, diversify revenue models, and lessen Africa’s dependence on thermal generation. Hydropower still dominated in 2025, yet solar capacity will expand at 27.84% each year, a pivot driven by shorter build times and lower upfront capital spend. Algeria illustrates the geographic shift: it is scaling from an almost standing start to a 42.51% growth through 2031 on the back of a 1 GW solar tender and proximity to the Mediterranean export market. South Africa retains the largest installed base, but legacy grid bottlenecks and coal-fleet inflexibility have already forced 4,363 GWh of renewable curtailment, underscoring the need for storage co-location.
Key Report Takeaways
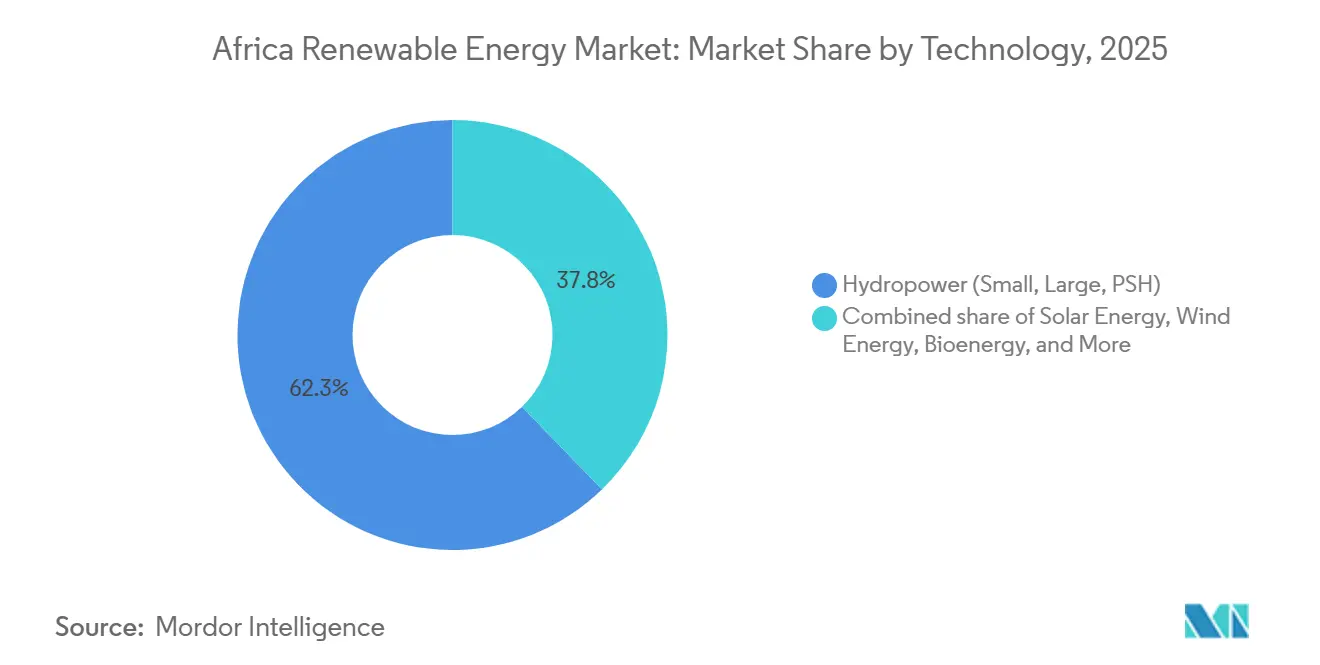
- By technology, hydropower accounted for 62.25% Africa's renewable energy market share in 2025, while solar is projected to expand at a 27.84% CAGR through 2031.
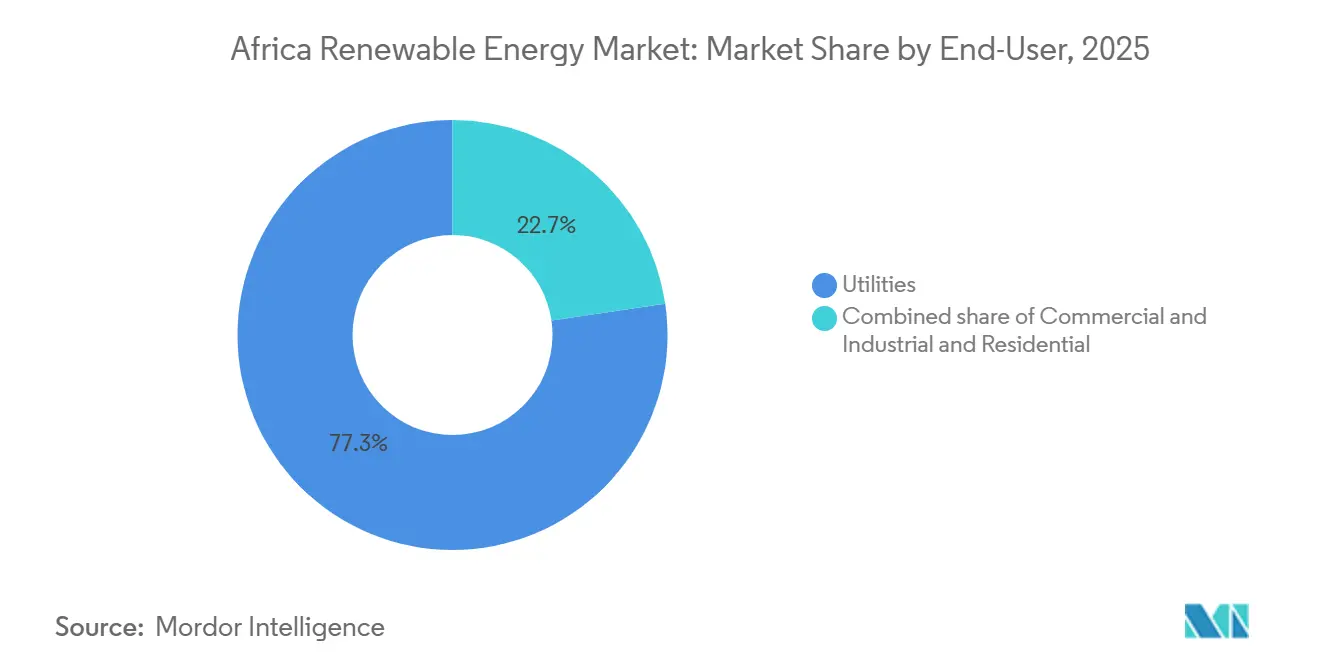
- By end-user, utilities held 77.33% of installed capacity in 2025; commercial and industrial installations are set to grow at an 18.36% CAGR to 2031.
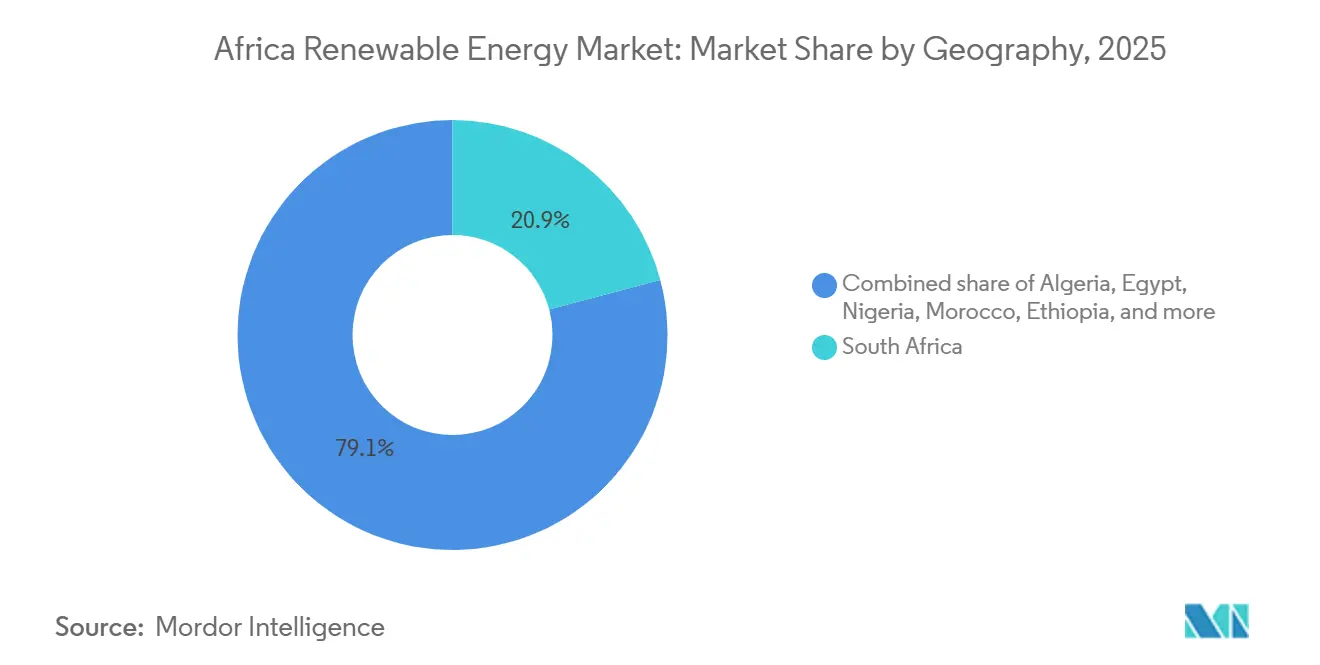
- By geography, South Africa led with a 20.89% revenue share in 2025, whereas Algeria is forecast to post the fastest 42.51% CAGR between 2026 and 2031.
Note: Market size and forecast figures in this report are generated using Mordor Intelligence’s proprietary estimation framework, updated with the latest available data and insights as of January 2026.
Africa Renewable Energy Market Trends and Insights
Drivers Impact Analysis
| Driver | (~) % Impact on CAGR Forecast | Geographic Relevance | Impact Timeline |
|---|---|---|---|
| Rapid decline in solar PV CAPEX | 3.9% | Global, with strongest uptake in Egypt, South Africa, Morocco, Algeria | Short term (≤ 2 years) |
| Utility-scale wind project pipeline acceleration in South Africa | 1.9% | South Africa, with spillover to Kenya, Egypt | Medium term (2-4 years) |
| Mini-grid programs backed by DFI concessional funding | 2.3% | Nigeria, Kenya, Ghana, Ethiopia, Rest of Sub-Saharan Africa | Medium term (2-4 years) |
| Emerging green-hydrogen export hubs | 2.8% | Morocco, Egypt, Namibia, Mauritania, South Africa | Long term (≥ 4 years) |
| Growing corporate PPAs from mining companies | 1.6% | South Africa, Ghana, Zambia, DRC | Medium term (2-4 years) |
| Expansion of climate-aligned blended-finance platforms | 1.2% | Pan-African, concentrated in frontier markets | Long term (≥ 4 years) |
| Source: Mordor Intelligence | |||
Rapid Decline in Solar PV CAPEX
Auction tariffs for utility-scale solar dropped below USD 0.03 per kWh in Egypt and Morocco during 2025, undercutting new coal and gas by more than 40%.[1]International Renewable Energy Agency, “Solar PV Cost Trends 2026,” irena.org Module prices fell to USD 0.12 per watt in early 2026 as global polysilicon oversupply met tepid demand. Bid Window 7 in South Africa cleared 2.6 GW at an average USD 0.025 per kWh, a 60% reduction from the inaugural round ten years earlier. Algeria’s 1 GW solar tender set a ceiling price of USD 0.028 per kWh, confirming photovoltaics as the least-cost baseload option when paired with four-hour lithium-ion storage. These economics allow 20-year fixed-price PPAs, locking in debt tenors from multilateral lenders and helping the Africa renewable energy market overcome currency-risk hurdles.
Utility-Scale Wind Project Pipeline Acceleration in South Africa
South Africa’s wind queue reached 48 GW in 2024, clustered in the Northern and Eastern Capes, where capacity factors top 40%. Bid Windows 5-7 collectively awarded 5.3 GW with commercial operation dates sequenced to 2029 to ease grid integration. Eskom can only absorb 2 GW of variable renewables each year without voltage events, forcing co-located batteries or managed curtailment. Vestas captured 1.2 GW of turbine orders by assembling nacelles locally, satisfying domestic-content rules and trimming logistics costs. Kenya’s 310 MW Lake Turkana wind farm, meanwhile, proved remote projects can maintain debt-service coverage above 1.4x even when wheeling power 400 km.
Mini-Grid Programs Backed by DFI Concessional Funding
The World Bank’s Mission 300 pledges USD 35 billion to electrify 300 million Africans via solar mini-grids and home systems by 2030.[2]World Bank, “Mission 300 Program Document,” worldbank.org Nigeria’s 2025 DARES rollout financed 90,000 systems and nine mini-grids, cutting rural electricity costs from USD 0.80 to USD 0.35 per kWh. Concessional first-loss guarantees shrink blended capital costs, while inflation-indexed tariffs safeguard investor returns in Kenya’s 1,200 commissioned mini-grids. Ghana’s Renewable Energy Master Plan adds a USD 200 million AfDB facility that underwrites payment risk for rural distribution entities. Such structures expand the Africa renewable energy market beyond legacy grid footprints and anchor a robust pipeline of bankable off-grid assets.
Emerging Green-Hydrogen Export Hubs
Morocco is steering USD 32.5 billion into the 10 GW Noor Midelt and Atlantic wind complexes to export 3 million t of hydrogen annually through repurposed gas lines to Europe.[3]Financial Times, Heba Saleh, “North Africa Eyes Hydrogen Exports,” ft.com Namibia’s USD 10 billion Hyphen project will deploy 7 GW of renewables in Tsau Khaeb National Park to make 300,000 t per year for maritime fuel and ammonia. Egypt’s Ain Sokhna zone signed MoUs covering 2.5 GW of electrolyzers for green-hydrogen linked to Gulf of Suez wind farms. Mauritania joined the Africa Green Hydrogen Alliance and targets 10 GW by 2030 to serve European steelmakers under the EU carbon border scheme. These ventures allow the Africa renewable energy market to monetize renewable electrons offshore, sidestepping local grid constraints.
Restraints Impact Analysis
| Restraint | (~) % Impact on CAGR Forecast | Geographic Relevance | Impact Timeline |
|---|---|---|---|
| Weak grid stability & curtailment risk | -1.2% | South Africa, Kenya, Egypt, Nigeria | Short term (≤ 2 years) |
| Currency-convertibility limitations for IPPs | -0.9% | Nigeria, Zambia, Ethiopia, Ghana | Medium term (2-4 years) |
| Delays in sovereign guarantees for power-purchase agreements | -0.8% | Nigeria, Ghana, Zambia, Kenya, Ethiopia | Medium term (2-4 years) |
| Rising opposition to large hydro projects on social-environment grounds | -0.6% | Democratic Republic of Congo, Ethiopia, Tanzania, Uganda | Long term (≥ 4 years) |
| Source: Mordor Intelligence | |||
Weak Grid Stability & Curtailment Risk
Eskom curtailed 4,363 GWh of renewables in 2024, 12% of total output, due to inflexible coal plants that cannot track solar peaks and evening wind ramps. Kenya’s grid operator restricted Lake Turkana’s output during 18% of hours in 2025 after voltage excursions on the Loiyangalani–Suswa line. Egypt disconnected sections of the Benban park for 200 hours in 2024 as frequency strayed outside the 49.8-50.2 Hz band. Such events depress project capacity factors below bank-case assumptions, triggering loan renegotiations. South Africa’s 2025 Grid Code Amendment now mandates two-hour storage on new projects, adding USD 300 per kW but reducing curtailment exposure and strengthening the Africa renewable energy market’s risk profile.
Currency-Convertibility Limitations for IPPs
Nigeria ran up a USD 2.5 billion backlog of trapped dividends in 2024 as the central bank rationed hard currency for fuel imports. Zambia's kwacha slid 40% in 2024-25, eroding tariff revenues for Scaling Solar projects and prompting change-in-law claims. Ethiopia capped foreign-currency transfers at 50% of quarterly earnings in 2025, compelling sponsors to reinvest domestically or accept discounted exchange rates. Elevated political-risk insurance premiums widen the spread between local-currency tariffs and dollar debt, slowing the pace at which Africa's renewable energy market capacity can scale.
Segment Analysis
By Technology: Solar Ascendance Reshapes Capacity Mix
Solar installations stand out as the fastest-growing technology, with a 27.84% CAGR projected from 2026 to 2031, while hydropower accounted for a dominant 62.25% of the Africa renewable energy market share in 2025.[4]IRENA, “Africa Technology Split 2026,” irena.org Egypt’s 1.8 GW Benban cluster and 500 MW Kom Ombo additions showcase how desert irradiance above 2,500 kWh/m² enables 28% capacity factors without trackers. Morocco’s Noor complex integrates 580 MW of concentrated solar power with molten-salt storage, achieving seven-hour dispatchability that commands a premium over pure PV. Wind benefits from South Africa’s 48 GW pipeline and Kenya’s proven high-factor sites, yet offshore activity remains limited to pre-feasibility studies. The Africa renewable energy market size for wind and solar combined is forecast to eclipse hydropower by 2029 as procurement windows accelerate, module prices retreat, and battery costs drop.
Hydropower’s share will erode gradually as social opposition curtails mega-dam ambitions, exemplified by the stalled USD 80 billion Grand Inga project. Run-of-river and pumped-storage schemes gain favor for their lighter resettlement footprint. Kenya leads geothermal with 985 MW at Olkaria and an 83 MW unit commissioned in 2024, leveraging Rift Valley geology for baseload supply. Bioenergy and ocean-energy pilots remain small, but municipal waste-to-power in South Africa signals a gradual broadening of the Africa renewable energy market technology mix.


By End-User: Mining Sector Fuels C&I Surge
Utilities controlled 77.33% of installed capacity in 2025, yet payment delays and grid instability have tarnished their credit standing in several economies. The commercial and industrial segment is expected to grow at an 18.36% CAGR, fuelled by miners, data centers, and manufacturers securing clean, firm power at predictable prices. Anglo American alone is tendering 3-5 GW of supply across its African footprint, anchoring developer pipelines previously aimed only at utility offtake. Sibanye-Stillwater’s 175 MW solar plant cuts diesel exposure and meets emissions targets, mirroring a broader pivot toward behind-the-meter arrangements.
State utilities in Egypt, Morocco, and South Africa continue to procure at scale through auctions and feed-in tariffs, but developers increasingly hedge single-buyer risk by blending corporate PPAs into their revenue stack. The Africa renewable energy market size for residential remains small but is accelerating through pay-as-you-go solar home systems financed via mobile money in East and West Africa. DFIs that underwrite payment risk enable tariff structures affordable to low-income households while maintaining bankability for investors, reinforcing balanced growth across customer classes.
Geography Analysis
South Africa delivered 7.8 GW of accumulated capacity through seven auction rounds and held a 20.89% share in 2025; yet curtailment and coal-fleet rigidity weigh on future additions. Algeria is on course for a 42.51% CAGR after launching a 1 GW tender and aligning green-hydrogen plans with Sonatrach’s export network. Egypt installed 1.8 GW at Benban, targets 10 GW by 2028, and is positioning Ain Sokhna as a hydrogen hub that draws Gulf financiers.
Morocco operates 580 MW of CSP and advances the Noor Midelt hybrids, supporting a 52% renewable-electricity goal for 2030 and aiming to export 3 million t of hydrogen each year. Nigeria financed 90,000 solar home systems and nine mini-grids in 2025, a necessary step toward a 30% renewable-generation goal by 2030. Kenya’s 985 MW of geothermal and 310 MW of wind underpin an ambition for 100% renewable electricity by 2030, buffered by reliable Rift Valley steam resources.
Ethiopia’s 5,150 MW Grand Renaissance Dam highlights the mismatch between mega-project output and limited regional interconnectors, stranding 40% of wet-season generation potential. Ghana’s 563 MW solar pipeline complements a 2 million off-grid-connection target supported by AfDB guarantees. Namibia, Zambia, Tanzania, and Mauritania together add 1.5 GW between 2024 and 2026, led by Namibia’s USD 10 billion Hyphen hydrogen scheme and Zambia’s Scaling Solar tranches. These national programs collectively push the Africa renewable energy market toward a more balanced geographic spread.
Competitive Landscape
The market exhibits moderate concentration. Sovereign-backed Gulf developers ACWA Power and Masdar dominate multi-GW tenders in Egypt, Morocco, and South Africa, leveraging cheap capital and favorable diplomatic ties to secure sub-USD 0.03 per kWh tariffs. European engineering majors, Enel Green Power, TotalEnergies, and ENGIE, differentiate through hybrid solar-storage solutions tailored for weak grids in Kenya, Nigeria, and Ghana. Chinese OEMs JinkoSolar, Canadian Solar, and First Solar supplied 65% of photovoltaic shipments to Africa in 2025 by bundling extended payment terms with local assembly to satisfy domestic-content rules.
Scatec and Mainstream Renewable Power retain equity to capture operational cash flows, contrasting with the build-transfer model favored by many peers. Vestas and Siemens Gamesa focus on life-cycle service revenues, with Vestas’ South African nacelle plant cutting logistics expenses 15% and Siemens Gamesa offering 25-year availability guarantees that mitigate performance-risk perceptions.
White-space growth lies in commercial-industrial wheeling deals where mining companies bypass utility tariffs. Emerging African developers such as BTE Renewable secure early-stage permits through regulatory familiarity, then syndicate to international partners post-environmental clearance, earning development fees with limited balance-sheet exposure. Mandatory two-hour battery storage on new South African projects advantages vertically integrated groups that can source lithium-ion cells at scale, underscoring how storage capability will shape future Africa renewable energy market competitiveness.
Africa Renewable Energy Industry Leaders
Vestas Wind Systems A/S
ACWA Power
Enel Green Power S.p.A.
EDF Renewables
JinkoSolar
- *Disclaimer: Major Players sorted in no particular order

Recent Industry Developments
- December 2025: Red Rocket, as the preferred bidder for 650 MW of solar projects under South Africa's REIPPPP Bid Window 7, has bolstered the nation's renewable energy capacity. Notably, Red Rocket secured three out of the four awarded projects. Situated in the Free State and Mpumalanga provinces, these projects are slated to connect to the grid within the next 24 months.
- November 2025: A coalition of governments, banks, and private investors has pledged a substantial investment of EUR 15.5 billion to bolster renewable energy initiatives across Africa. Their ambitious goal is to ensure an output of 26.8 gigawatts of power, lighting up over 17.5 million homes by 2030.
- October 2025: With a commitment exceeding EUR 1.1 billion, the European Commission is spearheading efforts to amplify renewable energy initiatives across Africa. This funding, split into a EUR 545 million package and a later EUR 618 million tranche, was unveiled at the Global Gateway Forum.
- January 2025: JUWI Renewable Energies announced construction on three significant private solar projects. With investments exceeding ZAR6 billion and a combined capacity of 340 megawatts (MW), these initiatives are poised to play a pivotal role in South Africa's shift towards cleaner energy.


Africa Renewable Energy Market Report Scope
Renewable energy, sourced from nature's rapidly replenishing elements such as sunlight, wind, water, and geothermal heat, delivers power with minimal to zero greenhouse gas emissions. This stands in stark contrast to the emissions from finite fossil fuels. The primary forms of renewable energy encompass solar, wind, hydropower, biomass, and geothermal. These energies are captured using technologies like solar panels, wind turbines, and dams, presenting a sustainable solution in the fight against climate change.
The Africa renewable energy market is segmented by technology, end-user, and geography. By technology, the market is segmented into solar energy, wind energy, hydropower, bioenergy, geothermal energy, and ocean energy. By end-user, the market is segmented into utilities, commercial and industrial, and residential. By geography, the market is segmented into South Africa, Egypt, Nigeria, Morocco, Algeria, Ethiopia, Kenya, Ghana, and the rest of Africa. For each segment, the market sizing and forecasts have been conducted on the basis of volume (GW).
By Technology
| Solar Energy (PV and CSP) |
| Wind Energy (Onshore and Offshore) |
| Hydropower (Small, Large, PSH) |
| Bioenergy |
| Geothermal |
| Ocean Energy (Tidal and Wave) |
By End-User
| Utilities |
| Commercial and Industrial |
| Residential |
By Geography
| South Africa |
| Egypt |
| Nigeria |
| Morocco |
| Algeria |
| Ethiopia |
| Kenya |
| Ghana |
| Rest of Africa |
| By Technology | Solar Energy (PV and CSP) |
| Wind Energy (Onshore and Offshore) | |
| Hydropower (Small, Large, PSH) | |
| Bioenergy | |
| Geothermal | |
| Ocean Energy (Tidal and Wave) | |
| By End-User | Utilities |
| Commercial and Industrial | |
| Residential | |
| By Geography | South Africa |
| Egypt | |
| Nigeria | |
| Morocco | |
| Algeria | |
| Ethiopia | |
| Kenya | |
| Ghana | |
| Rest of Africa |


Key Questions Answered in the Report
How large will Africa’s renewable capacity be by 2031?
Installed capacity is projected to reach 179.66 GW by 2031, expanding from 86.95 GW in 2026 at a 15.62% CAGR.
Which technology is growing fastest across the continent?
Solar photovoltaic installations are forecast to post a 27.84% CAGR between 2026 and 2031, outpacing wind, hydro, and geothermal additions.
Why are mining companies signing power-purchase agreements?
Miners seek to hedge diesel price swings and meet Scope 2 emission targets, driving an 18.36% CAGR in commercial-industrial renewable uptake.
Which country will add capacity most rapidly?
Algeria is expected to grow capacity at 42.51% CAGR through 2031, propelled by large-scale solar tenders and hydrogen export ambitions.
What is the main risk to renewable investors in Africa?
Grid curtailment and currency-convertibility limits pose the biggest challenges, collectively shaving up to 2.1 percentage points off the forecast CAGR.
Page last updated on:


