Market Overview
| Study Period | 2021 - 2031 |
|---|---|
| Forecast Data Period | 2026 - 2031 |
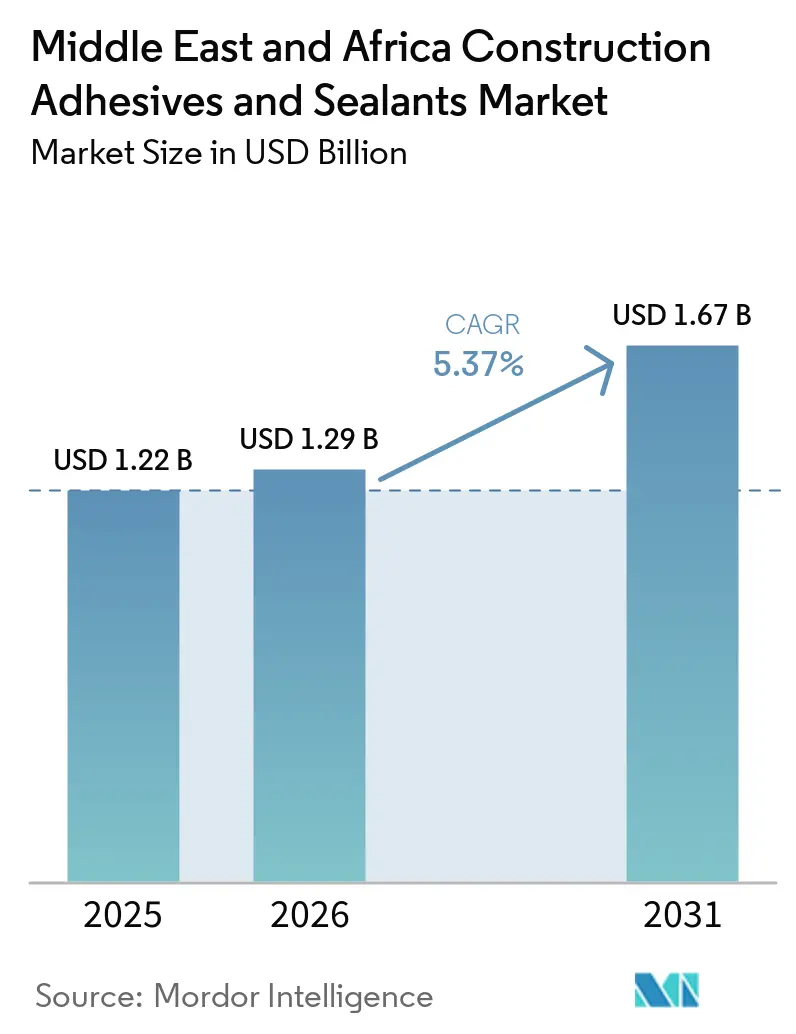
| Base Year Market Size (2025) | USD 1.22 Billion |
| Market Size (2026) | USD 1.29 Billion |
| Market Size (2031) | USD 1.67 Billion |
| Growth Rate (2026 - 2031) | 5.37% CAGR |
| Market Concentration | Medium |
Major Players *Disclaimer: Major Players sorted in no particular order Image © Mordor Intelligence. Reuse requires attribution under CC BY 4.0. | |
Middle East And Africa Construction Adhesives And Sealants Market Analysis by Mordor Intelligence
The Middle East and Africa Construction Adhesives and Sealants Market size is expected to increase from USD 1.22 billion in 2025 to USD 1.29 billion in 2026 and reach USD 1.67 billion by 2031, growing at a CAGR of 5.37% over 2026-2031. Giga-projects in the Gulf Cooperation Council (GCC), increasing modular housing initiatives in sub-Saharan Africa, and regulatory efforts promoting low-volatile organic compound (VOC) chemistries are driving value growth to outpace volume growth. Suppliers establishing localized polyurethane pre-polymer production in Saudi Arabia and the UAE are significantly reducing lead times from weeks to days. This enables contractors to mitigate risks associated with Red Sea freight disruptions and fluctuations in Brent-driven feedstock prices. Additionally, carbon-reduction targets outlined in sovereign green-building codes are increasing the demand for bio-based hot melts and reactive sealants, which are preferred by developers aiming for Leadership in Energy and Environmental Design (LEED) and Estidama certifications. Consequently, the Middle East & Africa construction adhesives and sealants market is evolving into a dual-speed dynamic, with GCC megaprojects requiring high-performance, technology-driven products, while African infrastructure projects focus on cost-efficient acrylics and water-borne dispersions.
Key Report Takeaways
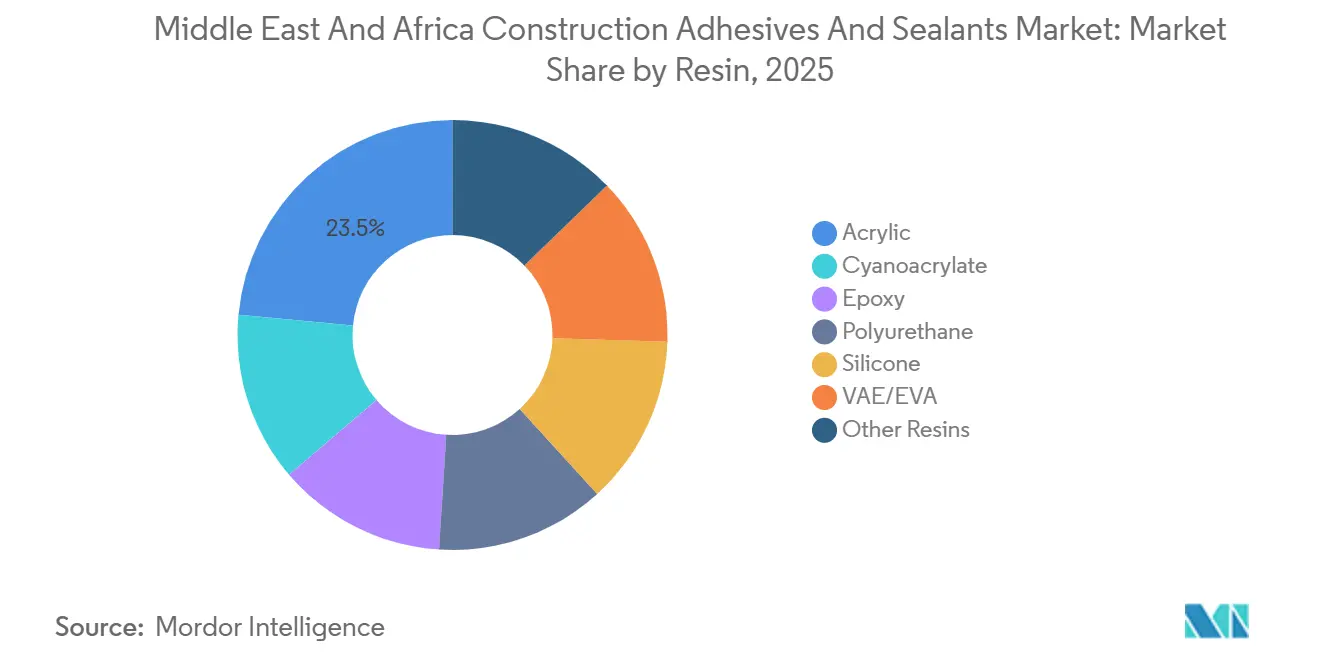
- By resin, acrylic commanded 23.49% of the Middle East & Africa construction adhesives & sealants market share in 2025, while silicone is forecast to achieve the fastest 7.02% CAGR to 2031.
- By technology, sealants led with 40.73% revenue share in 2025 and are advancing at a 7.09% CAGR through 2031, outpacing all adhesive technologies.
- By application, flooring and tiling captured 38.77% of the Middle East & Africa construction adhesives & sealants market size in 2025, whereas infrastructure joints recorded the highest 6.50% CAGR for 2026-2031.
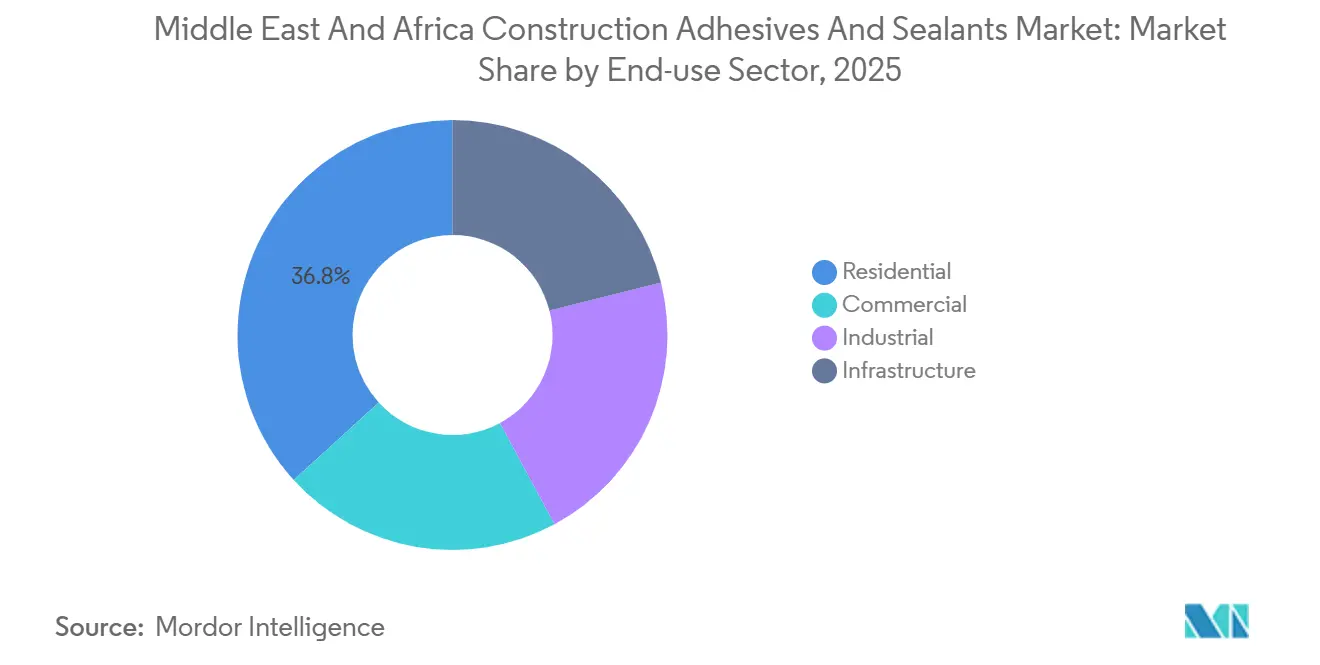
- By end-use sector, infrastructure is forecast to lead growth at 7.23% CAGR to 2031, while residential remained the largest volume consumer at 36.78% in 2025.
- By geography, Saudi Arabia held 29.74% revenue share in 2025, yet South Africa is the fastest-growing country with a 5.45% CAGR to 2031.
Note: Market size and forecast figures in this report are generated using Mordor Intelligence’s proprietary estimation framework, updated with the latest available data and insights as of January 2026.
Middle East And Africa Construction Adhesives And Sealants Market Trends and Insights
Drivers Impact Analysis*
| Drivers | (~) % Impact on CAGR Forecast | Geographic Relevance | Impact Timeline |
|---|---|---|---|
| Booming GCC giga-projects (NEOM, Qiddiya) | +1.2% | Saudi Arabia, UAE, Qatar | Medium term (2-4 years) |
| Stricter GCC low-VOC regulations shifting demand to water-borne and reactive chemistries | +0.9% | Saudi Arabia, UAE, Qatar, with spillover to Egypt | Short term (≤ 2 years) |
| Rise of modular/off-site construction across East Africa | +0.7% | Kenya, Tanzania, Ethiopia, Rest of Africa | Medium term (2-4 years) |
| Localization of polyurethane pre-polymer production in Saudi Arabia and UAE | +0.6% | Saudi Arabia, UAE, with regional distribution benefits | Short term (≤ 2 years) |
| Carbon-reduction mandates accelerating bio-based formulations adoption | +0.5% | Global, early adoption in UAE and South Africa | Long term (≥ 4 years) |
| Adoption of AI-driven smart-dispensing systems improving application productivity | +0.4% | GCC commercial and infrastructure projects | Medium term (2-4 years) |
| Source: Mordor Intelligence | |||


Booming GCC Giga-Projects Drive Specialty Adhesive Demand
Saudi Arabia's NEOM airport management contract, valued at USD 1.5 billion, and Qiddiya's USD 1.8 billion athletics stadium both require fire-rated sealants and structural epoxies, significantly increasing adhesive consumption, up to three-to-four times more than standard construction projects[1]Construction Week Online, “Qiddiya Awards $1.8 B Contract for National Athletics Stadium,” constructionweekonline.com. The use of curtain walls, insulated metal panels, and prefabricated modules necessitates continuous weatherproofing beads, prompting multinational suppliers to position inventories and technical teams within the kingdom. Additionally, Qatar's QAR 81 billion (USD 22.20 billion) infrastructure pipeline, which includes 286 projects through 2029, sustains demand for silicone and polyurethane joints capable of withstanding temperature swings of up to 50 degrees Celsius. High capital intensity creates entry barriers, steering smaller importers toward less-regulated African markets. As a result, the Middle East and Africa construction adhesives and sealants market benefits from both increased volume and a shift toward certified, premium formulations driven by GCC giga-projects.
Stricter GCC Low-VOC Regulations Accelerate Water-Borne Adoption
The United Arab Emirates (UAE) Federal Decree-Law No. 21 of 2024 limits adhesive volatile organic compounds (VOCs) to 50 grams per liter, while Dubai's TG-04 regulation reduces sealant VOC limits to 250 grams per liter, with compliance enforced through mandatory third-party audits. In response, BASF introduced Baxxodur EC 151, which reduces VOC emissions by 90%, enabling flooring contractors to avoid AED 50,000 penalties for non-compliant batches. Consequently, water-borne acrylic dispersions are projected to rise from 38% of UAE flooring-adhesive sales in 2023 to 60% by 2025. Suppliers are now segmenting their portfolios into premium, compliant lines for GCC projects and legacy solvent-borne grades for less-regulated African markets. This compliance gap is accelerating the adoption of advanced technologies, even in regions with limited enforcement.
Rise of Modular Construction in East Africa Expands Acrylic Volumes
Ethiopia's plan to deliver 50,000 prefabricated homes by 2027 specifies the use of acrylic panel adhesives and silicone joint sealants to reduce on-site assembly times and skilled labor requirements. In Nairobi, modular office projects are completed 50-75% faster and at 15-30% lower costs, driving demand for automated dispensing systems that cut adhesive waste by 20%. Meanwhile, Tanzania is piloting modular clinics and rural schools using moisture-curing polyurethanes, eliminating the need for electrical curing ovens. These initiatives add a diversified demand layer beneath GCC mega-projects, strengthening the Middle East and Africa construction adhesives and sealants market across various price points.
Localization of Polyurethane Pre-Polymer Production Reduces Supply-Chain Risk
BCI Group's 60,000 tons per year plant in Riyadh and Pearl Group's expanded production line in Jeddah now deliver pre-polymers within 72 hours, compared to the six-week transit time from Asia to the GCC prior to 2024[2]Arab News, “BCI Group Opens New Polyurethane Plant in Riyadh,” arabnews.com. Local production shields formulators from Red Sea freight premiums, which still add USD 1,900 per container, and enables 90-day fixed-price windows, improving gross margins by up to six percentage points. Just-in-time shipping also reduces on-site storage costs and prevents viscosity drift in hot climates, enhancing application quality for mega-projects.
Restraints Impact Analysis*
| Restraints | (~) % Impact on CAGR Forecast | Geographic Relevance | Impact Timeline |
|---|---|---|---|
| Petro-feedstock price volatility and Red Sea freight surcharges | -0.8% | Global, acute impact on import-dependent African markets | Short term (≤ 2 years) |
| Fragmented distribution network outside GCC slowing product penetration | -0.6% | Rest of Africa, particularly sub-Saharan markets | Medium term (2-4 years) |
| Delayed harmonization of VOC limits across African countries raises compliance costs | -0.4% | Egypt, South Africa, Rest of Africa | Long term (≥ 4 years) |
| Skilled-applicator shortage elevating project re-work risk | -0.5% | Saudi Arabia, UAE, South Africa | Short term (≤ 2 years) |
| Source: Mordor Intelligence | |||
Petro-Feedstock Volatility & Freight Surcharges Compress Margins
In 2025, Brent crude oil prices fluctuated between USD 72-95 per barrel, resulting in 22-28% price variations for methylene diphenyl diisocyanate (MDI) and toluene diisocyanate (TDI). These fluctuations have created challenges for contractors working on fixed-price projects, as they face difficulties in managing cost changes. Additionally, rerouting through the Red Sea increased freight costs by USD 1,900 per container and extended acetic acid lead times by up to six weeks. This situation has required African distributors to increase their safety stock levels. Multinational companies with the ability to hedge futures have managed to maintain their margins, while smaller resellers have experienced a reduction in market share.
Fragmented Distribution Networks Hinder Product Penetration
The sub-Saharan adhesive market is served by over 200 independent wholesalers, each operating within a limited radius of 50-150 km. These wholesalers often lack the cold-chain infrastructure necessary for polyurethane products. As a result, contractors must source materials through multiple intermediaries, which extends procurement cycles by up to two weeks. This inefficiency has led to increased landed costs, particularly in rural areas of South Africa and Kenya.
*Our forecasts treat driver/restraint impacts as directional, not additive. The impact forecasts reflect baseline growth, mix effects, and variable interactions.
Segment Analysis
By Resin: Silicone Gains on Infrastructure Joints, Acrylic Holds Flooring
Silicone resins are projected to grow at a 7.02% compound annual growth rate (CAGR) from 2026 to 2031, driven by demand for ±25% movement capacity in bridge, tunnel, and metro joints without cohesive failure. This growth is linked to Qatar’s transportation infrastructure expansion and Egypt’s high-rise facades, which prioritize low-modulus sealants that contribute to Leadership in Energy and Environmental Design (LEED) certification points. Acrylic resins held a 23.49% share of the Middle East & Africa construction adhesives and sealants market in 2025, supported by flooring and tiling applications that comply with Gulf Cooperation Council (GCC) volatile organic compound (VOC) regulations. Water-borne acrylics, meeting 20-30 minute open-time requirements for large tiles and adhering to 50 grams per liter (g/L) VOC thresholds, have secured contractor preference.
Polyurethane resins are widely used in roofing and insulation, where moisture-curing simplifies logistics in remote African locations. Epoxy resins are preferred for structural bonding in precast elements, with products like Baxxodur EC 151 enabling same-day traffic on industrial floors. Vinyl acetate ethylene (VAE)/ethylene vinyl acetate (EVA) emulsions dominate cost-sensitive housing projects in Egypt and South Africa, offering 70% of acrylic bond strength at 40% lower cost. Hybrid silane systems are utilized in coastal projects exposed to salt spray.


By Technology: Sealants Lead Growth, Water-Borne Gains Share
Sealants accounted for 40.73% of 2025 revenue and are expected to grow at a 7.09% CAGR, driven by applications in bridge decks, curtain-wall perimeters, and expansion joints specified in GCC tenders. Qatar’s metro extensions and Egypt’s administrative capital projects require thermal-shock-resistant silicones and polyurethanes capable of flexing 15-20 millimeters (mm) daily. Water-borne adhesives have increased their share of UAE flooring sales from 38% in 2023 to 60%, following the implementation of Decree-Law No. 21, which enforces 50 g/L VOC limits and imposes AED 50,000 (USD 13,612.3) fines for non-compliance.
Reactive chemistries, such as two-component epoxies, provide bond strengths exceeding 2.5 megapascals (MPa) across job sites with temperatures ranging from 10-50 °C. Hot melts, with three-second set times, are increasingly used for prefabricated insulated panels, with Henkel’s 63% bio-based LOCTITE HB S ECO gaining traction among contractors aiming for LEED certification. Solvent-borne adhesives remain in use in markets with limited regulatory enforcement, but are expected to lose market share as South Africa adopts 75 g/L VOC caps by 2028.
By Application: Infrastructure Joints Accelerate, Flooring Dominates Volume
Infrastructure joints are projected to grow at a 6.50% CAGR through 2031, driven by demand from Saudi Arabia, Qatar, and South Africa for traffic-rated silicones like Tremco Spectrem 800SL. These joints are designed to withstand 25-year cycles of ultraviolet (UV) and temperature stress, justifying their premium pricing. Flooring and tiling applications accounted for 38.77% of 2025 volume, relying on one-component acrylics and VAE dispersions that meet the fast-track construction schedules of Egyptian residential towers.
Roofing applications utilize moisture-curing polyurethanes to bond thermoplastic polyolefin (TPO) membranes to concrete without primers, a critical requirement for Saudi logistics hubs. Facade and wall-panel bonding relies on structural silicones and epoxies that transmit wind loads to frames, supported by digital quality monitoring under Sika’s 2026 Giatec alliance. Insulation and weatherproofing segments are expanding due to Estidama energy mandates, which promote the use of low-viscosity polyurethanes for masonry crack penetration.
By End-Use Sector: Infrastructure Outpaces Residential, Commercial Holds Steady
Infrastructure is expected to lead future growth with a 7.23% CAGR, as governments prioritize spending on utilities, transport, and renewable energy over speculative housing. South Africa’s ZAR 18.7 billion program, which allocates significant funding for water treatment and corridor upgrades, is driving demand for epoxy and silicone products. Residential applications accounted for 36.78% of the 2025 volume, supported by Egypt’s affordable housing initiatives that favor cost-effective VAE emulsions.
Commercial projects in the UAE and Saudi Arabia are increasingly adopting fire-rated sealants, such as Henkel’s Teroson MS 949 FR, launched in March 2026. Industrial facilities specify chemically resistant epoxies and high-temperature silicones to withstand exposure to corrosive fluids.
Geography Analysis
Saudi Arabia is projected to contribute 29.74% of 2025 revenue, supported by contracts from NEOM and Qiddiya that require structural epoxies and fire-rated sealants. Local polyurethane production by Basic Chemical Industries (BCI) and Pearl Group has reduced delivery times from six weeks to three days, addressing risks associated with Red Sea freight delays. In the United Arab Emirates, the enforcement of 50 grams per liter (g/L) volatile organic compound (VOC) limits is expected to result in a 60% market share for water-borne flooring adhesives by 2025. Meanwhile, Qatar’s QAR 81 billion (USD 22.20 billion) development plan continues to sustain high demand for silicone curtain-wall sealants.
South Africa is anticipated to record the fastest growth, with a 5.45% compound annual growth rate (CAGR) through 2031, supported by a ZAR 18.7 billion (USD 1.13 billion) public-works initiative focusing on water treatment and renewable energy grids. The Macassar Wastewater Treatment Works alone is expected to require corrosion-resistant coatings valued at USD 251 million. In Egypt, the EGP 240 billion (USD 4.51 billion) expansion of the New Administrative Capital is driving demand for low-modulus silicone facades and acrylic flooring adhesives. Additionally, H.B. Fuller Company’s Cairo plant, set to be operational by 2025, will reduce lead times to five days, enhancing inventory management.
Markets in the rest of the Middle East and sub-Saharan Africa face challenges such as fragmented distribution networks and cold-chain limitations. However, modular construction programs in Ethiopia, Kenya, and Tanzania are increasing demand for cost-effective acrylics and silicones. Government-led pilot projects for prefabricated clinics and schools are also expected to expand the use of polyurethane in rural construction projects.
Competitive Landscape
The Middle East and Africa construction adhesives and sealants market is moderately consolidated. Localization remains a significant strategy: H.B. Fuller’s Cairo facility and Ras Al Khaimah expansion have reduced delivery times from six weeks to five days, providing a competitive advantage for servicing large-scale project contractors. Sika’s planned 2026 partnership with Giatec Scientific Inc. aims to integrate concrete sensors with adhesives, addressing the 12% sealant failure rate caused by mixing errors in Saudi Arabia.
Bio-based innovation is another area of focus, with Henkel collaborating with Sekab Biofuels & Chemicals AB to secure renewable solvents, while BASF SE introduces low-volatile organic compound (VOC) hardeners. Smart dispensing technologies from companies such as Coherix Inc., RAMPF Group, and Graco Inc. are gaining popularity among Gulf Cooperation Council (GCC) contractors seeking to address labor shortages. In the price-sensitive African housing market, regional formulators are maintaining market share by over-formulating to meet GCC VOC standards and offering a single stock-keeping unit (SKU) across multiple countries, sacrificing 8-10% margins for operational simplicity.
Middle East And Africa Construction Adhesives And Sealants Industry Leaders
Henkel AG & Co. KGaA
Sika AG
Arkema
Dow
H.B. Fuller Company
- *Disclaimer: Major Players sorted in no particular order

Recent Industry Developments
- January 2026: Henkel AG & Co. KGaA introduced Teroson MS 949 FR, a single-component fire-retardant sealant that meets American Society for Testing and Materials (ASTM) E84 Class A standards for use in metro and airport joints. This product is expected to support the growing demand for advanced sealants in the Middle East & Africa construction adhesives and sealants market.
- July 2025: H.B. Fuller Company introduced the Millennium PG-1 EF ECO2 roofing adhesive, featuring recycled polymer content and compliance with United Arab Emirates water-quality regulations. This development reflects the increasing focus on sustainable practices within the Middle East and Africa construction adhesives and sealants industry.


Middle East And Africa Construction Adhesives And Sealants Market Report Scope
Construction adhesives and sealants are important building materials. Adhesives provide structural bonds between components, serving as an alternative to fasteners. Sealants, in contrast, are flexible materials used to fill gaps and prevent the infiltration of water, air, and noise. While adhesives are typically rigid and permanent, sealants are designed to remain flexible to accommodate movement and expansion.
The Middle East & Africa construction adhesives and sealants market is segmented by resin, technology, application, end-use sector, and geography. By resin, the market is segmented into acrylic, cyanoacrylate, epoxy, polyurethane, silicone, VAE/EVA, and other resins. By technology, the market is segmented into water-borne, solvent-borne, reactive, hot-melt, and sealants. By application, the market is segmented into flooring and tiling, roofing, wall panels and facades, insulation and weatherproofing, and infrastructure joints (bridges, tunnels). By end-use sector, the market is segmented into residential, commercial, industrial, and infrastructure. The report also covers the market size and forecasts for construction adhesives and sealants in 5 countries across the region. The market sizes and forecasts are provided in terms of value (USD).
By Resin
| Acrylic |
| Cyanoacrylate |
| Epoxy |
| Polyurethane |
| Silicone |
| VAE/EVA |
| Other Resins |
By Technology
| Water-borne |
| Solvent-borne |
| Reactive |
| Hot-melt |
| Sealants |
By Application
| Flooring and Tiling |
| Roofing |
| Wall Panels and Facades |
| Insulation and Weatherproofing |
| Infrastructure Joints (bridges, tunnels) |
By End-use Sector
| Residential |
| Commercial |
| Industrial |
| Infrastructure |
By Geography
| Saudi Arabia |
| United Arab Emirates |
| Qatar |
| South Africa |
| Egypt |
| Rest of Middle East and Africa |
| By Resin | Acrylic |
| Cyanoacrylate | |
| Epoxy | |
| Polyurethane | |
| Silicone | |
| VAE/EVA | |
| Other Resins | |
| By Technology | Water-borne |
| Solvent-borne | |
| Reactive | |
| Hot-melt | |
| Sealants | |
| By Application | Flooring and Tiling |
| Roofing | |
| Wall Panels and Facades | |
| Insulation and Weatherproofing | |
| Infrastructure Joints (bridges, tunnels) | |
| By End-use Sector | Residential |
| Commercial | |
| Industrial | |
| Infrastructure | |
| By Geography | Saudi Arabia |
| United Arab Emirates | |
| Qatar | |
| South Africa | |
| Egypt | |
| Rest of Middle East and Africa |


Market Definition
- End-user Industry - Residential construction, commercial construction, public buildings, industrial buildings and infrastructure projects are considered under the construction industry.
- Product - All adhesive and sealant products used in construction industry are considered in the market studied
- Resin - Under the scope of the study, resins like Polyurethane, Epoxy, Acrylic, Cyanoacrylate, VAE/EVA, and Silicone are considered
- Technology - For the purpose of this study, Water-borne, Solvent-borne, Reactive, Hot Melt, and Sealants technologies are taken into consideration.
| Keyword | Definition |
|---|---|
| Hot-melt Adhesive | Hot melt adhesives are generally 100% solid formulations, based on thermoplastic polymers. They are solid at room temperature and are activated upon heating above their softening point, at which stage they are liquid, and hence, can be processed. |
| Reactive Adhesive | A reactive adhesive is made up of monomers that react in the adhesive curing process and do not evaporate from the film during use. Instead, these volatile components become chemically incorporated into the adhesive. |
| Solvent-borne Adhesive | Solvent-borne adhesives are mixtures of solvents and thermoplastic, or slightly cross-linked polymers, such as polychloroprene, polyurethane, acrylic, silicone, and natural and synthetic rubbers (elastomers). |
| Water-borne Adhesive | Water-borne adhesives use water as a carrier or diluting medium to disperse a resin. They are set by allowing the water to evaporate or be absorbed by the substrate. These adhesives are compounded with water as a diluent, rather than a volatile organic solvent. |
| UV Cured Adhesive | UV curing adhesives induce curing and create a permanent bond without heating by using ultraviolet (UV) light or other radiation sources. An aggregation of monomers and oligomers is cured or polymerized by ultraviolet (UV) or visible light in a UV adhesive. Because UV is a radiating energy source, UV adhesives are often referred to as radiation curing or rad-cure adhesives. |
| Heat-resistant Adhesive | Heat-resistant Adhesives refer to those that do not break down under high temperatures. One aspect of a complicated system of circumstances is the adhesive's capacity to withstand disintegration brought on by high temperatures. As the temperature rises, adhesives may liquefy. They can withstand stresses resulting from differing coefficients of expansion and contraction, which might be an additional advantage. |
| Reshoring | Reshoring is the practice of moving commodity production and manufacturing back to the nation where the business was founded. Onshoring, inshoring, and back shoring are further terms used. Offshoring, the practice of producing items abroad to lower labor and manufacturing costs, is the opposite of this. |
| Oleochemicals | Oleochemicals are compounds produced from biological oils or fats. They resemble petrochemicals, which are substances made from petroleum. The oleochemical business is built on the hydrolysis of oils or fats. |
| Nonporous Materials | Nonporous materials are substances that do not permit the passage of liquid or air. Nonporous materials are those that are not porous, such as glass, plastic, metal, and varnished wood. Since no air can get through, less airflow is required to raise these materials, negating the requirement for high airflow. |
| EU-Vietnam Free Trade Agreement | A trade agreement and an investment protection agreement were concluded between the European Union and Vietnam on June 30, 2019. |
| VOC content | Compounds with limited solubility in water and high vapor pressure are known as Volatile Organic Compounds (VOCs). Many VOCs are human-made chemicals that are used and produced in the manufacture of paints, pharmaceuticals, and refrigerants. |
| Emulsion Polymerization | Emulsion polymerization is a method of producing polymers or connected groups of smaller chemical chains known as monomers, in a water solution. The method is often used to make water-based paints, adhesives, and varnishes, in which the water stays with the polymer and is marketed as a liquid product. |
| 2025 National Packaging Targets | In 2018, the Australian Environment Ministry set the following 2025 National Packaging Targets: 100% of the packaging must be reusable, recyclable, or compostable by 2025, 70% of plastic packaging must be recycled or composted by 2025, 50% of average recycled content must be included in packaging by 2025, and problematic and unnecessary single-use plastic packaging must be phased out by 2025. |
| Russian Government’s Import Substitution Policy | The Western sanctions suspended the distribution of several high-tech items to Russia, including those required by the raw material export sectors and the military-industrial complex. In response, the government launched an "import substitution" scheme, appointing a special commission to oversee its implementation in early 2015. |
| Paper Substrate | Paper substrates are paper sheets, reels, or boards with a base weight of up to 400 g/m2 that has not been converted, printed or otherwise altered. |
| Insulation Material | A material that inhibits or blocks heat, sound, or electrical transmission is known as Insulation Material. The variety of insulation materials includes thick fibers like fiberglass, rock and slag wool, cellulose, and natural fibers as well as stiff foam boards and sleek foils. |
| Thermal Shock | A temperature change known as thermal shock generates stress in a material. It commonly results in material breakdown and is especially prevalent in brittle materials like ceramics. When there is a quick temperature change, either from hot to cold or vice versa, this process occurs abruptly. It occurs more frequently in materials with poor heat conductivity and insufficient structural integrity. |


Research Methodology
Mordor Intelligence follows a four-step methodology in all our reports.
- Step-1: Identify Key Variables: The quantifiable key variables (industry and extraneous) pertaining to the specific product segment and country are selected from a group of relevant variables & factors based on desk research & literature review; along with primary expert inputs. These variables are further confirmed through regression modeling (wherever required).
- Step-2: Build a Market Model: In order to build a robust forecasting methodology, the variables and factors identified in Step-1 are tested against available historical market numbers. Through an iterative process, the variables required for market forecast are set and the model is built on the basis of these variables.
- Step-3: Validate and Finalize: In this important step, all market numbers, variables and analyst calls are validated through an extensive network of primary research experts from the market studied. The respondents are selected across levels and functions to generate a holistic picture of the market studied.
- Step-4: Research Outputs: Syndicated Reports, Custom Consulting Assignments, Databases & Subscription Platforms


