
Market Overview
| Study Period | 2021 - 2031 |
|---|---|
| Forecast Data Period | 2026 - 2031 |
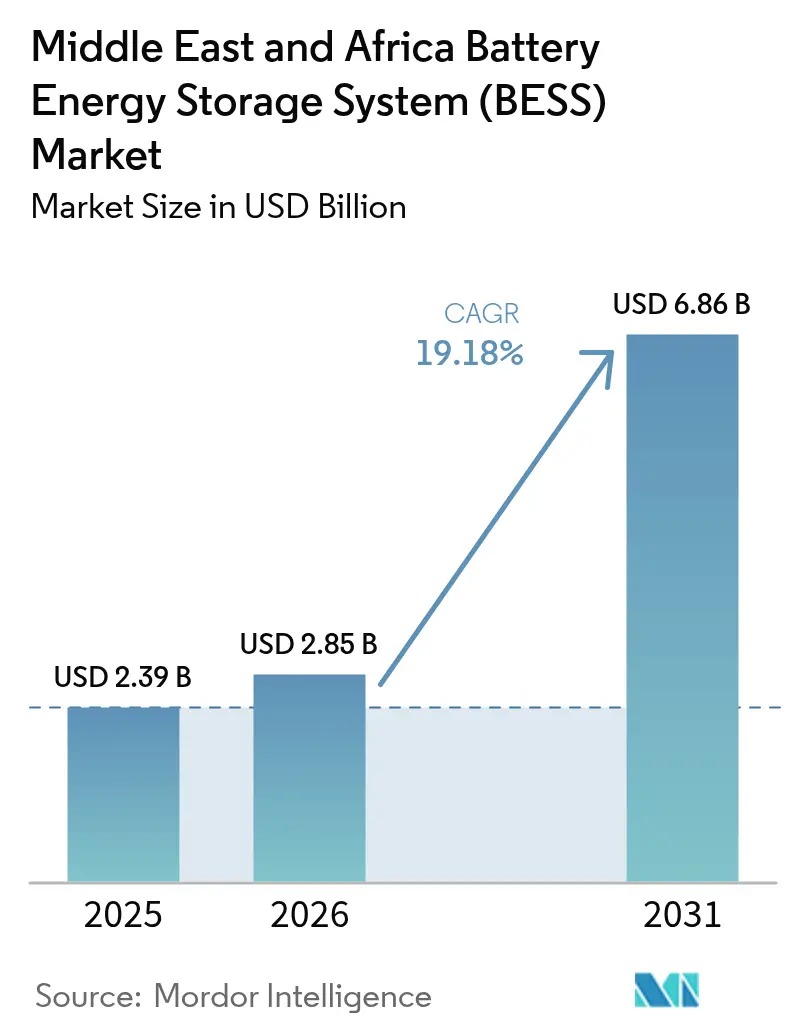
| Base Year Market Size (2025) | USD 2.39 Billion |
| Market Size (2026) | USD 2.85 Billion |
| Market Size (2031) | USD 6.86 Billion |
| Growth Rate (2026 - 2031) | 19.18 % |
| Market Concentration | Medium |
Major Players *Disclaimer: Major Players sorted in no particular order Image © Mordor Intelligence. Reuse requires attribution under CC BY 4.0. | |
Middle East And Africa Battery Energy Storage System (BESS) Market Analysis by Mordor Intelligence
The Middle East And Africa Battery Energy Storage System Market size in 2026 is estimated at USD 2.85 billion, growing from 2025 value of USD 2.39 billion with 2031 projections showing USD 6.86 billion, growing at 19.18% CAGR over 2026-2031.
Accelerated sovereign-fund spending, mandatory storage, and renewables co-tenders, as well as sub-Saharan mining hybrids, are reshaping capacity additions. Lithium-ion price falls below USD 100/kWh have removed subsidy dependence, while flow-battery pilots demonstrate superior long-duration economics. Multi-year framework agreements, such as Saudi Electricity Company’s 2.5 GW deal, are lowering financing spreads, enabling developers to capture the upside of ancillary services. Heightened competition between Chinese cell suppliers and European integrators compresses hardware margins, redirecting value toward software, services, and local assembly.
Key Report Takeaways
- By battery type, lithium-ion chemistries held 79.82% of the Middle East and Africa battery energy storage system market share in 2025, while flow batteries are expected to expand at a 28.25% CAGR through 2031.
- By connection type, on-grid systems led with 73.65% revenue share in 2025; off-grid deployments are advancing at a 26.1% CAGR to 2031.
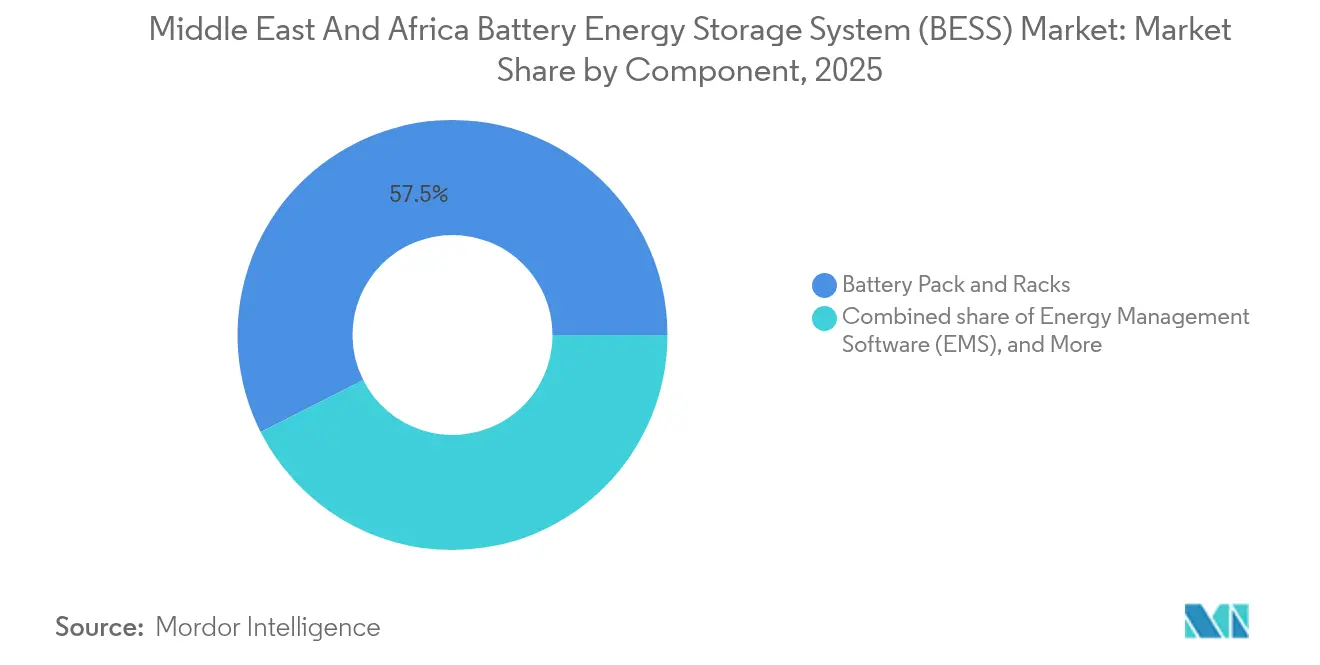
- By component, battery packs and racks captured a 57.45% share of the Middle East and Africa battery energy storage system market size in 2025; energy-management software is projected to rise at a 26.8% CAGR through 2031.
- By energy capacity range, the 10-100 MWh band accounted for 33.12% of the Middle East and Africa battery energy storage system market size in 2025, while the 100-500 MWh segment recorded the fastest growth at a 29.1% CAGR.
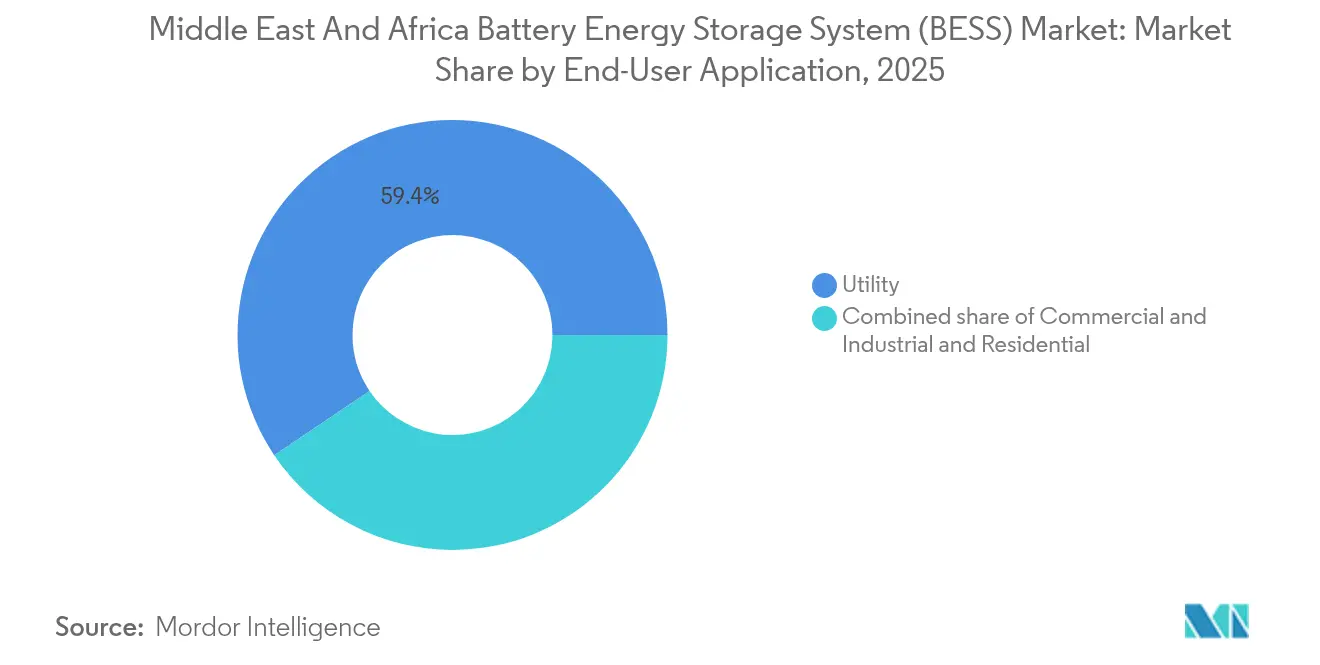
- By end-user, utility applications held a 59.44% share in 2025 and are projected to progress at a 21.9% CAGR to 2031.
- By geography, Saudi Arabia commanded a 23.08% share in 2025 and is forecast to grow at a 22.95% CAGR through 2031.
- The five largest suppliers collectively held roughly 55% of contracted capacity in 2024.
Note: Market size and forecast figures in this report are generated using Mordor Intelligence’s proprietary estimation framework, updated with the latest available data and insights as of 2026.
Market Trends and Insights
Drivers Impact Analysis of Middle East And Africa Battery Energy Storage System (BESS) Market*
| Driver | (~) % Impact on CAGR Forecast | Geographic Relevance | Impact Timeline |
|---|---|---|---|
| Rapid utility-scale solar and wind build-outs | 4.20% | Saudi Arabia, UAE, Egypt, South Africa | Medium term (2-4 years) |
| National grid-stability mandates | 3.80% | Saudi Arabia, UAE, Qatar | Short term (≤ 2 years) |
| Falling LFP battery prices below USD 100/kWh | 3.50% | GCC and South Africa | Short term (≤ 2 years) |
| Oil-exporting nations’ decarbonization funds | 2.90% | Saudi Arabia, UAE, Qatar, Kuwait | Long term (≥ 4 years) |
| Mining-site hybrid-power economics | 2.40% | South Africa, DRC, Zambia, Namibia | Medium term (2-4 years) |
| Data-center power-quality requirements | 1.70% | UAE, Saudi Arabia, South Africa, Egypt | Short term (≤ 2 years) |
| Source: Mordor Intelligence | |||
Rapid Utility-Scale Solar and Wind Build-Outs
Saudi Arabia, the United Arab Emirates, Egypt, and South Africa are embedding four-hour storage into every new solar tender and two-hour storage into all wind solicitations, making batteries a mandatory cost of entry.[1] Developers such as ACWA Power and Masdar have pre-ordered more than 12 GWh of lithium-iron-phosphate cells for projects scheduled before 2027. Egypt’s 1 GW solar pipeline pairs 200 MWh of storage to avoid curtailment in the Suez Canal Economic Zone. South Africa’s latest IPP round allocated 1.2 GW of battery capacity at tariffs that undercut Eskom’s coal fleet, demonstrating competitive parity. Because grid studies now evaluate generation and storage together, average project lead times have fallen by nearly two years, accelerating revenue realization.
National Grid-Stability Mandates
Regulators in Saudi Arabia and the UAE now treat storage as essential infrastructure, issuing directives that require the grid operator to procure fixed volumes or face financial penalties.[2] Saudi Arabia mandated 26 GWh by 2027, while the UAE agreed to a 19 GWh framework that earns capacity payments independent of energy dispatch. Multi-year contracts reduce transaction costs and provide lenders with predictable cash flows, resulting in spreads of 200-250 basis points over the SOFR rate. Qatar has launched the Gulf’s first standalone 400 MWh tender, signaling a shift toward merchant storage models that monetize ancillary services. Strict IEC 62933 compliance rules filter out smaller suppliers that lack certified hardware, raising entry barriers and consolidating market share among tier-one integrators.
Falling LFP Battery Prices Below USD 100/kWh
Lithium-iron-phosphate cell prices dropped to USD 89/kWh in early 2025 as Chinese manufacturers reduced their margins to maintain plant operations at 60% utilization. Saudi Arabia secured an eight-year supply at USD 85/kWh, allowing for levelized storage costs of under USD 0.05/kWh, even without subsidies. South Africa’s Industrial Development Corporation has funded three local assembly lines that aim to achieve 40% local content by 2027, thereby reducing import duties and shipping costs. As LFP replaces nickel-rich chemistries, fire risk falls and cycle life exceeds 6,000 cycles, making daily arbitrage viable for more utilities. The price plunge is unlocking smaller commercial and industrial projects that previously failed to meet hurdle rates, broadening the addressable market.
Oil-Exporting Nations’ Decarbonization Funds
Sovereign wealth vehicles in Saudi Arabia, the UAE, and Qatar have earmarked USD 180 billion for renewables and storage through 2030, dwarfing private capital pools elsewhere in the region. The Public Investment Fund alone set aside USD 50 billion for 30 GWh of domestic storage and 20 GWh abroad, compressing the cost of capital to 4-6%. Masdar committed USD 30 billion across Egypt, Morocco, and Kenya, structuring 25-year PPAs that de-risk revenue for lenders. Qatar Investment Authority partnered with TotalEnergies on a 5 GWh project aimed at mining and telecom clients with diesel displacement goals. Ready access to equity shortens development cycles and enables lower tariff bids that still meet return thresholds, crowding in additional private financiers.
Restraints Impact Analysis of Middle East And Africa Battery Energy Storage System (BESS) Market*
| Restraint | (~) % Impact on CAGR Forecast | Geographic Relevance | Impact Timeline |
|---|---|---|---|
| Lagging distribution-network digitalization | -2.80% | Nigeria, Kenya, Tanzania | Long term (≥ 4 years) |
| Policy uncertainty in several African states | -2.30% | Nigeria, Kenya, Egypt, Zimbabwe | Medium term (2-4 years) |
| High sovereign-risk financing costs | -1.90% | Nigeria, Kenya, Egypt, Zambia | Medium term (2-4 years) |
| Limited local battery-grade raw-material refining | -1.60% | Region-wide | Long term (≥ 4 years) |
| Source: Mordor Intelligence | |||
Lagging Distribution-Network Digitalization
Only 38% of Nigeria’s distribution feeders and 12% of Tanzanian substations have supervisory control and data acquisition links, preventing batteries from delivering frequency and voltage services. Kenya Power relies on manual dispatch instructions, creating latency that forces storage operators to oversize systems by up to 30% to capture revenue. Eskom initiated a USD 1.2 billion grid modernization project in 2024, but legal disputes have slowed the rollout of four million smart meters. Without real-time data, utilities cannot fully value fast-ramping capacity, resulting in shallow ancillary-service markets. The digital gap deters investors who discount projected cash flows when dispatch certainty is low.
Policy Uncertainty in Several African States
Nigeria’s suspension of feed-in tariffs in 2024 froze 2.5 GW of solar-plus-storage projects, triggering USD 800 million in arbitration claims.[3] Kenya’s regulator revised PPA templates three times in one year, stretching approval cycles from six to 18 months and inflating holding costs. Egypt delayed a 1.5 GWh tender as budget talks stalled, prompting developers to redeploy capital to the Gulf, where frameworks are predictable. Zimbabwe’s foreign-exchange restrictions prevent dividend repatriation, deterring international sponsors. Each reversal raises perceived risk and widens the spread investors demand over risk-free rates, slowing deployment relative to announced targets.
*Our forecasts treat driver/restraint impacts as directional, not additive. The impact forecasts reflect baseline growth, mix effects, and variable interactions.
Middle East And Africa Battery Energy Storage System (BESS) Market Segment Analysis
By Battery Type:
Flow Batteries Challenge Lithium DominanceLithium-ion chemistries remained dominant with an 79.82% share of the Middle East and Africa battery energy storage system market in 2025, thanks to rapid cost decline and mature supply chains. Flow batteries, however, are racing ahead at 28.25% CAGR through 2031 as utilities seek 8- to 12-hour discharge durations for daily arbitrage and seasonal shifting. Eskom’s 200 MWh vanadium redox contract highlights the appeal of 20,000-cycle lifetimes, which reduce levelized storage costs.
Cost spreads are narrowing: Saudi tenders priced LFP at USD 89/kWh, only 30% below flow bids, prompting developers to reconsider chemistry diversification. Lead-acid retains a foothold in telecom backup, while sodium-ion pilots in Morocco and Egypt signal a future low-cost alternative. Thermal-runaway concerns continue to erode nickel-rich chemistries, and hybrid supercapacitors are being trialed for sub-second response in microgrids.


By Connection Type:
Off-Grid Gains on Mining EconomicsOn-grid installations accounted for 73.65% of 2025 deployments, primarily driven by large contracts in Saudi Arabia and the UAE, which supply frequency regulation and capacity firming. Yet, off-grid systems are forecast to expand at a 26.1% CAGR, driven by African mining firms replacing diesel with solar-plus-storage hybrids that achieve a levelized cost of less than USD 0.10/kWh.
Sibanye-Stillwater’s 50 MWh roll-out saves 18 million liters of diesel annually, illustrating the operational upside. Zambia’s Kansanshi copper project will pair 100 MW of solar power with 40 MWh of storage to achieve full energy autonomy by 2026. Rural microgrids in Kenya and hybrid commercial and industrial (C&I) systems in South Africa enhance resilience in areas where grid outages are prevalent.
By Component:
Software Captures Value-Chain MarginsBattery packs and racks represented 57.45% of 2025 spending, yet pricing pressure from Chinese suppliers is eroding margins. Energy-management software, advancing at 26.8% CAGR, is where value is migrating: Fluence’s Mosaic raised project IRRs by up to 18% on Saudi fleets through predictive congestion bidding.
Huawei’s AI-enabled FusionSolar cut degradation by 20% by optimizing depth-of-discharge cycles. Regulatory fire-testing, such as UL 9540A compliance in South Africa, strengthens demand for proven thermal management and container designs, protecting incumbents from low-cost competitors. Services contracts worth 8-12% of capex over 10 years further enrich recurring-revenue models.
By Energy Capacity Range:
Gigawatt-Hour Projects Reshape ScaleThe 100-500 MWh band is the fastest-growing, charting a 29.1% CAGR as utilities choose stand-alone blocks that rival gas peakers on levelized cost. Saudi Arabia’s 1.3 GWh Red Sea project showcases merchant-storage profitability under time-of-use tariffs.
Systems below 10 MWh remain critical for residential, telecom, and small-C&I resilience, but gigawatt-hour ambitions signal consolidation among balance-sheet-strong developers able to manage multi-billion-dollar EPC scopes. African caps at 100 MWh constrain scale-economy gains, maintaining fragmentation in those markets.
By End-User Application:
Utility Segment Dominates GrowthUtilities held a 59.44% market share in 2025 and are expected to grow at a 21.9% CAGR as grid stability mandates proliferate. The Saudi Electricity Company alone procured 10 GWh of capacity for black-start and spinning reserve duties.
Commercial and industrial users are adopting behind-the-meter storage for demand-charge management and outage protection, as exemplified by the 200 MWh installed at South African factories during the 2024 rolling blackouts. Data-center backup standards of 15-minute duration are another growth vector across GCC digital campuses. Residential uptake lags until financing models mature.
Geography Analysis
Saudi Arabia Battery Energy Storage System (BESS) Market
Saudi Arabia’s 23.08% 2025 share of the Middle East and Africa battery energy storage system market leads the region, and a 22.95% CAGR through 2031 is supported by its 48 GWh storage mandate, multi-year framework contracts, and 4-6% cost of capital. The Red Sea standalone facility validated merchant economics under dynamic tariffs.
MEA Battery Energy Storage System (BESS) Market
The United Arab Emirates and Qatar follow, adopting capacity-payment models that uncouple revenue from dispatch. Masdar’s 19 GWh agreement demonstrates national-scale procurement, while Qatar’s standalone 400 MWh tender pioneers merchant storage in the Gulf. Sub-Saharan Africa holds upside: South Africa commissioned 1.2 GWh in 2024 to defer grid upgrades, Kenya’s 120 minigrids illustrate rural viability, and Egypt’s 200 MWh hybrid for Suez industries signals industrial appetite. Yet Nigeria’s tariff reversals and high sovereign spreads stall pipelines, underscoring the Gulf between regulatory certainty in GCC states and policy volatility elsewhere.

Regulatory Landscape
Regulatory frameworks across the Middle East and Africa continue to formalize BESS as grid infrastructure through large-scale state procurement, product compliance rules, and tighter technical qualification criteria. In Saudi Arabia, Saudi Power Procurement Company (SPPC) opened qualification for a 3 GW/12 GWh build-own-operate tender in April 2026 across six projects with four-hour duration, reinforcing long-tenor contracting structures used to underwrite financing. In the UAE, the Ministry of Industry and Advanced Technology (MoIAT) has been implementing conformity assessment requirements for renewable energy products (including cells and batteries) under Cabinet Decision No. (10) of 2020, which raises the compliance bar for imported equipment.
Country-level rules are also tightening around interconnection, controls, and project permitting, which affects EPC scope and vendor eligibility. Dubai Electricity and Water Authority (DEWA) issued a 2026 Energy Storage System Procurement Technical White Paper with stricter requirements for digital substation operating systems, including dual certification expectations, pushing bidders toward certified control, protection, and software stacks. In Egypt, the Cabinet approved amendments in June 2026 to land-use regulations for battery storage projects, improving the pathway to secure licenses for grid-support assets and enabling faster site allocation for utility and hybrid solar-plus-storage developments.
Competitive Landscape
The market is moderately concentrated, with the top five vendors controlling approximately 55% of the 2024 contracted volume. Chinese giants CATL and BYD leverage regional hubs and local-currency terms to undercut Western OEMs by 15-20% on a net-present-value basis. Fluence’s 2.5 GW deal with Saudi Electricity Company demonstrates that long-duration framework contracts can reduce transaction costs, a template that Tesla and Sungrow are replicating in the UAE and Egypt.
Technology differentiation shifts from cells to software; Huawei’s FusionSolar and Schneider’s EcoStruxure deliver AI-based bidding that raises asset returns 10-20%. Modular specialists such as AlphaESS exploit C&I niches where speed trumps scale. Patent activity in solid-state and grid-forming inverters, led by Siemens Energy and ABB, foreshadows the next wave of competitiveness.
Expect further consolidation as developers capable of financing projects exceeding 500 MWh crowd out smaller EPCs. Nonetheless, whitespace persists in off-grid mining and telecom microgrids, segments that demand flexible form factors and rapid deployment.
Middle East And Africa Battery Energy Storage System (BESS) Industry Leaders
-
NGK INSULATORS, LTD.
-
Tesla Inc
-
Huawei Digital Power
-
BYD Co. Ltd.
-
Fluence Energy Inc.
- *Disclaimer: Major Players sorted in no particular order

Middle East And Africa Battery Energy Storage System (BESS) Market Companies Covered in this Report
- Tesla Inc.
- Huawei Digital Power
- Fluence Energy Inc.
- NGK Insulators Ltd.
- BYD Co. Ltd.
- Eaton Corporation plc
- Schneider Electric SE
- Siemens Energy AG
- Sungrow Power Supply Co.
- ABB Ltd.
- Wärtsilä Oyj
- Saft Groupe SA
- Aggreko Ltd.
- Eskom Holdings SOC Ltd.
- Philadelphia Solar Ltd.
- VanadiumCorp Resource Inc.
- Sumitomo Corporation
- Contemporary Amperex Technology (CATL)
- AlphaESS Co. Ltd.
- Desert Technologies (SA)
Read Analysis of Middle East And Africa Battery Energy Storage System (BESS) Companies
Market Opportunities and Future Outlook
Gigascale hybrid solar-plus-storage procurement is creating a visible pipeline for multi-gigawatt-hour BESS deliveries and long-duration operating services in the Gulf. A key proof point is the 5.2 GW/19 GWh round-the-clock solar-plus-storage project in Abu Dhabi, which reached financial close in July 2026 under EWEC/Masdar structures, with BYD and Sungrow selected as BESS suppliers. This scale is widening demand beyond cells and containers into grid-forming inverters, plant controllers, forecasting, and market-bidding software as system operators seek higher renewable penetration without compromising stability.
North Africa and parts of sub-Saharan Africa also show room for faster deployment of BESS tied to permitting improvements, EPC capability build-out, and resilient power needs in weak-grid zones. Egypt has several 2026 execution signals, including a 500 MW/1,000 MWh standalone BESS EPC award at Benban (March 2026) and commissioning activity at solar-plus-storage sites, including a 600 MWh BESS commissioned by AMEA Power in July 2026. In South Africa, large hybrid renewables projects incorporating BESS, such as TotalEnergies Hydra Storage project in Northern Cape with 500 MWh of batteries inaugurated in July 2026, support opportunities in grid services, integration engineering, and long-term O&M for utility and industrial offtakers.
Recent Industry Developments in Middle East And Africa Battery Energy Storage System (BESS) Market
- July 2026: Masdar and EWEC reached financial close for a 5.2 GW/19 GWh round-the-clock solar-plus-storage project in Abu Dhabi, selecting BYD and Sungrow as BESS suppliers. The deal underscores bankable contracting structures for ultra-large hybrid assets and increases competitive pressure on system integration, controls, and long-term service offerings at gigawatt-hour scale.
- September 2025: Saudi Electricity Company secured contracts for two large BESS projects totaling 4.9 GWh. The awards added volume visibility for tier-one integrators and reinforced the use of multi-project contracting to speed procurement and standardize delivery across sites.
- June 2024: Eskom initiated a USD 1.2 billion grid modernization program aimed at improving observability and controllability on the network. The upgrade supports deeper monetization of BESS capabilities (frequency and voltage services) by improving dispatch data and reducing latency that can otherwise dilute storage revenues.
Middle East And Africa Battery Energy Storage System (BESS) Market Report Scope and Research Methodology
Market Definition and Coverage
We define this market as the revenue earned from battery energy storage systems installed across the Middle East and Africa, where the system is used to store electricity and discharge it later for grid or customer use.
Scope exclusions: We exclude standalone power generation equipment and non-battery storage technologies that do not use an electrochemical battery.
Segments Covered in This Report
- By Battery Type
- Lithium-ion (Lithium Iron Phosphate (LFP), Nickel-Manganese-Cobalt (NMC), Lithium Titanate (LTO))
- Lead-acid
- Flow Battery (Vanadium Redox, Zinc-Bromine)
- Sodium-ion
- Other Battery Technologies (NiCd, Hybrid Super-capacitors)
- By Connection Type
- On-Grid (Utility Interconnected)
- Off-Grid (Micro-Grid, Hybrid)
- By Component
- Battery Pack and Racks
- Power Conversion System (PCS)
- Energy Management Software (EMS)
- Balance-of-Plant and Services
- By Energy Capacity Range
- Below 10 MWh
- 10 to 100 MWh
- 100 to 500 MWh
- Above 500 MWh
- By End-user Application
- Utility
- Commercial and Industrial
- Residential
- By Geography
- Saudi Arabia
- United Arab Emirates
- Qatar
- South Africa
- Egypt
- Kenya
- Rest of Middle East and Africa
Data Sources, Market Sizing, and Validation
Desk Research
Desk research was used to set the market boundary and to gather the baseline demand and supply signals that are publicly visible in this space. We relied on sources such as IEA datasets and reports, IRENA renewable capacity statistics, World Bank electricity access and grid indicators, and national energy ministry and regulator publications across key MEA countries. These sources help us anchor storage demand to renewables build-outs, grid reliability needs, and stated policy targets.
To refine the model, we also reviewed company annual reports, investor presentations, reputable press coverage of awarded tenders, and project announcements by utilities and developers. Where it improved consistency, we referenced paid subscriptions for company financials and intelligence, patent databases, and an import-export shipment-level database to sanity check equipment movement and supplier activity. The sources named above are illustrative and not exhaustive, and additional public datasets and documents were also used to collect data, validate assumptions, and clarify open questions.
Primary Interviews and Surveys
Primary work focused on validating what gets deployed in practice and what price and sizing assumptions are realistic for MEA projects. We spoke with utility and developer-side stakeholders, EPC and integrator roles, and commercial and industrial buyers, which helped confirm typical storage durations, commissioning timelines, and the split between on-grid and off-grid use cases. Because project activity is uneven across the region, our outreach was balanced across major MEA hubs and emerging markets so the model did not lean on a single country cycle.
Distribution of primary research fieldwork respondents
| Company type | Respondent position |
|---|---|
| Top tier: 37% | CXOs: 15% |
| Mid tier: 44% | Functional/Unit leaders: 41% |
| Smaller Players: 19% | Managers: 44% |
Market-Sizing & Forecasting
Sizing started with a top-down build where renewable additions and grid flexibility requirements were used to reconstruct the addressable storage demand pool across the Middle East and Africa, then mapped to likely adoption by end-user groups. To keep the totals realistic, we corroborated outputs with selective bottom-up approximations, such as sampled project pipelines, channel checks on shipped system components, and average selling price ranges applied to implied MWh deployments.
Key inputs used in the model included planned and commissioned renewable capacity, typical storage duration used for solar and wind integration (hours), the mix of on-grid versus off-grid projects, energy capacity bands in MWh for awarded systems, and component-level cost direction for items like battery packs and power conversion systems. Where public information was incomplete, gaps were handled through conservative interpolation using nearby project benchmarks and then re-checked through interviews so one-off mega projects did not distort the run rate.
For forecasting, scenario analysis was applied with variables tied to tender calendars, policy timelines, and expected grid investment pacing, followed by a smoothing step so year-to-year swings stayed explainable. Final growth paths were aligned with expert views on how quickly utility procurement, permitting, and local integration capability can scale in MEA.
Data Validation & Update Cycle
We validate the outputs through multiple checks so the final numbers stay consistent with what the market can practically absorb. Totals are compared with independent signals such as publicly announced storage awards, renewable build-out plans, and regional import activity for key system components, and then anomalies are reviewed and corrected before sign-off.
Before publication, assumptions that drive large variance, such as storage duration and price progression, are re-tested through follow-up calls when needed. Reports are refreshed annually, and interim updates are made when major tender rounds, policy shifts, or large project awards materially change the demand outlook. Right before delivery, an analyst performs a fresh pass to ensure clients receive the latest updated view.
Mordor Intelligence's Middle East and Africa Battery Energy Storage System Market Sizing Compared With Other Published Estimates
Published market values can look far apart because each publisher sets a different line between grid-scale systems, behind-the-meter installations, and broader battery supply chains, and then uses its own pricing and timing assumptions. Currency timing, what gets counted as system revenue versus project value, and how quickly price declines are applied can all move the total.
The main gap comes from mixing full project cost and adjacent battery categories into the same total, where Mordor Intelligence counts only battery energy storage system revenues for MEA and then tests the implied MWh by energy-capacity bands against typical storage durations and tender award signals.
Benchmark comparison
| Source | Market Size | Gaps in Research Methodology |
|---|---|---|
| Mordor Intelligence | USD 2.39 B (2025) | |
| Industry Publisher A | USD 3.10 B (2025) | Often presented as a broader energy storage systems figure with looser inclusion rules, and it can assume higher average system pricing without cleanly separating system revenue from EPC and owner cost items. |
| Industry Blog B | USD 16.35 B (2024) | Uses a much wider scope and aggressive scaling assumptions, and the large base-year number suggests that project value, multiple storage technologies, or multi-year pipeline totals may be combined into a single-year market size. |
The spread in the table mostly comes down to scope and pricing treatment, not just growth expectations. When we keep the count to BESS system revenues and re-check it against deployable MWh signals and tender timing, the result stays traceable to clear inputs and repeatable steps.
Key Questions Answered in the Report
What is the current value of the Middle East and Africa battery energy storage system market?
The market was valued at USD 2.85 billion in 2026.
How fast is the sector expected to grow?
A 19.18% CAGR is projected between 2026 and 2031, lifting revenues to USD 6.86 billion.
Which country is the fastest-growing contributor?
Saudi Arabia is set to expand at a 22.95% CAGR through 2031 on the back of its 48 GWh mandate.
Which battery chemistry is gaining traction for long-duration storage?
Flow batteries are accelerating at a 28.25% CAGR due to superior multi-hour economics.
Why are off-grid systems important in sub-Saharan Africa?
They help mines and rural communities bypass unreliable grids while cutting diesel costs below USD 0.10/kWh.
What drives falling storage costs in the region?
Lithium-iron-phosphate prices dipping under USD 100/kWh and sovereign-fund financed mega-tenders.