Market Overview
| Study Period | 2018 - 2031 |
|---|---|
| Forecast Data Period | 2026 - 2031 |
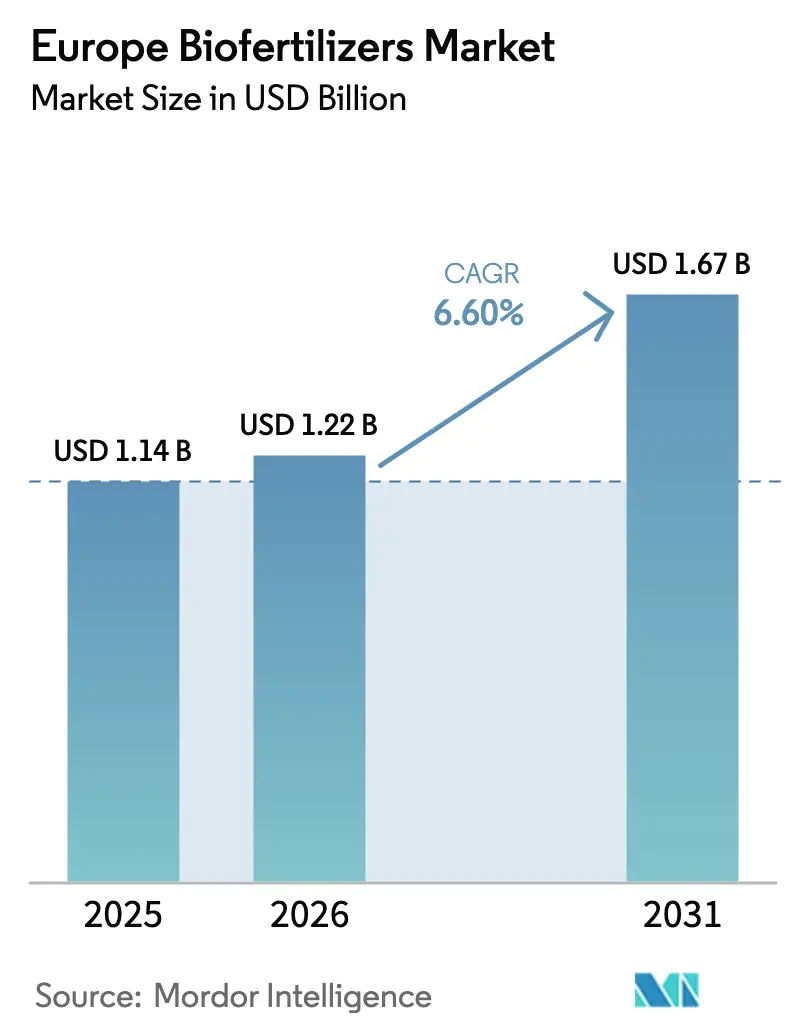
| Base Year Market Size (2025) | USD 1.14 Billion |
| Market Size (2026) | USD 1.22 Billion |
| Market Size (2031) | USD 1.67 Billion |
| Growth Rate (2026 - 2031) | 6.60% CAGR |
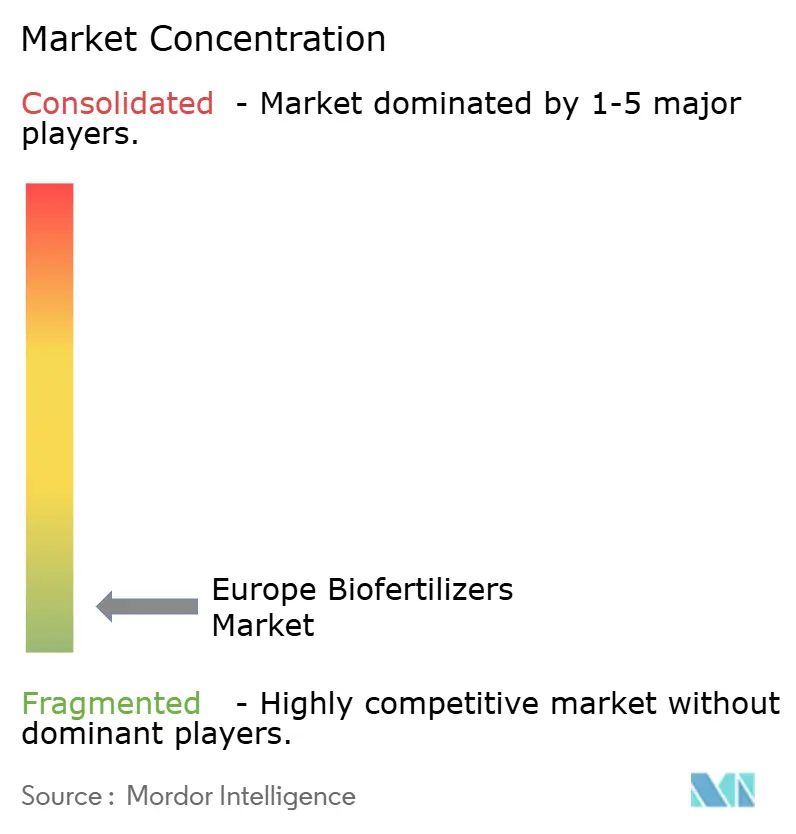
| Market Concentration | Low |
Major Players *Disclaimer: Major Players sorted in no particular order Image © Mordor Intelligence. Reuse requires attribution under CC BY 4.0. | |
Europe Biofertilizers Market Analysis by Mordor Intelligence
The Europe biofertilizer market is expected to grow from USD 1.14 billion in 2025 to USD 1.22 billion in 2026 and is forecast to reach USD 1.67 billion by 2031 at 6.6% CAGR over 2026-2031. Current momentum stems from the EU Farm to Fork mandate that expands organic farmland, rising carbon penalties on synthetic fertilizer use, and growing consumer appetite for premium organic produce. Competitive intensity stays low because the market is highly fragmented and technical know-how varies across member states. Mycorrhizal fungi products dominate today owing to proven phosphorus mobilization, while phosphate-solubilizing bacteria gain traction as climate-aligned solutions. Currency-adjusted subsidies under the Common Agricultural Policy and nascent soil-carbon credit programs further strengthen demand signals.
Key Report Takeaways
- By form, mycorrhizal fungi captured 62.30% of the European biofertilizer market share in 2025, while rhizobium is advancing at a 7.12% CAGR through 2031.
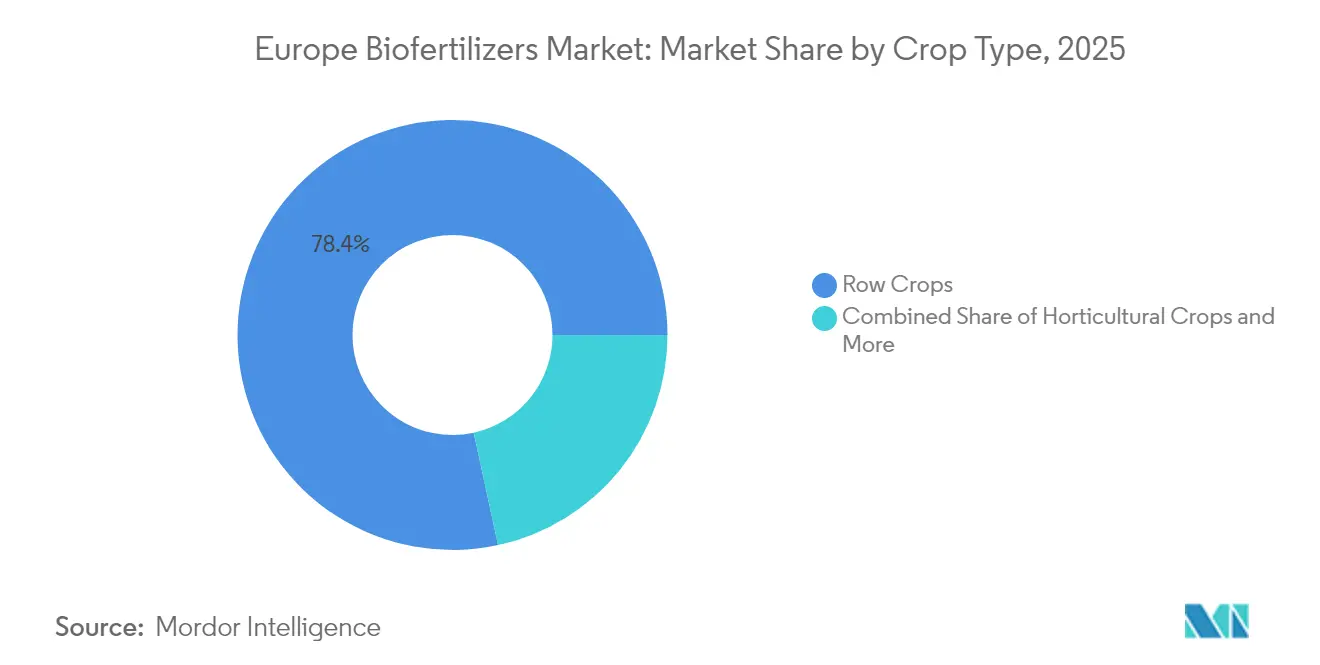
- By crop type, row crops accounted for 78.40% share of the European biofertilizer market size in 2025, while cash crops are projected to expand at a 7.08% CAGR between 2026 and 2031.
- By country, France led with 21.10% revenue share in 2025, and Spain is forecast to grow at a 9.95% CAGR to 2031.
Note: Market size and forecast figures in this report are generated using Mordor Intelligence’s proprietary estimation framework, updated with the latest available data and insights as of January 2026.
Europe Biofertilizers Market Trends and Insights
Drivers Impact Analysis
| Driver | (~) % Impact on CAGR Forecast | Geographic Relevance | Impact Timeline |
|---|---|---|---|
| EU Farm to Fork organic-area mandate | +2.1% | EU-27, the highest weight in Germany, France, and the Netherlands | Medium term (2–4 years) |
| Restrictive EU carbon and nutrient regulations | +1.8% | Northern Europe nitrate-vulnerable zones | Short term (≤2 years) |
| Rising consumer demand for organic produce | +1.5% | Western Europe's core markets are expanding into Central Europe | Long term (≥4 years) |
| CAP eco-scheme subsidies | +1.2% | Mediterranean and Nordic member states | Medium term (2–4 years) |
| Soil-carbon credit monetization via microbes | +0.7% | Pilot regions in France, the Netherlands, and Denmark | Long term (≥4 years) |
| Insect-frass circular-nutrient partnerships | +0.3% | Netherlands, Belgium, and Germany | Medium term (2–4 years) |
| Source: Mordor Intelligence | |||
EU Farm to Fork Organic-Area Mandate
The 25% organic farmland target under Farm to Fork shifts roughly 17 million additional hectares into biological management, an expansion that requires unprecedented volumes of microbial inoculants for nitrogen fixation and phosphorus mobilization. Governments such as Germany and France have embedded the mandate into national strategies, creating clear timelines that shape procurement planning for distributors and cooperatives. Funding streams tied to the mandate cover farmer training, demonstration plots, and outcome verification which together shorten adoption learning curves. Suppliers that bundle agronomy services with input sales gain early loyalty because many growers face steep learning curves after decades of synthetic fertilizer dependence. Market intelligence points to rising pre-season booking of microbial products as growers secure supply in advance of peak spring applications, a pattern that underscores the mandate’s pull effect on the Europe biofertilizer market[1]Source: European Commission, “Farm to Fork Strategy,” ec.europa.eu.
Restrictive EU Carbon and Nutrient Regulations
The nitrate cap of 170 kg N per hectare and emergent carbon fees of USD 26.5–31.8 per ton of CO₂ equivalent are altering farm budget math in real time. Danish and Dutch growers, operating in some of the strictest nitrate-vulnerable zones, now document fertilizer savings of 40–50% since 2019 by leaning on phosphate-solubilizing bacteria that unlock residual phosphorus. Because regulators index carbon fees to the EU Emissions Trading System, cost escalators on synthetic ammonia are widely expected, prompting cereal and rapeseed growers to diversify nutrient sources before penalties bite deeper. Continuous monitoring requirements that tie nitrogen application records to subsidy eligibility further reinforce the switch to low-impact biologicals. These twin policies push microbial suppliers to validate carbon and nutrient efficiency claims through third-party field trials, a move that sharpens competitive differentiation[2]Source: European Environment Agency, “Nitrogen Pollution and Climate Impact,” eea.europa.eu .
Rising Consumer Demand for Organic Produce
Organic food receipts climbed to EUR 55 billion (USD 58.3 billion) in 2024 and continue to post 8.1% annual gains, underpinned by health positioning, residue-free labels, and retailer private-label expansion. Households in Austria, Switzerland, and Denmark dedicate up to 11.3% of food budgets to organic items, a figure that has doubled since 2018. Retailers are now locking in upstream supply through long-term grower contracts that specify microbial input protocols, ensuring traceability that consumer watchdogs increasingly demand. Price premiums of USD 2.1–3.2 per kilogram for fresh produce cushion the extra cost of multiple microbial applications per season, keeping farm operating margins viable. Market surveys reveal that 73% of shoppers accept marginal price hikes if labels guarantee biodiversity and soil-health benefits, reinforcing the business case for biofertilizer programs[3]Source: FiBL, “The World of Organic Agriculture 2024,” fibl.org.
CAP Eco-Scheme Subsidies
The 2023–2027 Common Agricultural Policy allocates EUR 97 billion (USD 102.9 billion) for eco-schemes, and 40% of that pot is tagged for biological inputs, cover crops, and precision nutrient management. Germany reimburses USD 47.7–68.9 per hectare for microbial programs, and France pays USD 37.1–53.0 on legume rotations that use inoculants. Because payments flow annually, growers realize cash benefits within the same fiscal cycle, shrinking payback periods to less than two seasons for most biofertilizer packages. Financial predictability also unlocks bank credit lines for input pre-financing, an important lever for smallholders. Suppliers are tailoring product bundles to match subsidy criteria, a strategy that lowers administrative burden for farmers and accelerates volume scaling across the Europe biofertilizer market.
Restraints Impact Analysis
| Restraint | (~) % Impact on CAGR Forecast | Geographic Relevance | Impact Timeline |
|---|---|---|---|
| Field-performance variability | −1.4% | Continental climate zones within the EU | Short term (≤2 years) |
| Live-culture shelf-life logistics | −0.9% | Eastern Europe, where the cold chain is weak | Medium term (2–4 years) |
| Slow pan-EU strain registration process | −0.7% | All member states under EFSA review | Long term (≥4 years) |
| Channel conflict from rapid consolidation | −0.5% | Western Europe distributor networks | Short term (≤2 years) |
| Source: Mordor Intelligence | |||
Field-Performance Variability
Multisite trials show yield responses ranging 15–40% because microbial survival hinges on pH, texture, and moisture profiles that differ sharply from Mediterranean loams to Nordic clays. In sandy soils of Poland and Hungary, rapid desiccation during summer lowers microbial persistence, creating inconsistent returns for cereal growers. Early spring cold snaps cut mycorrhizal colonization by up to half in Northern France, curbing phosphorus uptake exactly when plants need it. This variability compels farmers to conduct on-farm strip trials, a practice that delays full-field uptake and slows order volumes. Suppliers now co-pack soil test kits and advisory services to build trust; however, service scalability remains a bottleneck.
Live-Culture Shelf-Life Logistics
Viable cell counts drop 90% after seventy-two hours at 25 °C, so uninterrupted cold storage at 2–8 °C is mandatory from factory to farm. Eastern European distribution lacks adequate chill hubs, adding USD 0.16–0.27 per kilogram in freight and storage costs that erode price competitiveness against synthetic fertilizers. Retailers often refuse to hold microbial stocks because rapid turnover strains inventory budgets, pushing suppliers to maintain consignment warehouses. Ambient-stable formulations exist, but yield trade-offs of up to 12% curb their adoption in high-value horticulture. Logistics gaps thereby limit penetration in regions where organic acreage expansion is otherwise fastest.
Segment Analysis
By Form: Dominant Mycorrhizal Base and Quickening Rhizobium Uptake
Mycorrhizal fungi held a commanding 62.30% of Europe biofertilizer market share in 2025, and the segment is anticipated to maintain leadership through 2031 on the back of its proven ability to mobilize phosphorus and strengthen soil structure. Rhizobium, although starting from a smaller base, is projected to post the fastest 7.12% CAGR as CAP eco-scheme payments encourage wider legume rotations that rely on biological nitrogen fixation, cutting synthetic input costs for organic transition farms. Together, these two categories set the pace for expanding Europe biofertilizer market size by meeting both nutrient release and sustainability requirements across member states.
Azospirillum retains a prominent share and is tracking a stable growth path, favored in cereal fields where its growth-promoting traits improve root architecture and nutrient uptake. Bacillus-based and other multi-strain blends account for significant share with a steady growth as specialty vegetable growers look for broad-spectrum solutions. Azotobacter and phosphate-solubilizing bacteria's carbon-sequestration upside positions them for future jumps once soil-credit markets mature. Continuous patent activity across these smaller segments underscores the innovation depth that will gradually broaden Europe biofertilizer market share beyond today’s dominant fungal and rhizobial products.

Note: Segment shares of all individual segments available upon report purchase
Get Detailed Market Forecasts at the Most Granular Levels
Download PDF
By Crop Type: Row Crop Scale and Cash Crop Spark
Row crops such as wheat, maize, and rapeseed captured 78.40% of Europe biofertilizer market share in 2025 because their vast acreage lets even modest per-hectare inoculant rates translate into significant volume. Cash crops chiefly sugar beet and potato represent limited share of current demand, yet they are forecast to expand at a leading 7.08% CAGR through 2031 as their intensive management economics make higher microbial spending worthwhile. This mix of scale in cereals and velocity in specialty roots drives the incremental gains that widen Europe biofertilizer market size each season.
Horticultural crops hold significant demand share and are growing at a robust growth, supported by premium price points in fruit and vegetable markets that can absorb the cost of multiple microbial applications. In Netherlands and Belgium, surveys show 65% of organic vegetable growers rely on mycorrhizal inoculants and 40% add bacterial consortia under controlled irrigation and temperature settings. Cash-driven producers of sugar beet and potato continue to test strain-specific packages that raise sucrose and starch yields, strengthening the case for biofertilizer adoption outside core cereal and horticulture segments. Altogether, the varied crop mix sustains a balanced growth profile and spreads Europe biofertilizer market share gains across both bulk and specialty value chains.
Note: Segment shares of all individual segments available upon report purchase
Get Detailed Market Forecasts at the Most Granular Levels
Download PDF
Geography Analysis
France held 21.10% of Europe biofertilizer market share in 2025. The Europe biofertilizer market size benefited because French organic output reached EUR 13.8 billion (USD 14.6 billion). Farmers receive CAP eco-scheme payments of EUR 45–60 (USD 47.7–63.6) per hectare that offset microbial costs. Long-standing organic wine and dairy sectors create steady demand for mycorrhizal and bacterial inoculants. A dense cold-chain network keeps live cultures viable from factory to farm across all production zones.
Spain is projected to expand at a 9.95% CAGR through 2031, the fastest among major countries. Greenhouse vegetable hubs in Almería and Valencia use controlled irrigation and climate to maximize microbial performance. Italy maintains significant volume as its organic export trade grows and vineyards routinely apply mycorrhizal products. Germany adds steady gains because strict organic standards and extensive public research validate field efficacy.
Rest of Europe spans Eastern members, Nordic farms, and smaller Western states that invest EU structural funds in sustainable upgrades. The Netherlands acts as an innovation hotspot where greenhouse researchers co-develop new formulations with industry partners. Russia supports domestic microbial makers while opening new organic export channels to Asia. The United Kingdom shapes post-Brexit rules that favor low-emission farming and create fresh space for biological suppliers.
Competitive Landscape
The top five suppliers hold only a limited share, illustrating extreme fragmentation. Small regional players dominate due to localized distribution and language-specific advisory services. This setup offers abundant merger targets for larger biological or conventional crop nutrition companies that wish to scale microbe production and marketing.
Technology advantage rests on proprietary strains, delivery matrices, and proof packages documented under local agronomic conditions. Novonesis now leverages combined microbial libraries and shared fermentation lines, which lifts output economics, while Corteva’s recent Symborg purchase strengthens Mediterranean coverage. Lallemand and UPL invest in European R&D to customize formulations for precision farming systems.
Eastern Europe remains a greenfield, as cold chain and training gaps still limit competitive saturation. Strategic partnerships with logistics providers and carbon registry firms create fresh entry angles for newcomers. Intellectual property counts in phosphate-solubilizing bacteria, and shelf life extension climbed sharply in 2024, indicating a pivot toward differentiated value propositions and signaling expansion potential for the European biofertilizer market.
Europe Biofertilizers Industry Leaders
ASB Greenworld
Agronutrition
Bioceres Crop Solutions (Rizobacter Argentina SA)
J.M. Huber Corporation (Biolchim SPA)
AMVAC Chemical Corporation
- *Disclaimer: Major Players sorted in no particular order
Need More Details on Market Players and Competitors?
Download PDF
Recent Industry Developments
- May 2025: Bayer confirmed a multi-year restructuring of its Crop Science division in Germany, consolidating production and R and D on strategic technologies, streamlining Dormagen manufacturing, and planning the divestment or relocation of Frankfurt operations by 2028
- March 2025: Koppert transferred its entire biostimulant and fertilizer portfolio including the Veni, Vidi, Vici and Panoramix brands, to REKA Group, which will assume global production, logistics, research, and regulatory management while Koppert continues distribution through its existing network.
- March 2025: Syngenta acquired Novartis’ repository of natural compounds and genetic strains for agricultural use and agreed to lease the Basel fermentation pilot plant and science laboratories, strengthening its pipeline of next-generation agricultural biologicals and expanding integrated bioengineering capabilities.
Europe Biofertilizers Market Report Scope
Biofertilizers contain living microorganisms that promote plant growth by providing essential nutrients like nitrogen, phosphorus, and other minerals when applied to seeds, plants, or soil.
The European biofertilizers market is segmented by microorganism (rhizobium, azospirillum, azotobacter, phosphate solubilizing bacteria, mycorrhiza, and other biofertilizers), crop type (cash crops, horticultural crops, and row crops), and geography (Germany, United Kingdom, France, Spain, Italy, Russia, and Rest of Europe). The report offers market size and forecasts in terms of value in USD for the above-mentioned segments.
By Form
| Rhizobium |
| Azospirillum |
| Azotobacter |
| Mycorrhiza |
| Phosphate-Solubilizing Bacteria |
| Other Biofertilizer |
By Crop Type
| Row Crops |
| Horticultural Crops |
| Cash Crops |
By Country
| Germany |
| United Kingdom |
| France |
| Spain |
| Russia |
| Italy |
| Netherlands |
| Turkey |
| Rest of Europe |
| By Form | Rhizobium |
| Azospirillum | |
| Azotobacter | |
| Mycorrhiza | |
| Phosphate-Solubilizing Bacteria | |
| Other Biofertilizer | |
| By Crop Type | Row Crops |
| Horticultural Crops | |
| Cash Crops | |
| By Country | Germany |
| United Kingdom | |
| France | |
| Spain | |
| Russia | |
| Italy | |
| Netherlands | |
| Turkey | |
| Rest of Europe |
Need A Different Region or Segment?
Customize Now
Key Questions Answered in the Report
What is the current value of the European biofertilizer market?
The market generated USD 1.22 billion in 2026 and is on track to reach USD 1.67 billion by 2031.
How fast is demand for microbial products growing in Europe?
Revenue is advancing at a 6.60% CAGR, driven by policy pressure, carbon pricing, and organic food consumption.
Which biofertilizer type dominates European sales?
Mycorrhizal fungi products lead with a 62.30% share due to well-documented phosphorus mobilization benefits.
Why are phosphate-solubilizing bacteria important now?
They combine nutrient release with soil carbon gains, aligning perfectly with new EU climate objectives.
Which country offers the highest growth outlook?
Spain is projected to expand usage at an 9.95% CAGR, driven by Mediterranean crop diversification and precision farming incentives.


