Metal IBC Market Size and Share
Market Overview
| Study Period | 2020 - 2031 |
|---|---|
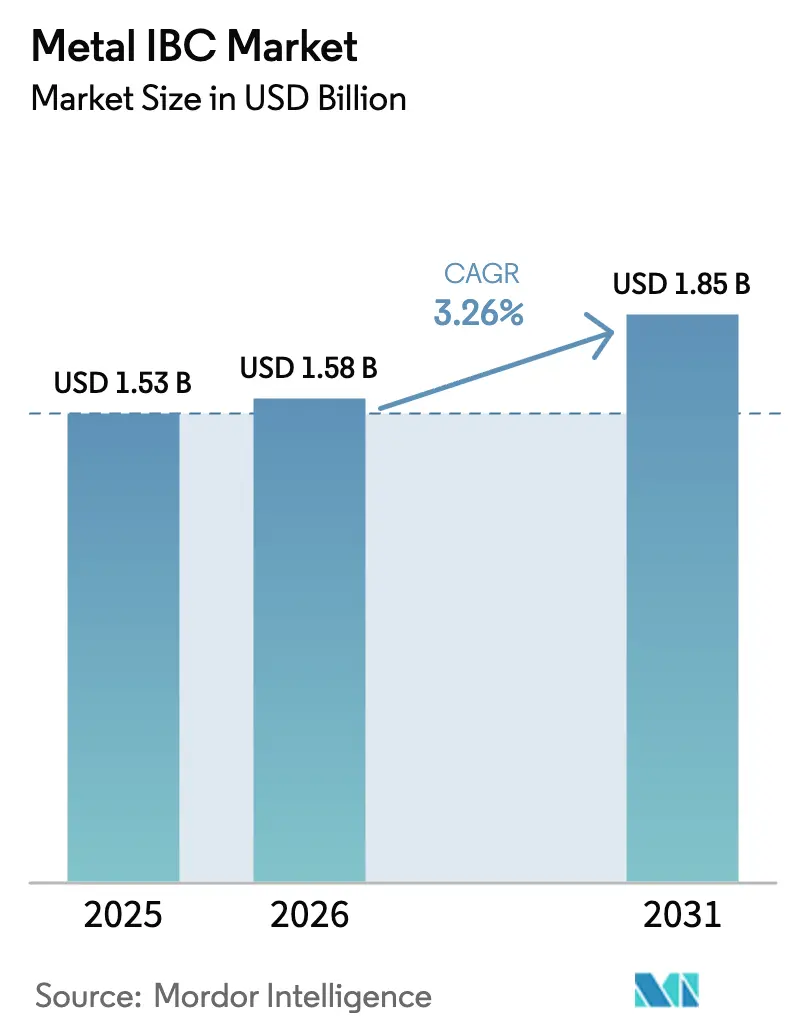
| Market Size (2026) | USD 1.58 Billion |
| Market Size (2031) | USD 1.85 Billion |
| Growth Rate (2026 - 2031) | 3.26% CAGR |
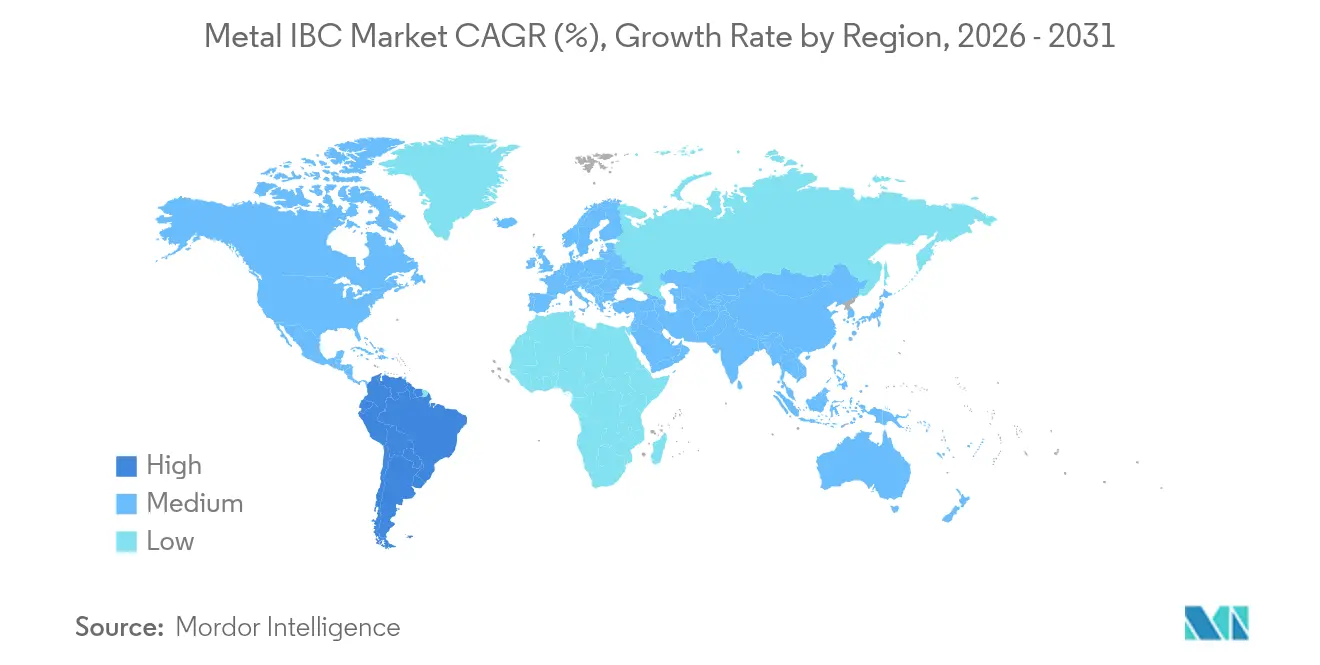
| Fastest Growing Market | South America |
| Largest Market | Asia Pacific |
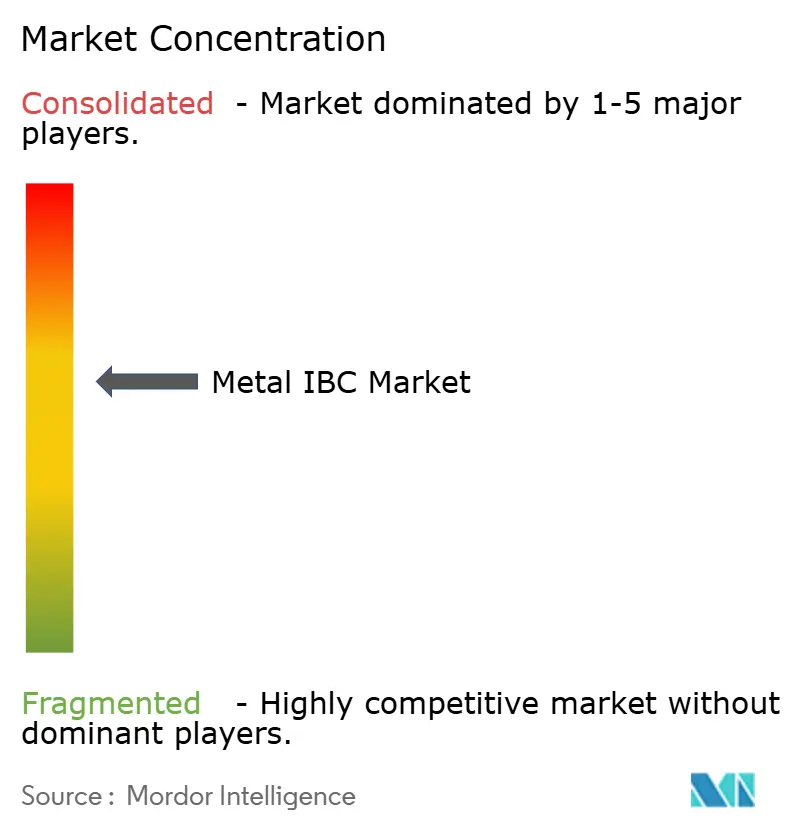
| Market Concentration | Medium |
Major Players *Disclaimer: Major Players sorted in no particular order Image © Mordor Intelligence. Reuse requires attribution under CC BY 4.0. | |
Metal IBC Market Analysis by Mordor Intelligence
The Metal IBC Market size was valued at USD 1.53 billion in 2025 and estimated to grow from USD 1.58 billion in 2026 to reach USD 1.85 billion by 2031, at a CAGR of 3.26% during the forecast period (2026-2031). Current growth rests on regulatory protection for UN31A containers, rising global chemical output, and the widening use of reusable packaging pools. However, pricing volatility in stainless and carbon steel, as well as mounting competition from composite alternatives, hold expansion to a moderate pace. Intensifying technology uptake, especially IoT-enabled asset tracking, is broadening service propositions and cementing long-term customer contracts. Leading producers leverage vertical integration, geographic reach, and compliance expertise to preserve margins while exploring green-hydrogen and battery-material logistics—two emerging niches that align with sustainability priorities.
Key Report Takeaways
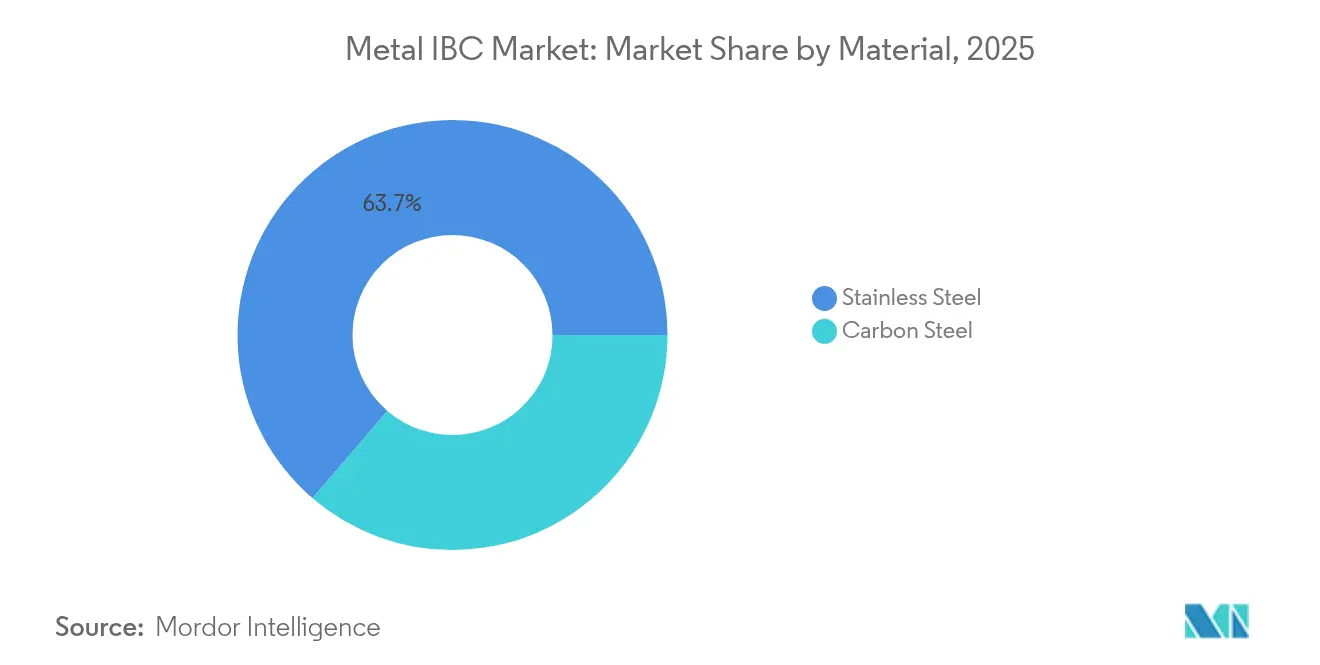
- By material, stainless steel led with 63.72% revenue share in 2025; carbon steel is projected to register the fastest 5.82% CAGR through 2031.
- By capacity, the 1,001-1,500 L segment accounted for 50.84% of the metal IBC market share in 2025, while the up-to-1,000 L tier is set to expand at a 5.41% pace to 2031.
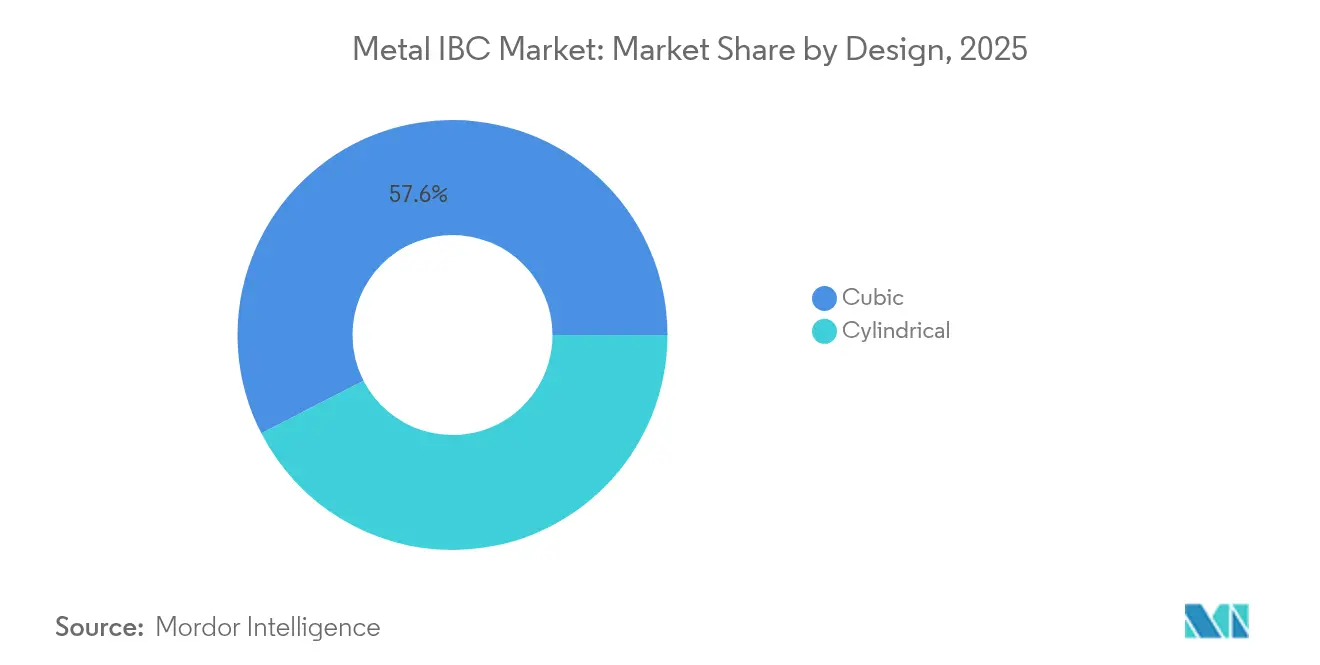
- By design, cubic containers dominated with a 57.56% share in 2025; cylindrical designs are forecast to climb at a 5.92% CAGR.
- By content, liquid applications represented 61.12% of revenue in 2025, and semi-solids will post the fastest 5.61% CAGR to 2031.
- By end-use industry, industrial chemicals commandeda 30.74% share in 2025; food and beverage is poised for 5.12% growth through 2031.
- By geography, Asia-Pacific held 39.18% of revenue in 2025, while South America is on track for the highest 5.02% CAGR to 2031.
Note: Market size and forecast figures in this report are generated using Mordor Intelligence’s proprietary estimation framework, updated with the latest available data and insights as of 2026.
Global Metal IBC Market Trends and Insights
Drivers Impact Analysis*
| Driver | (~) % Impact on CAGR Forecast | Geographic Relevance | Impact Timeline |
|---|---|---|---|
| Expansion of global chemical output | +0.8% | Global, with concentration in Asia-Pacific and North America | Medium term (2-4 years) |
| Stringent UN/DOT regulations favouring UN31A metal IBCs | +0.6% | Global, particularly North America and Europe | Long term (≥ 4 years) |
| Shift from 55-gal drums to reusable IBC pool models | +0.4% | North America and Europe, expanding to Asia-Pacific | Medium term (2-4 years) |
| Hygienic handling demand from F&B exporters | +0.3% | Global, with emphasis on Europe and North America | Short term (≤ 2 years) |
| IoT-enabled fleet tracking and rental platforms | +0.2% | North America and Europe, early adoption in Asia-Pacific | Medium term (2-4 years) |
| Green-hydrogen and battery-material supply chains | +0.1% | Europe, North America, with emerging presence in Asia-Pacific | Long term (≥ 4 years) |
| Source: Mordor Intelligence | |||
Expansion of Global Chemical Output
Steady recovery in the worldwide chemical sector underpins utilisation of stainless and carbon steel containers, with US chemical production expected to climb 1.9% in 2025 amid lower financing costs and higher capital investment. [1]Chemical Processing Editors, “Chemical Industry Outlook 2025: Gradual Momentum Builds,” chemicalprocessing.com Asia-Pacific continues leading capacity additions, while shale-gas advantages help North American producers maintain cost competitiveness. Heightened focus on sustainability encourages the use of durable, reusable packaging, which positions the metal IBC market for consistent demand in specialty and hazardous chemicals. Regional production disparities also yield cross-border flows that rely on UN-certified metal containers for compliant transport.
Stringent UN/DOT Regulations Favouring UN31A Metal IBCs
Updated ADR 2025 provisions and PHMSA harmonisation amendments reinforce the compliance edge enjoyed by metal IBCs, locking in replacement cycles for testing and recertification. [2]UNECE, “ADR 2025,” unece.org Stainless variants satisfy leak-proofness requirements at elevated internal pressures, shielding suppliers from low-cost composite entrants in hazardous material applications. International convergence of standards further broadens the addressable market for certified designs.
Shift from 55-gal Drums to Reusable IBC Pool Models
Cost-to-serve optimisation is prompting shippers to migrate away from single-trip drums toward shared pools that improve truckload utilisation and lower waste. Metal containers, capable of thirty-year service lives, strengthen the total cost of ownership case when coupled with rental or tracking platforms. Asia-Pacific’s returnable transport packaging sector is forecast to add USD 1.40 billion in value between 2023-2028, validating a durable growth runway.
Hygienic Handling Demand from F&B Exporters
Stricter EU and US food-safety rules entering effect in 2025 boost demand for easy-clean stainless IBCs able to preserve product integrity during long-haul exports. Rapid sanitisation, resistance to flavour migration, and compatibility with automated wash stations make metal designs the container of choice for edible oils and high-viscosity ingredients.
Restraints Impact Analysis*
| Restraint | (~) % Impact on CAGR Forecast | Geographic Relevance | Impact Timeline |
|---|---|---|---|
| Volatility in stainless and carbon-steel prices | -0.7% | Global, with acute impact in Asia-Pacific and North America | Short term (≤ 2 years) |
| Intensifying competition from composite/plastic IBCs | -0.5% | Global, particularly in non-hazardous applications | Medium term (2-4 years) |
| High upfront ownership cost vs. drums | -0.3% | Global, with emphasis on emerging markets and price-sensitive segments | Medium term (2-4 years) |
| Stainless-steel scrap tightness affects refurb economics | -0.2% | North America and Europe, with a secondary impact in Asia-Pacific | Long term (≥ 4 years) |
| Source: Mordor Intelligence | |||
Volatility in Stainless and Carbon-Steel Prices
Raw-material expenses absorb a sizeable share of unit cost and are particularly sensitive to nickel price swings. Q1 2025 spot stainless prices climbed despite an oversupplied market, compressing producer margins. Trade policy uncertainty and the steel sector’s green-transition capex add further unpredictability to sourcing strategies.
Intensifying Competition from Composite/Plastic IBCs
Light-weight plastic designs continue to erode their share in non-hazardous segments on the back of lower purchase costs and transport savings. Advanced barrier coatings bolster chemical compatibility, shrinking the performance gap in select uses. Recycling hurdles, however, hinder plastics’ circular-economy credentials relative to infinitely recyclable metal.
*Our forecasts treat driver/restraint impacts as directional, not additive. The impact forecasts reflect baseline growth, mix effects, and variable interactions.
Segment Analysis
By Material: Stainless Steel Dominance Meets Carbon Steel Acceleration
Stainless grades captured 63.72% of 2025 revenue, illustrating their unrivalled chemical resistance in pharmaceutical, food, and high-purity applications. Carbon steel’s faster 5.82% CAGR mirrors buyer efforts to contain capex amid elevated alloy surcharges. Stainless steel’s longer-than-30-year lifespan offsets higher upfront outlay, while recycled-content initiatives are likely to compress the stainless premium over time. Supply chain volatility should continue pushing dual-sourcing strategies that include carbon steel options for less corrosive contents. The metal IBC market size for stainless containers is expected to remain the largest by value throughout the outlook, ensuring consistent procurement volumes and after-sales inspection revenues. Carbon steel adoption is pronounced in emerging economies where cost takes precedence over longevity, and where regulations allow its use for moderate-hazard liquids.
Broader environmental policy is reshaping alloy selection. European carbon-pricing rules and producer carbon-neutrality pledges are nudging manufacturers to increase recycled input, thereby improving cradle-to-gate emissions. That trend could reinforce stainless leadership in export-oriented sectors that must document Scope 3 impacts. Simultaneously, carbon-steel fabricators are improving protective coatings to prolong service life, narrowing the life-cycle-cost gap. As a result, both grades will coexist, with stainless occupying compliance-critical niches and carbon steel widening price-sensitive coverage within the metal IBC market.


By Capacity: Mid-Range Efficiency Balances Small-Format Growth
Containers between 1,001 and 1,500 L controlled 50.84% of 2025 sales, reflecting their fit with standard transport pallets and pallet-wide forklifts that dominate global warehousing. These dimensions allow three-high stacking while maximising trailer cube utilisation, reducing freight cost per litre. In contrast, sub-1,000 L units will log the quickest 5.41% CAGR as omnichannel supply chains pursue right-sizing to cut inventory buffers. The metal IBC market size for up-to-1,000 L containers is therefore set to expand decisively in e-commerce-driven sectors, especially specialty chemicals and flavourings.
Automation is a hidden influencer of capacity choice. Robotic depalletisers and AGVs favour uniform footprints, and mid-range vessels best match legacy systems. Smaller vessels offer greater flexibility in modular production lines that require rapid batch changes, notably in nutraceuticals and personal care. Above-1,500 L models will defend a niche in bulk petrochemical and base-oil moves, where pumpability and decant speed trump cube efficiency. Suppliers are exploring telescopic liners and dual-compartment designs to stretch the utility of each size bracket within the metal IBC market.
By Design: Cubic Practicality Versus Cylindrical Innovation
Cubic shells retained a 57.56% share in 2025, chiefly due to their ability to interlock on pallets and exploit warehouse racking volumes. Their flat panels simplify maintenance and labelling, further supporting uptake. Cylindrical formats, however, are on track for a 5.92% CAGR because their inherently stronger geometry accommodates internal pressures linked to exothermic reactions, gas build-up, or vacuum transfers. Indeed, the metal IBC market is seeing more requests for vessel pressurisation up to 1.5 bar, a threshold better served by circular walls.
Process-integrated mixing is another criterion tilting specialised demand toward cylindrical builds; agitator shafts can be centrally mounted with minimal vortex. Manufacturers continue refining orbital welding and automated seam testing to boost production yields for curved shells, helping narrow cost differentials with squared builds. For shippers concerned predominantly with cubic efficiency—such as lubricants and adhesives—the cubic format will remain the go-to choice, while battery precursor handling and high-value pharma intermediates may spur new cylindrical deployments.
By Content: Liquid Leadership With Semi-Solid Opportunities
Liquids represented 61.12% of 2025 revenue thanks to the sizeable flow of industrial chemicals, fuels, and edible oils transported globally. These uses hinge on metal IBC leak resistance and regulatory approvals that plastics sometimes lack. The metal IBC market share for liquids is expected to stay above 60% through 2031, underlining the container’s core purpose. Semi-solids show the swiftest 5.61% CAGR as continuous manufacturing in pharma and specialty chemicals demands cleaner, enclosed handling of slurries and paste-like inputs.
Powder-to-tablet factories, for instance, need rigid vessels that withstand vacuum dosing without panel collapse. Metal’s antistatic properties also mitigate ignition risk. Solid granules will keep a modest slice of sales, primarily in abrasive media and resins, where the durability of steel staves off wear. Future innovation around hybrid valve plates may allow the same shell to toggle between liquid and semi-solid duty cycles, enhancing asset utilisation across seasonal demand in the metal IBC market.
By End-use Industry: Chemical Dominance Amid F&B Acceleration
Industrial chemicals accounted for 30.74% of 2025 turnover, anchored by high regulatory hurdles and the shift to specialty formulations requiring inert storage. Nonetheless, food and beverage is the fastest-moving vertical at 5.12% CAGR, benefitting from traceability mandates and the rising export of plant-based oils, concentrates, and flavourings. For domestic food processors, metal containers unlock closed-loop cleaning regimes that align with hazard-analysis plans.
Petroleum and lubricant blenders leverage cubic tanks to meet just-in-time blending routines while trimming drum scrap. Paints and dyes maintain stable consumption, although VOC regulations are nudging manufacturers toward higher-solids formulations that may favour semi-solid handling. The pharmaceutical sector values stainless IBCs for API and excipient management, with automated wash-in-place adding to validation efficiency. Construction chemicals are a final adopter cohort, driven by new cement-admixture and waterproofing demand in infrastructure upgrades. Every vertical’s interplay sustains a broad application base that protects the metal IBC market against cyclical shocks.
Geography Analysis
Asia-Pacific generated 39.18% of 2025 revenue, sustained by large-scale petrochemical complexes in China and the rapid build-out of pharmaceutical and specialty-chemical capacity in India. Expanded transport-packaging law enforcement and rising labour costs promote durable containers that cut handling cycles, underpinning regional preference for stainless designs. Major suppliers continue localising weld-line technology, as evidenced by Mauser Packaging’s Haiyan facility upgrade to metal IBC production. Regional policy pushes for lower packaging waste dovetail with reusable steel models, reinforcing future uptake.
North America and Europe collectively anchor high-value demand through entrenched chemical clusters and strict DOT/ADR adherence, together accounting for more than one-third of global sales. Ongoing PHMSA harmonisation and ADR 2025 implementation reward trusted designs and favour incumbent producers. Producers here increasingly differentiate on service—closed-loop rental, asset telemetry, and compliance documentation—rather than on shell fabrication alone. The regions’ twin focus on net-zero goals and downstream traceability elevates the standing of steel’s recyclability advantage relative to plastic IBCs.
South America is on course to deliver a 5.02% CAGR to 2031, led by Brazilian petrochemical expansions and mining-chemical flows. Regional petrochem and agrochemical verticals require hazardous-goods certified packaging, positioning metal forms at the forefront as regulations tighten. Middle East and Africa remain small in value but register point-to-point spikes driven by refinery turnarounds and energy diversification programmes. Long-haul exports of high-purity chemicals to Europe invariably call for UN31A compliance, boosting demand for cubic and cylindrical formats in these emerging territories.

Competitive Landscape
The supplier base tilts toward moderate fragmentation. The top five manufacturers command just over 55% of installed capacity, allowing for healthy rivalry while affording scale economies in steel purchasing and inspection services. Greif, Thielmann, and Mauser Packaging combine multi-region factories with cradle-to-grave fleet services that deepen customer retention. Greif’s USD 1.8 billion divestiture of containerboard centres signifies its pivot to higher-margin industrial packaging, freeing balance-sheet capacity for targeted IBC acquisitions. [4]Greif Investor Relations, “Agreement to Sell Containerboard,” investor.greif.com
Technology infusion is reshaping differentiation. IoT sensor integration and SaaS fleet portals are becoming table stakes, with early adopters recording double-digit drops in lost-container write-offs. Patent activity around liquid-level gauges underscores a convergence between metal fabrication and electronics assembly. Regional capacity builds—such as Thielmann’s North American service hubs—support quicker recertification cycles and lower freight costs for returned tanks.
M&A strategy revolves around adjacent chemicals packaging and reconditioning assets, enabling closed-loop offerings that meet scope-3 emission disclosures demanded by top buyers. New entrants focusing on hydrogen supply and battery precursors are partnering with established welders to fast-track compliance certifications. Competitive intensity remains highest in cubic stainless units, whereas cylindrical pressure-rated segments see fewer qualified suppliers, creating an above-average margin pocket within the metal IBC market.
Metal IBC Industry Leaders
Thielmann IBC GmbH
Greif Inc.
Sharpsville Container Corp.
Precision IBC Inc.
Automationstechnik GmbH
- *Disclaimer: Major Players sorted in no particular order

Recent Industry Developments
- July 2025: Greif Inc. agreed to sell its containerboard unit for USD 1.8 billion, sharpening its focus on industrial packaging core lines.
- March 2025: Lubrizol introduced PV1710 additives ahead of GF-7, potentially raising metal container demand for higher-performance lubricants.
- February 2025: Quaker Houghton completed a triple acquisition of Dipsol Chemicals, Natech, and Chemical Solutions and Innovations, broadening its metalworking-fluids reach.
- January 2025: Mauser Packaging Solutions brought metal IBC fabrication online at Haiyan, China, strengthening Asia-Pacific supply chain responsiveness.
- January 2025: ADR 2025 amendments took effect, tightening construction and testing rules for dangerous-goods containers.
- September 2024: Iveda filed a patent for LevelNOW, an IoT sensor enhancing bulk-liquid monitoring in IBC fleets.


Global Metal IBC Market Report Scope
An intermediate bulk container (or IBC) is a pallet-mounted, industrial-grade reusable container used for storing and transporting bulk liquids. The research also examines underlying growth influencers and significant industry vendors, all of which help to support market estimates and growth rates throughout the anticipated period. The market estimates and projections are based on the base year factors and arrived at top-down and bottom-up approaches.
The metal IBC market is segmented by material (Stainless Steel and Carbon Steel), by capacity (Up to 1,000 Liters, Between 1,001 to 1,500 Liters and More Than 1,500 Liters), by end-use industry (Industrial Chemicals, Food & Beverage, Petroleum & Lubricants, Pharmaceuticals, Building & Construction and Other End-Use Industries), and by geography (North America, Europe, Asia Pacific, South America and Middle East and Africa), The market sizing and forecasts are provided in terms of value (USD) for all the above segments.
| Stainless Steel |
| Carbon Steel |
| Up to 1 000 L |
| 1 001–1 500 L |
| Above 1 500 L |
| Cubic |
| Cylindrical |
| Liquids |
| Semi-Solids |
| Solids |
| Industrial Chemicals |
| Food and Beverage |
| Petroleum and Lubricants |
| Pharmaceuticals |
| Paints, Inks, and Dyes |
| Building and Construction |
| Other End-use Industries |
| North America | United States | |
| Canada | ||
| Mexico | ||
| South America | Brazil | |
| Argentina | ||
| Chile | ||
| Rest of South America | ||
| Europe | Germany | |
| United Kingdom | ||
| France | ||
| Italy | ||
| Spain | ||
| Russia | ||
| Rest of Europe | ||
| Asia-Pacific | China | |
| India | ||
| Japan | ||
| South Korea | ||
| Singapore | ||
| Malaysia | ||
| Australia | ||
| Rest of Asia-Pacific | ||
| Middle East and Africa | Middle East | United Arab Emirates |
| Saudi Arabia | ||
| Turkey | ||
| Rest of Middle East | ||
| Africa | South Africa | |
| Nigeria | ||
| Rest of Africa | ||
| By Material | Stainless Steel | ||
| Carbon Steel | |||
| By Capacity | Up to 1 000 L | ||
| 1 001–1 500 L | |||
| Above 1 500 L | |||
| By Design | Cubic | ||
| Cylindrical | |||
| By Content | Liquids | ||
| Semi-Solids | |||
| Solids | |||
| By End-use Industry | Industrial Chemicals | ||
| Food and Beverage | |||
| Petroleum and Lubricants | |||
| Pharmaceuticals | |||
| Paints, Inks, and Dyes | |||
| Building and Construction | |||
| Other End-use Industries | |||
| By Geography | North America | United States | |
| Canada | |||
| Mexico | |||
| South America | Brazil | ||
| Argentina | |||
| Chile | |||
| Rest of South America | |||
| Europe | Germany | ||
| United Kingdom | |||
| France | |||
| Italy | |||
| Spain | |||
| Russia | |||
| Rest of Europe | |||
| Asia-Pacific | China | ||
| India | |||
| Japan | |||
| South Korea | |||
| Singapore | |||
| Malaysia | |||
| Australia | |||
| Rest of Asia-Pacific | |||
| Middle East and Africa | Middle East | United Arab Emirates | |
| Saudi Arabia | |||
| Turkey | |||
| Rest of Middle East | |||
| Africa | South Africa | ||
| Nigeria | |||
| Rest of Africa | |||


Key Questions Answered in the Report
What is the current value of the metal IBC market?
The metal IBC market is valued at USD 1.58 billion in 2026 with a forecast to reach USD 1.85 billion by 2031.
Which region holds the largest metal IBC market share?
Asia-Pacific leads with 39.18% of global revenue, thanks to its expansive chemical and manufacturing base.
Which end-use industry is growing fastest for metal IBCs?
The food and beverage sector is projected to grow at 5.12% CAGR through 2031, driven by stricter hygiene and traceability rules.
How are metal IBC suppliers integrating technology?
Leading manufacturers are embedding IoT sensors and data portals to provide real-time tracking, predictive maintenance and rental billing accuracy.
What material dominates the metal IBC industry?
Stainless steel commands 63.72% of revenue because of its superior chemical resistance and long service life.
Why is steel price volatility a restraint for the metal IBC market?
Fluctuating stainless and carbon-steel costs affect manufacturing margins and complicate procurement planning, reducing near-term profitability for producers.
Page last updated on:


