
Medical Device Connectivity Market Size and Share
Market Overview
| Study Period | 2020 - 2031 |
|---|---|
| Market Size (2026) | USD 4.81 Billion |
| Market Size (2031) | USD 13.51 Billion |
| Growth Rate (2026 - 2031) | 22.95 % |
| Fastest Growing Market | Europe |
| Largest Market | North America |
| Market Concentration | Medium |
Major Players *Disclaimer: Major Players sorted in no particular order Image © Mordor Intelligence. Reuse requires attribution under CC BY 4.0. | |
Medical Device Connectivity Market Analysis by Mordor Intelligence
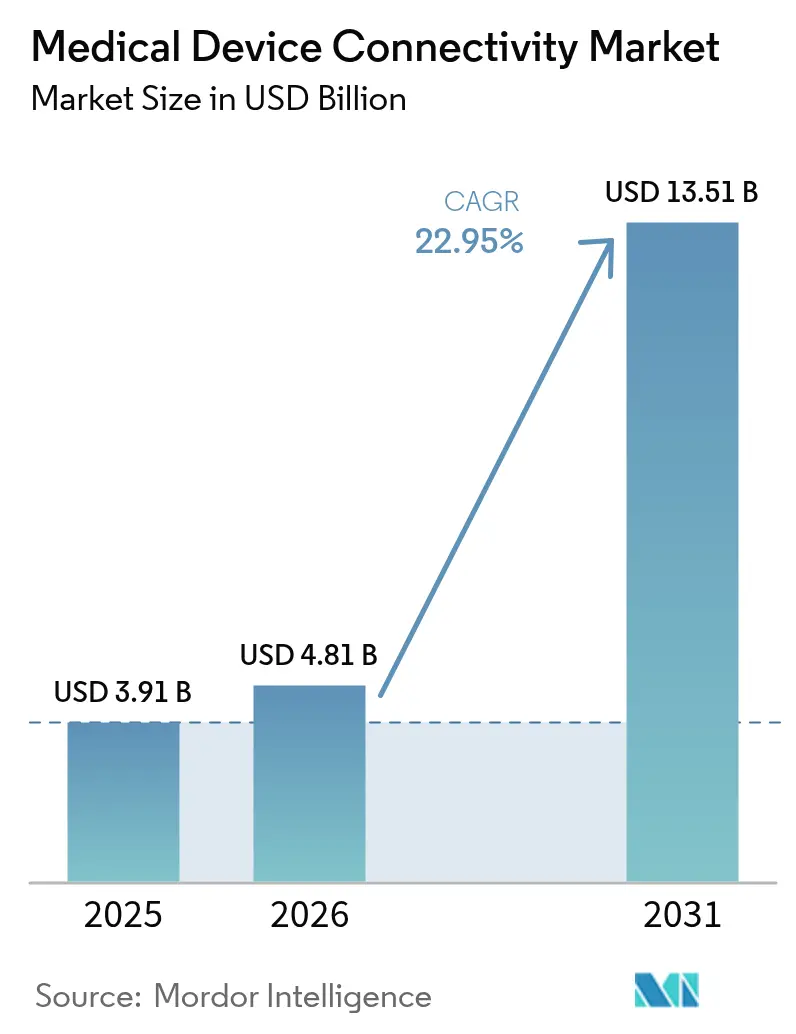
The global medical device connectivity market size was valued at USD 3.91 billion in 2025 and estimated to grow from USD 4.81 billion in 2026 to reach USD 13.51 billion by 2031, at a CAGR of 22.95% during the forecast period (2026-2031). Rapid digitization of healthcare, mounting clinician workload, and the move to value-based reimbursement are driving demand for seamless device-to-system data exchange. Healthcare providers are replacing proprietary protocols with open standards to ease information blocking penalties and reduce documentation time. Rising specialist shortages are expanding Tele-ICU programs, while continuous monitoring across acute, ambulatory, and home settings is lowering readmissions and improving care coordination. Investments in secure connectivity architectures are accelerating as regulators tighten cybersecurity oversight and 6G research promises ultra-reliable, low-latency wireless links for critical care applications.
Key Report Takeaways
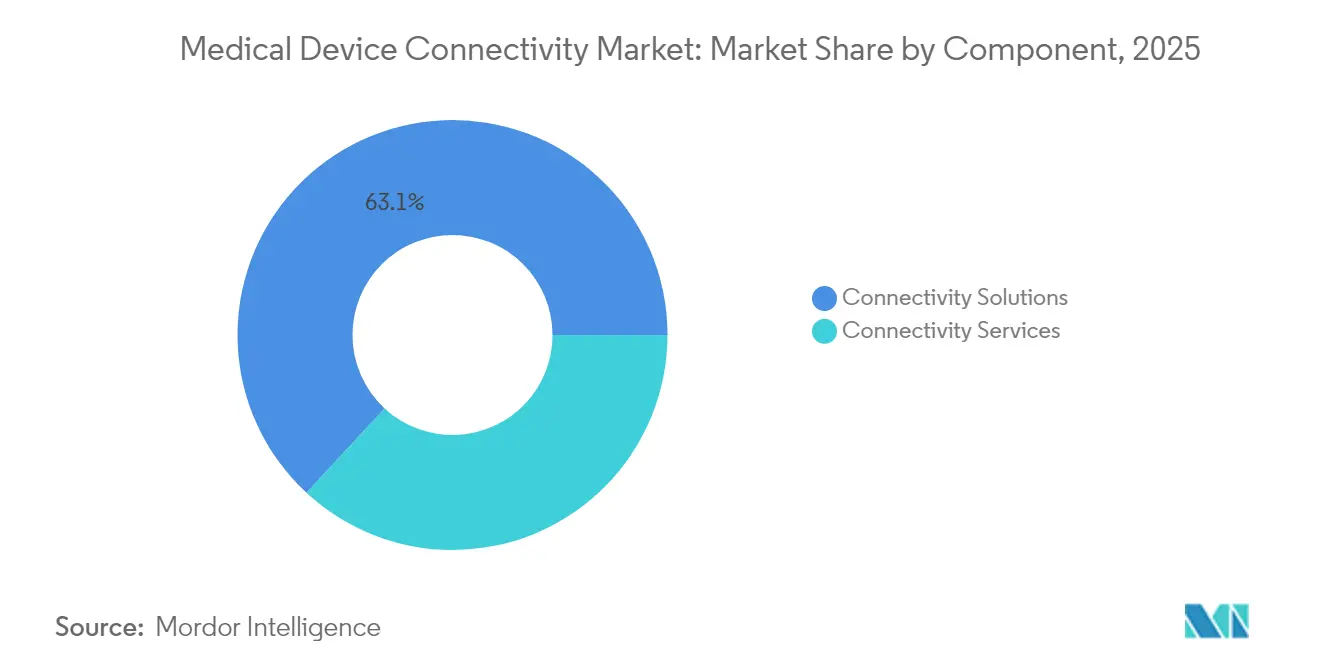
- By component, connectivity solutions led with 63.12% of the medical device connectivity market share in 2025; connectivity services are projected to advance at a 25.30% CAGR through 2031.
- By technology, wired interfaces held 57.35% of the medical device connectivity market size in 2025, while wireless technologies are expected to grow 24.95% annually to 2031.
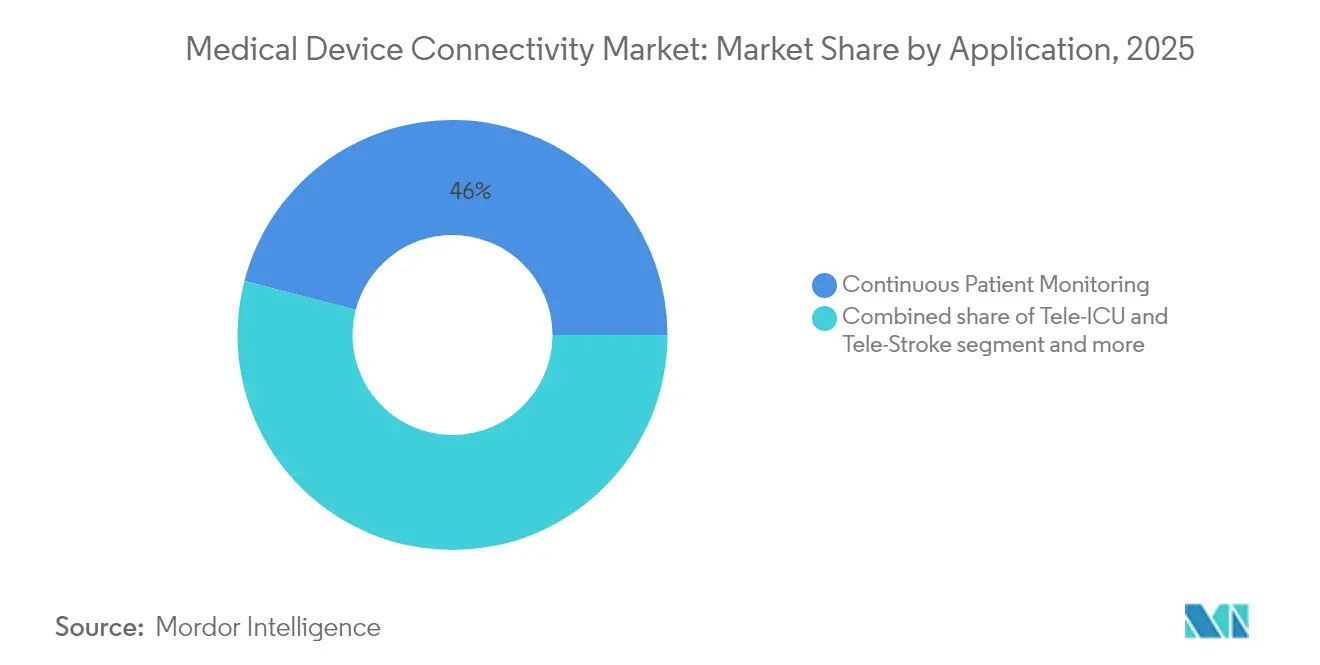
- By application, continuous patient monitoring accounted for 45.95% of the medical device connectivity market size in 2025; Tele-ICU & Tele-Stroke applications are forecast at a 26.40% CAGR.
- By end-user, hospitals & clinics commanded 66.70% of the medical device connectivity market share in 2025, whereas home healthcare is poised for 27.10% CAGR growth.
- By geography, North America led with 38.10% of revenue in 2025; Asia Pacific is set to expand at 25.90% CAGR between 2026-2031.
Note: Market size and forecast figures in this report are generated using Mordor Intelligence’s proprietary estimation framework, updated with the latest available data and insights as of 2026.
Market Trends and Insights
Drivers Impact Analysis of Medical Device Connectivity Market*
| Driver | (~) % Impact on CAGR Forecast | Geographic Relevance | Impact Timeline |
|---|---|---|---|
| EMR interoperability mandates and digital-health policies | +5.9% | North America, Europe | Medium term (2-4 years) |
| Outcome-based reimbursement demanding real-time data | +5.2% | North America, Europe, emerging APAC | Medium term (2-4 years) |
| Expansion of remote and home-based chronic-care monitoring | +4.3% | Global | Short term (≤ 2 years) |
| Convergence of IoT cybersecurity frameworks | +3.6% | North America, Europe | Medium term (2-4 years) |
| Proliferation of multi-parameter wearable & implantable devices | +2.8% | North America, APAC | Short term (≤ 2 years) |
| Cloud-native analytics enabling predictive clinical insights | +2.4% | North America, Europe | Medium term (2-4 years) |
| Source: Mordor Intelligence | |||
EMR interoperability mandates and digital-health policies
Standardized APIs mandated by the 21st Century Cures Act are forcing a shift from proprietary protocols to FHIR-based exchanges. Health systems completing compliance programs have cut documentation time by 13% and improved care coordination, encouraging broader deployment of connectivity engines. Device makers now design interoperability[1]Office of the National Coordinator for Health IT, “Interoperability,” healthit.gov into new products to avoid costly retrofit cycles and to accelerate FDA clearance processes that increasingly weigh connectivity safeguards.
Outcome-based reimbursement demanding real-time data
CMS alternative payment models link revenue to clinical outcomes, pushing hospitals to instrument beds with continuous monitoring and edge analytics that flag patient deterioration early. Health systems using connected RPM platforms have reported 24% lower readmissions for heart failure, aligning financial and quality incentives. This business case is strongest in intensive care units, stroke wards, and oncology infusion centers[2]Centers for Medicare & Medicaid Services, “CMS Interoperability and Patient Access Final Rule,” cms.gov, where preventable adverse events carry steep penalties.
Convergence of IoT cybersecurity frameworks
The FDA’s 2024 cybersecurity guidance[3]U.S. Food and Drug Administration, “Cybersecurity,” fda.gov aligns medical devices with the NIST framework, lowering integration complexity by harmonizing encryption, authentication, and patch management practices. Hospitals deploying these norms report 37% fewer security-related incidents and 42% faster onboarding of new wireless monitors, accelerating refresh cycles for legacy fleets.
Cloud-native analytics enabling predictive clinical insights
Embedding analytics within connectivity gateways converts raw waveform data into predictive scores at the bedside. Intensive care units using cloud inference engines capture early signs of sepsis or respiratory decline, giving clinicians an additional 4-hour window to intervene. Hospitals note that prior to these upgrades, 97% of device data was archived unused; repurposing it now supports early warning systems and population-level benchmarking.
Restraints Impact Analysis of Medical Device Connectivity Market*
| Restraint | (~) % Impact on CAGR Forecast | Geographic Relevance | Impact Timeline |
|---|---|---|---|
| Heterogeneous legacy device fleets without data standards | -5.9% | North America, Europe | Medium term (2-4 years) |
| High upfront integration and interface-engine costs | -4.7% | Global, emerging markets | Short term (≤ 2 years) |
| Persistent cybersecurity and patient-privacy vulnerabilities | -4.3% | Global | Medium term (2-4 years) |
| Limited workflow alignment causing clinician resistance | -3.6% | North America, Europe | Short term (≤ 2 years) |
| Source: Mordor Intelligence | |||
Heterogeneous legacy device fleets without data standards
Hospitals often operate infusion pumps, ventilators, and monitors with life cycles exceeding eight years, many of which lack patchable operating systems. Interface engines must translate vendor-specific protocols, increasing project timelines and demanding continuous maintenance. Isolation networks protect vulnerable endpoints, yet duplicative wiring adds cost and complexity to expansion projects.
High upfront integration and interface-engine costs
Comprehensive connectivity deployments require hardware routers, cabling, middleware licences, and months of workflow mapping. Rural hospitals face tighter capital budgets and limited biomedical IT staff, prompting outsized reliance on managed-service vendors. This cost burden delays adoption despite proven clinical benefits.
*Our forecasts treat driver/restraint impacts as directional, not additive. The impact forecasts reflect baseline growth, mix effects, and variable interactions.
Medical Device Connectivity Market Segment Analysis
By Component:
Interface platforms underpin end-to-end integrationConnectivity solutions held 63.12% of 2025 revenue, establishing them as the backbone for normalizing heterogeneous device data and enforcing rapidly evolving interoperability rules. These platforms translate HL7v2, FHIR, and proprietary streams into EHR-ready payloads that feed clinical decision support engines. Vendor neutral gateways such as Mirth Connect provide open-source flexibility, while enterprise suites bundle device libraries, alarm management, and analytics modules. Health systems deploy redundant server clusters to maintain near-zero downtime for high-acuity wards. As refresh cycles accelerate, the medical device connectivity market increasingly favors solutions offering out-of-the-box adapters for infusion pumps, anesthesia machines, and wireless telemetry packs.
Connectivity services are forecast to grow 25.30% annually as hospitals outsource implementation, maintenance, and cybersecurity patching. Managed-service contracts guarantee uptime, shield providers from staffing shortages, and ensure compliance documentation stays current. Small and mid-size facilities choose subscription models that convert capital expenditure into predictable operating costs. Service firms bundle interface tuning, 24 × 7 monitoring, and change-control governance across multi-vendor estates. This trend positions the services sub-segment as a key revenue accelerator within the broader medical device connectivity market.



By Technology:
Wireless momentum closes the gap with entrenched wired linesWired links represented 57.35% of 2025 sales, anchored by shielded Ethernet backbones in critical care and surgical suites. Real-time waveform fidelity and known latency profiles keep hard-wired networks indispensable for high-bandwidth, life-support devices. Replacement cycles are slow because rewiring operating theatres disrupts clinical throughput and requires rigorous validation. Even so, hospitals upgrading core switches to support power-over-Ethernet enable future device classes without additional outlets, extending the relevance of wired infrastructure within the medical device connectivity market.
Wireless technologies are expected to rise 24.95% CAGR on the back of 5G upgrades and forthcoming 6G research that promises sub-millisecond latency. Access point density is increasing in general wards to support telemetry belts, wearable ECG patches, and smart beds transmitting posture and falls data. Wi-Fi 6E deployments carve new spectrum free of legacy interference, while private 5G slices offer deterministic quality of service for mobile CT scanners and rapid response carts. Hospitals report smoother patient transfers when IV pumps automatically switch SSIDs, eliminating manual reconnection at ward boundaries. These innovations confirm wireless as the mobility engine of the medical device connectivity market.
By Application:
Continuous monitoring remains cornerstone while Tele-ICU soarsContinuous patient monitoring captured 45.95% of revenue in 2025, underscoring its centrality to deterioration detection, sepsis prevention, and ventilator weaning pathways. Central command centers aggregate feeds from bedsides, enabling fewer staff to supervise larger patient volumes and escalate only actionable alarms. Edge compute modules preprocess waveform data inside the hospital to minimize cloud egress and meet data-residency statutes. This persistent demand cements continuous monitoring as the volume anchor of the medical device connectivity market size.
Tele-ICU & Tele-Stroke services are projected at 26.40% CAGR, reflecting widescale adoption of hub-and-spoke critical care models. Rural facilities leverage high-definition cameras and shared analytics workstations to access intensivists around the clock. Stroke neurologists remotely confirm clot-retrieval eligibility within treatment windows, reducing disability rates. As reimbursement parity rules stabilize, more health systems bankroll dedicated tele-critical care networks, propelling this niche toward outsized gains within the medical device connectivity market.
By End-User:
Hospitals dominate yet home care growth reshapes downstream demandHospitals & clinics contributed 66.70% of 2025 turnover, supported by regulatory mandates, multi-modality device fleets, and in-house biomedical informatics teams capable of sustaining complex interfaces. These institutions integrate pumps, ventilators, and hemodynamic monitors into EHR flows that feed quality dashboards and sepsis bundles. Documentation accuracy ties directly to Diagnosis-Related Group reimbursement, ensuring steady investment in the medical device connectivity market.
Home healthcare settings are on track for 27.10% CAGR, underpinned by expanded remote patient monitoring billing codes and consumer preference for aging-in-place. Cellular gateways embedded in blood pressure cuffs and spirometers overcome inconsistent broadband, automatically synchronizing data for clinician review. Analytics engines filter noise, surfacing only threshold breaches to care coordinators. This shift decentralizes demand, requiring vendors to support self-installation kits and intuitive mobile apps, and it marks a pivotal evolution in the medical device connectivity industry.
Geography Analysis
North America Medical Device Connectivity Market
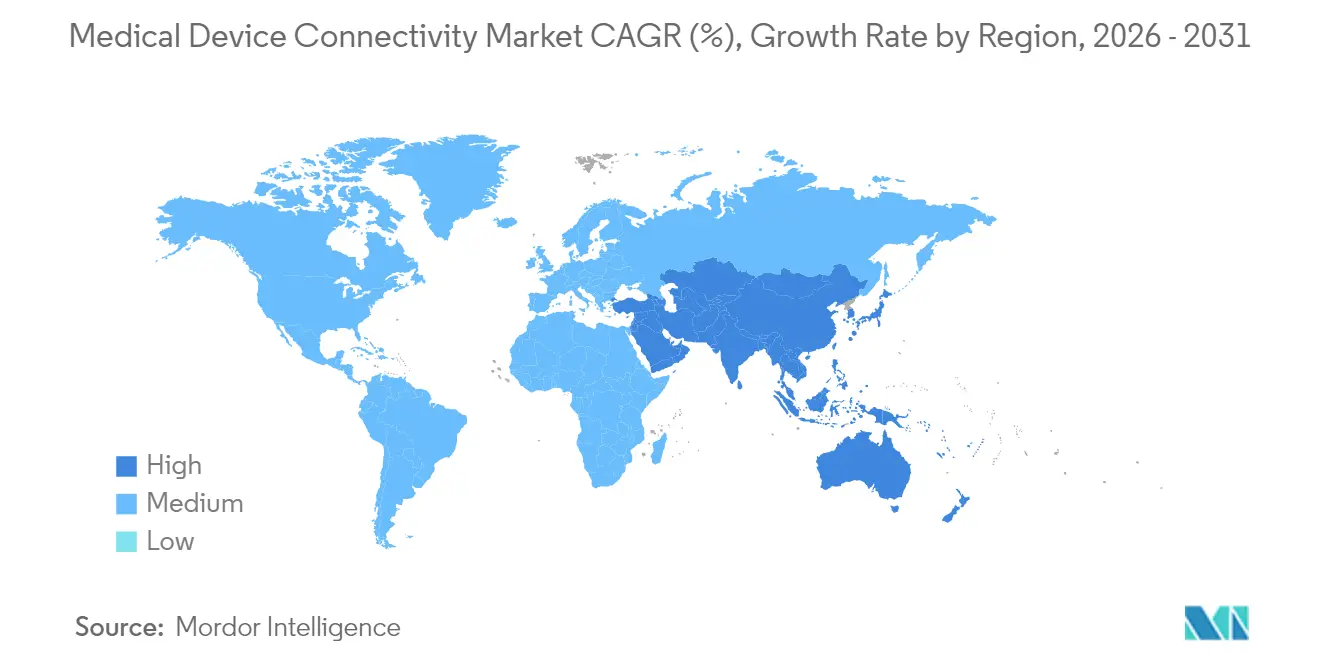
North America held 38.10% of 2025 revenue due to mature EHR penetration, strict interoperability enforcement, and early adoption of edge analytics. CMS penalties for information blocking and new API mandates compel providers to deploy standards-based gateways that seamlessly connect bedside devices with payer portals. Academic medical centers pilot AI-augmented surveillance that merges continuous monitoring with predictive scoring, accelerating procurement of high-throughput connectivity hubs. Venture investment in digital health startups further expands the regional footprint of the medical device connectivity market.
APAC Medical Device Connectivity Market
Asia Pacific is forecast to expand 25.90% annually between 2026-2031, the fastest worldwide. China scales smart hospital blueprints featuring private 5G, robotics, and cloud PACS integration, while India’s production-linked incentive schemes nurture indigenous device manufacturers embedding open-standard interfaces from inception. Japan upgrades rural clinics with tele-stroke networks, leveraging government stimulus that reimburses cross-prefecture consults over encrypted VPNs. South Korea and Australia incentivize data-centric healthcare pilots, creating fertile ground for wireless telemetry and AI triage algorithms. These dynamics are positioning the region as a critical growth engine of the medical device connectivity market.
Europe Medical Device Connectivity Market
Europe grows at a projected 21.05% CAGR, supported by the Medical Device Regulation and General Data Protection Regulation, which jointly elevate interoperability and cybersecurity bars. Germany subsidizes hospital digital maturity upgrades under its Hospital Futures Act, accelerating HL7-FHIR gateway procurements. The United Kingdom mandates digital maturity assessments for NHS trusts, unlocking funding for secure device onboarding. Nordic countries pioneer 6G research testbeds for clinical use, and pan-EU initiatives encourage cross-border data exchange via the European Health Data Space. Strong attention to privacy and security shapes vendor selection, with hospitals favoring platforms offering zero-trust designs and granular consent management, reinforcing Europe’s stature within the medical device connectivity market.

Regulatory Landscape
Regulation is tightening around interoperability and cybersecurity for connected medical devices, which is pushing manufacturers and providers toward standardized, auditable connectivity architectures. In the United States, FDA issued updated guidance in February 2026, "Cybersecurity in Medical Devices: Quality Management System Considerations and Content of Premarket Submissions," linking cybersecurity evidence more explicitly to the Quality Management System Regulation (QMSR) and reinforcing expectations for secure-by-design connectivity, vulnerability management, and documented controls as part of premarket submissions and lifecycle activities.
In Europe, Regulation (EU) 2017/745 (MDR), consolidated effective January 1, 2026, includes Annex I essential requirements that explicitly call out interoperability-related risks for devices with electronic interfaces (including data input and output). The European Health Data Space (EHDS) framework also adds an interoperability-and-logging direction for products handling priority electronic health data, extending compliance considerations beyond traditional device safety and performance. This is increasing the value of connectivity solutions built around common standards (for example HL7 FHIR and IEEE 11073) with traceable logging and security lifecycle practices (such as EN IEC 81001-5-1:2022).
Competitive Landscape
The medical device connectivity market shows moderate concentration as multinational device makers, IT giants, and niche integrators align offerings around unified data platforms. Philips, through its Capsule acquisition, bundles bedside hubs with cloud analytics that flag early patient deterioration. GE HealthCare integrates VitalsIQ algorithms directly into monitors, shortening detection-to-intervention loops. Siemens Healthineers partners with Vivolight to launch multimodal angiography platforms that natively stream DICOM and OCT data into vascular guidance suites, exemplifying the shift from standalone connectors to workflow-centric ecosystems.
Cloud-native challengers capitalize on microservice architectures that scale elastically and simplify update roll-outs. Their subscription pricing undercuts perpetual licences, appealing to community hospitals and ambulatory networks. Start-ups embed machine learning models that classify waveforms or predict pressure-injury risk, positioning connectivity as an AI enablement layer. Security differentiation is intensifying; vendors advertise FIPS-validated encryption modules, continuous vulnerability scanning, and Software Bill of Materials disclosures to satisfy FDA premarket expectations.
Co-development and reseller agreements blur competitive boundaries. Device manufacturers white-label integration engines to speed time-to-market while connectivity specialists pre-certify libraries for hundreds of device profiles, lowering integration cost for providers. Strategic activity is expected to continue as platforms converge on end-to-end solutions that fuse device data, clinical context, and predictive analytics, redefining value capture across the medical device connectivity market.
Medical Device Connectivity Industry Leaders
Cisco Systems Inc.
GE HealthCare Technologies Inc.
Koninklijke Philips N.V.
Oracle Corporation
Siemens Healthineers AG
- *Disclaimer: Major Players sorted in no particular order

Medical Device Connectivity Market Companies Covered in this Report
- Ascom
- Baxter
- Cisco Systems
- Digi International Inc.
- Dragerwerk
- GE HealthCare Technologies Inc.
- Honeywell International
- ICU Medical
- Koninklijke Philips
- Lantronix Inc.
- Masimo
- Medtronic
- Mindray
- NantHealth
- Nihon Kohden
- Oracle
- S3 Connected Health
- Siemens Healthineers
- Spectrum Medical Ltd
- Stryker

Market Opportunities and Future Outlook
Security-by-design connectivity and compliance-ready interoperability tooling are becoming direct commercial levers as regulators and standards bodies formalize requirements that affect both device makers and healthcare delivery organizations. FDA's February 2026 cybersecurity guidance ties connected-device security activities into QMS processes, and the linked requirements for premarket evidence such as SBOM packaging and vulnerability disclosure planning support demand for connectivity gateways, interface engines, and managed services that can maintain inventories, patch status, and device-to-system data flows across heterogeneous fleets.
Standardization efforts also create whitespace for vendors that can operationalize real-time device data exchange without forcing single-vendor lock-in. HL7 International launched the Caliper FHIR Accelerator in March 2026 to advance standardized, real-time medical device data interoperability, supporting integration pathways between bedside devices, remote monitoring stacks, and enterprise EHR and analytics layers. On the payer and administrative side, CMS-0057-F drives broader FHIR API implementation with major compliance milestones effective January 2027, which raises the importance of clean, context-rich device data streams that can be mapped to longitudinal records and shared across providers and payers. This environment favors platforms with validated device libraries, repeatable onboarding, and audit-grade logging.
Recent Industry Developments in Medical Device Connectivity Market
- June 2026: Philips announced a strategic collaboration with Bajaj Integrated Health System (BIHS) in India to deploy IntelliBridge Enterprise 3.0, described as the first global implementation of the system across a digitally connected care network. The collaboration reinforces enterprise-grade, multi-device integration as a platform play, extending connectivity demand beyond single hospitals into networked delivery models across multiple sites and care settings.
- February 2026: Oracle launched the Oracle Health Device Validation Program in the United States to standardize medical device connectivity and workflow validation in an EHR-agnostic manner. By formalizing validation and onboarding practices, the program supports faster device integration cycles and raises the bar for interoperability documentation and repeatable integration quality across multi-vendor device fleets.
- November 2024: Siemens Healthineers and Vivolight launched the ARTIS icono floor, a DSA-OCT hybrid platform positioned around integrated vascular imaging with standard connectivity protocols. The launch highlights how imaging systems are bundling multimodal data streaming into clinical workflows, increasing downstream requirements for reliable device-to-PACS and device-to-enterprise integration.


Medical Device Connectivity Market Report Scope and Research Methodology
Market Definition and Coverage
For this study, the medical device connectivity market covers the hardware, software, and services used to securely move clinical data between regulated medical devices and hospital or cloud information systems, so data can be captured, viewed, and used in care workflows.
Scope exclusions: This sizing does not include unregulated consumer wearables, standalone electronic health record platforms, or hospital-only integration tools that sit fully outside the medical device data path.
Segments Covered in This Report
- By Component
- Connectivity Solutions
- Interface Engines & Integration Platforms
- Connectivity Hubs & Gateways
- Device Interface Modules
- Connectivity Services
- Implementation & Integration
- Support & Maintenance
- Consulting & Training
- Connectivity Solutions
- By Technology
- Wired
- Wireless
- Hybrid
- By Application
- Continuous Patient Monitoring
- Tele-ICU & Tele-Stroke
- Imaging & PACS Connectivity
- Medication Administration & Smart IV Pumps
- Anesthesia & Ventilator
- Other Applications
- By End-User
- Hospitals & Clinics
- Ambulatory Surgery & Specialty Centers
- Home Healthcare Settings
- Other End-Users
- By Geography (Value)
- North America
- United States
- Canada
- Mexico
- Europe
- Germany
- United Kingdom
- France
- Italy
- Spain
- Rest of Europe
- Asia-Pacific
- China
- India
- Japan
- Australia
- South Korea
- Rest of Asia-Pacific
- Middle East & Africa
- GCC
- South Africa
- Rest of Middle East & Africa
- South America
- Brazil
- Argentina
- Rest of South America
- North America
Data Sources, Market Sizing, and Validation
Desk Research
Desk research starts by building the demand context and the product boundary, since similar terms are used loosely in public discussions. We referenced open sources such as FDA device databases and guidance pages, CMS and OECD health spending indicators, HIMSS interoperability material, and standards resources such as HL7 and IEEE, along with peer-reviewed articles on device integration and cybersecurity.
We then layered in company filings, investor presentations, press releases, and hospital procurement announcements to understand adoption patterns and typical implementation scope. Where needed, we also used paid subscriptions for company financials and intelligence, patent lookups, and shipment-level import and export signals for selected connectivity hardware components. These desk research sources are not exhaustive, and many other public and paid references were used for data collection, validation, and clarification checks.
Primary Interviews and Surveys
Primary work was used to confirm what buyers actually pay for and what suppliers count as connectivity revenue, since packaging often mixes software, interfaces, and service hours. We spoke with hospital IT and clinical engineering stakeholders, device OEM and integration teams, and implementation and support specialists across major regions, so assumptions on adoption timing, pricing ranges, and renewal cycles could be pressure-tested against real purchasing and support practices.
Distribution of primary research fieldwork respondents
| Company type | Respondent position | Region |
|---|---|---|
| Top tier: 36% | CXOs: 16% | APAC: 49% |
| Mid tier: 42% | Functional/Unit leaders: 29% | EMEA: 30% |
| Smaller Players: 22% | Managers: 55% | Americas: 21% |
Market-Sizing & Forecasting
The core model uses a top-down approach where hospital device-installed base signals and care-delivery activity indicators are translated into a realistic connectivity attach rate, and then converted into value using typical pricing structures for gateways, interface software, and implementation support. To keep totals grounded, the result is corroborated with selective bottom-up approximations, including sampled average selling price ranges multiplied by implied unit volumes, plus channel checks on implementation intensity in different facility types.
Key inputs that shaped the model include the connected bedside and ambulatory device footprint in hospitals, the share of devices needing middleware to reach clinical systems, integration project duration and labor mix, software subscription and maintenance renewal patterns, and interoperability and cybersecurity requirements that push upgrades. For forecasting, we leaned on scenario analysis supported by expert consensus on digital hospital roadmaps, budget cycles, and the pace of device replacement, and then the scenarios were translated into yearly penetration and pricing trajectories. Where product revenue could not be cleanly separated from broader IT bundles, we applied a consistent allocation rule and rechecked it through follow-up calls.
Data Validation & Update Cycle
Outputs are checked against independent signals such as reported digital transformation spending trends, device deployment direction, and the practical tempo of integration projects across hospitals. When variances show up, assumptions are revisited in steps, starting with scope alignment, followed by pricing logic, and then adoption rates by facility type, before the final numbers are signed off.
Each dataset and calculation pass goes through peer review so arithmetic, unit handling, and currency timing are consistent. Reports are refreshed annually, and interim updates are triggered when material events occur, for example policy changes that affect interoperability requirements or a major shift in hospital IT spending. Before delivery, a final review pass is completed so clients receive the latest updated view.
Mordor Intelligence's Medical Device Connectivity Market Estimate Compared With Other Published Estimates
Published market sizes for medical device connectivity often differ because the boundary between device-level connectivity and broader hospital IT integration is not treated the same way, and the same issue shows up in what is counted as recurring revenue. Timing choices also matter, since some estimates use an earlier base year, different currency conversion points, or adoption curves that assume faster hospital rollout than procurement cycles typically allow.
Hospital device connectivity adoption signals, interface and gateway mix checks, and renewal pattern validation are the evidence used to keep Mordor Intelligence's USD 4.81 B (2026) figure tied to regulated device data movement, rather than wider software categories that sit outside the device pathway.
Benchmark comparison
| Source | Market Size | Gaps in Research Methodology |
|---|---|---|
| Mordor Intelligence | USD 4.81 B (2026) | |
| Regional Consultancy A | USD 3.10 B (2024) | Uses an earlier base year and does not clearly separate device connectivity tools from adjacent hospital integration spend, which can shift the counted revenue pool and the implied adoption curve. |
| Industry Publisher B | USD 3.79 B (2025) | Provides limited visibility on inclusions and revenue treatment, so service-heavy implementation work and recurring software fees may be handled inconsistently across regions and end users. |
The spread across the three numbers is mainly explained by year alignment and what gets counted as true device connectivity versus broader clinical IT work. By keeping scope rules explicit, testing pricing and renewal assumptions in interviews, and then reconciling totals to practical adoption signals, our estimate remains traceable to clear drivers that can be repeated and updated as the market evolves.


Key Questions Answered in the Report
What is the key factor motivating hospitals to upgrade legacy connectivity platforms?
Compliance with interoperability mandates is pushing hospitals to replace proprietary device interfaces with open-standard gateways that streamline data exchange and reduce clinician documentation time.
How is cybersecurity shaping vendor selection for connectivity solutions?
Providers prioritize platforms that embed zero-trust authentication and real-time vulnerability monitoring, aligning with FDA guidance that treats security as a prerequisite for device approval.
Why are wireless connectivity options gaining momentum over traditional wired links?
Wi-Fi 6E and private 5G networks support clinical mobility and easier room reconfiguration, enabling seamless monitoring as patients move between units without manual reconnection.
How are analytics changing the value proposition of device connectivity?
Edge and cloud analytics convert raw device data into predictive alerts, allowing care teams to intervene earlier and reduce preventable adverse events.
What role do managed services play in accelerating connectivity adoption?
Outsourcing implementation and maintenance helps facilities lacking in-house biomedical IT talent maintain uptime, manage patches, and meet evolving regulatory requirements more efficiently.
Outsourcing implementation and maintenance helps facilities lacking in-house biomedical IT talent maintain uptime, manage patches, and meet evolving regulatory requirements more efficiently.
Continuous data streams from wearables require scalable bandwidth management and contextual data tagging so that clinicians receive actionable insights without alert fatigue.
Page last updated on:


 Your data is secure and never sold or shared.


