
Maritime Alternative Bunkering Market Size and Share
Market Overview
| Study Period | 2021 - 2032 |
|---|---|
| Market Size (2027) | USD 13.08 Billion |
| Market Size (2032) | USD 28.14 Billion |
| Growth Rate (2027 - 2032) | 16.56 % |
| Fastest Growing Market | Middle East and Africa |
| Largest Market | Asia-Pacific |
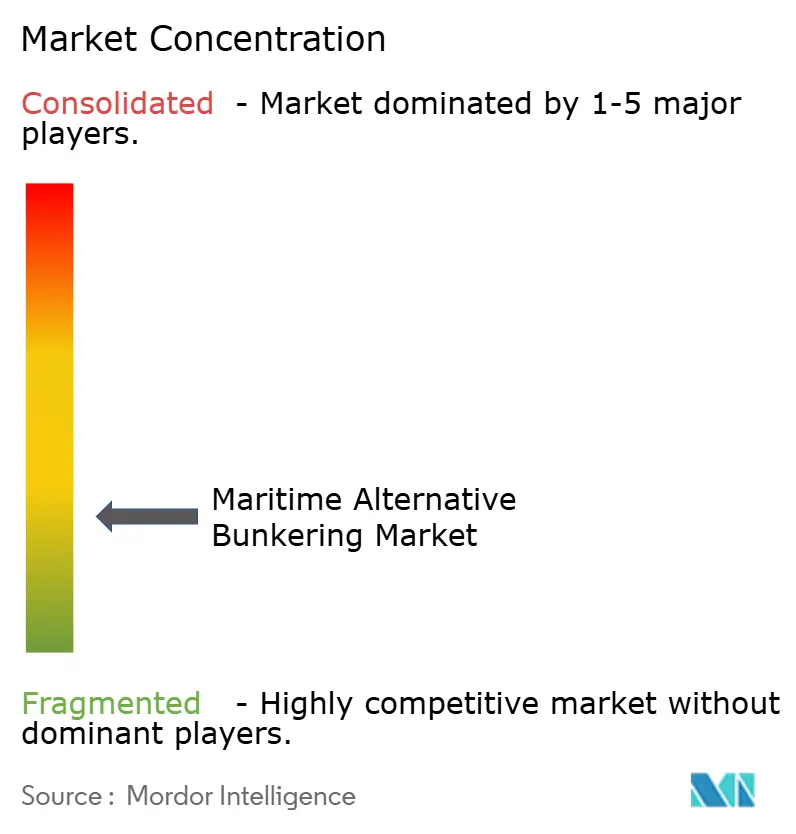
| Market Concentration | Low |
Major Players *Disclaimer: Major Players sorted in no particular order Image © Mordor Intelligence. Reuse requires attribution under CC BY 4.0. | |
Maritime Alternative Bunkering Market Analysis by Mordor Intelligence
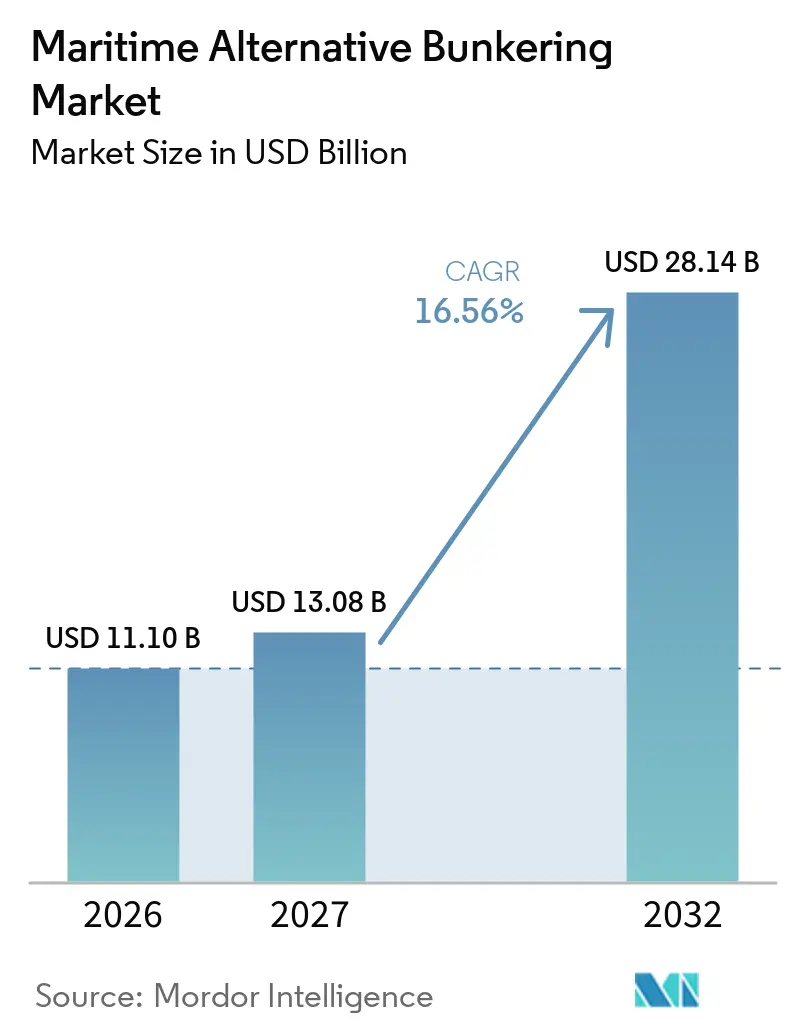
The maritime alternative bunkering market size was valued at USD 11.10 billion in 2026 and is estimated to grow from USD 13.08 billion in 2027 to reach USD 28.14 billion by 2032, at a CAGR of 16.56% during the forecast period (2027-2032).
Regulatory requirements and fleet renewal are moving fuel decisions from voluntary commitments into operating cost decisions. Dual-fuel ships entering service need reliable fuel availability across their port calls, which places greater pressure on suppliers and ports. The IMO Net-Zero Framework and FuelEU Maritime place clear financial consequences on continued conventional fuel use. This favors suppliers that can provide documented low-carbon fuel and manage delivery across several ports. The maritime alternative bunkering market is also drawing shipping companies into fuel logistics partnerships, which changes the relationships between carriers, traders, energy companies, and port operators.
Key Report Takeaways
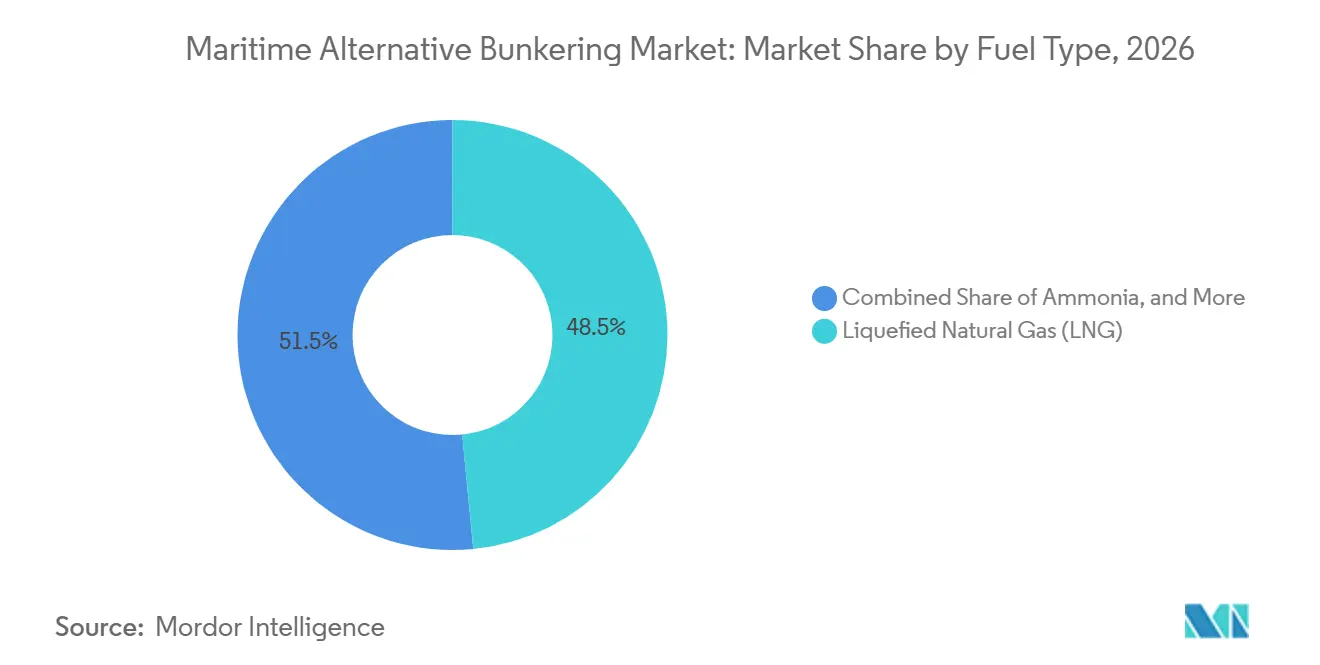
- By fuel type, LNG led with 48.46% of the maritime alternative bunkering market share in 2026, while ammonia recorded the highest projected CAGR at 22.31% through 2032.
- By bunkering mode, ship-to-ship bunkering held 43.55% of the maritime alternative bunkering market size in 2026, while portable tank and container-based bunkering recorded the highest projected CAGR at 19.45% through 2032.
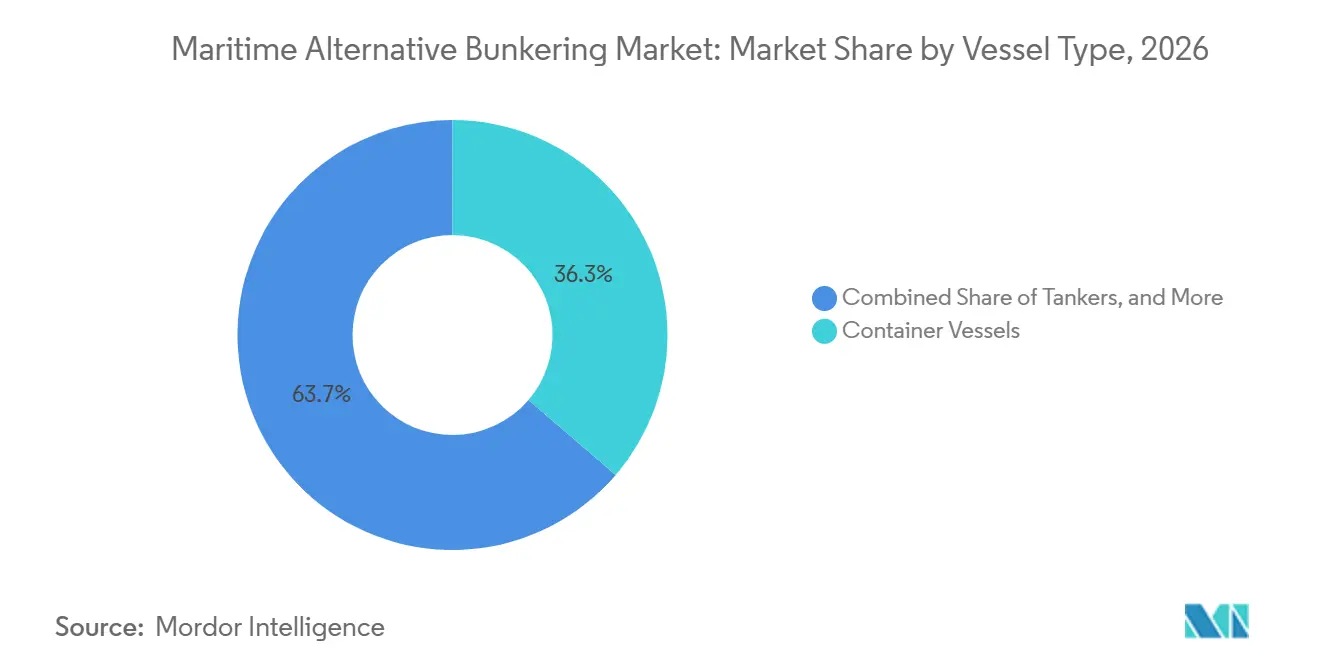
- By vessel type, container vessels held 36.28% of the maritime alternative bunkering market share in 2026, while passenger ships and ferries recorded the highest projected CAGR at 18.09% through 2032.
- By buyer type, shipping companies and fleet managers held 42.19% of the maritime alternative bunkering market size in 2026, while charterers recorded the highest projected CAGR at 17.49% through 2032.
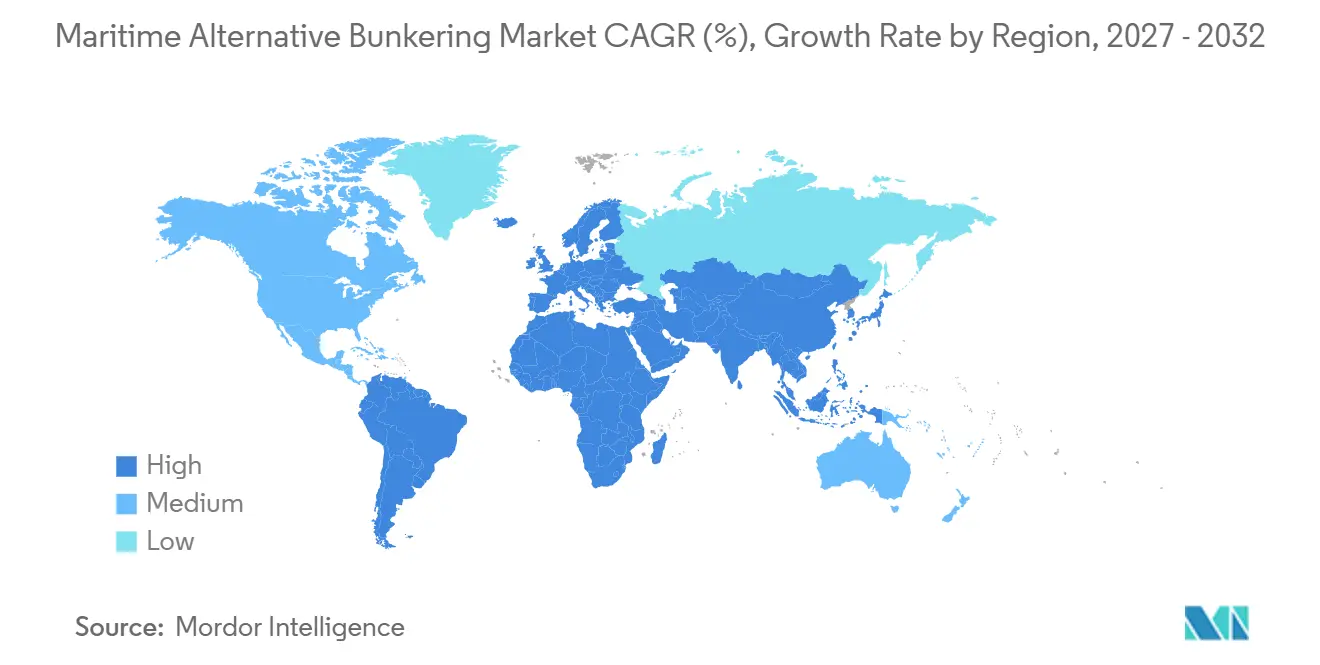
- By geography, Asia-Pacific held a 40.12% of the maritime alternative bunkering market share in 2026, while the Middle East and Africa recorded the highest projected CAGR at 18.23% through 2032.
Note: Market numbers in this report are based on Mordor Intelligence's proprietary estimation framework, which combines nine months of actuals with Q4 projections for base year 2026.
Market Trends and Insights
Drivers Impact Analysis of Maritime Alternative Bunkering Market*
| Driver | (~) % Impact on CAGR Forecast | Geographic Relevance | Impact Timeline |
|---|---|---|---|
| IMO and Regional Greenhouse-Gas Compliance Requirements | +5.5% | Global, with accelerated impact in the EU, Singapore, Japan, and South Korea | Short term (≤ 2 years) |
| Expansion of Dual-Fuel and Alternative-Fuel Vessel Fleets | +3.8% | Global, concentrated in Asia-Pacific newbuild activity and Northern European fleet deployment | Medium term (2-4 years) |
| Growth of Green Shipping Corridors and Long-Term Fuel Offtake Agreements | +2.4% | Asia-Pacific, EU, Middle East and Africa, and emerging South America | Medium term (2-4 years) |
| Port Investment in Multi-Fuel Bunkering Infrastructure | +2.1% | Asia-Pacific, EU, and Middle East and Africa hubs | Medium term (2-4 years) |
| Demand for Drop-In Biofuels and Renewable Methane | +1.9% | Global, with near-term concentration in Europe and Singapore | Short term (≤ 2 years) |
| Underused Port Assets Enabling Modular Multi-Fuel Conversion | +0.9% | North America, Southeast Asia, South America, and Middle East and Africa hubs | Long term (≥ 4 years) |
| Source: Mordor Intelligence | |||
IMO and Regional Greenhouse-Gas Compliance Requirements
The maritime alternative bunkering market is shaped by the IMO Net-Zero Framework, approved at MEPC 83 in April 2025 and adopted in October 2025. The framework covers ocean-going ships above 5,000 gross tonnage, which account for 85% of international shipping carbon dioxide emissions. From 2028, ships that exceed greenhouse gas fuel-intensity thresholds face remedial-unit payments beginning at USD 100 per ton of CO2 equivalent. The European Commission states that the mechanism could generate USD 11-13 billion each year. Lifecycle accounting improves the position of bio-LNG, green methanol, and ammonia relative to fossil fuels. FuelEU Maritime adds a regional requirement for vessels calling at EU ports, while MARPOL Annex VI extends the international relevance of these rules.[1]
Dual-Fuel Fleet Expansion Creates Distributed Bunkering Demand
Alternative-fuel vessels represented 58% of global newbuild orders by tonnage during January through May 2025, compared with 47% during 2024 and 8.2% in 2016. A dual-fuel ship requires practical access to its designated fuel through a service life of 20-25 years. CMA CGM is targeting 123 LNG-capable vessels by 2029, COSCO has ordered 32 methanol dual-fuel container ships, and MOL has jointly owned ammonia dual-fuel Capesize bulkers scheduled for 2026 and 2027 delivery. The maritime alternative bunkering market, therefore, depends on delivery networks that match actual port-call schedules rather than a small number of showcase facilities.[2] MOL completed its first LNG bunkering on North America’s West Coast in March 2025 and later secured a term agreement with Seaspan Energy in Vancouver. Ammonia-capable vessels ordered now can create demand beyond the forecast period, since long-term fuel choices are fixed early in the vessel investment cycle.
Green Shipping Corridors and Long-Term Fuel Agreements
Green shipping corridor initiatives reached 84 globally in 2025 after 25 new programs were added in markets including China, India, Brazil, Chile, Ghana, and Kenya. Corridors link fuel production, bunkering, and ship deployment on specific routes, which improves the case for storage and bunker vessels. An OECD review of 104 agreements found that methanol accounted for 44%, green ammonia for 20%, and LNG and bio-LNG for 20%. Long-term contracts can protect buyers from limited certified supply, particularly where several carriers pursue the same fuel. Maersk stated in November 2025 that its secured methanol supply through 2026 was not progressing at its preferred pace. The October 2025 memorandum between the Port of Algeciras and the Panama Canal Authority also showed institutional support for cross-border corridor investment.
Port Investment in Multi-Fuel Bunkering Infrastructure
The maritime alternative bunkering market benefits when port investments support more than one fuel pathway. Hamburg Port Authority approved Waltershofer Hafen for methanol and LNG ship-to-ship bunkering in August 2025. Rotterdam’s Gate Terminal commissioned its fourth LNG storage tank in October 2026, taking capacity to 20 billion cubic meters a year. Singapore expanded its LNG supplier base from 3 to 11 licensed operators in September 2026 and issued ammonia bunkering guidance during 2026. Broad fuel coverage can draw vessel calls toward prepared hubs and can make later entry more expensive for competing ports. Modular conversion of underused port assets can extend this model to smaller hubs in North America, Southeast Asia, South America, and the Middle East and Africa.
Restraints Impact Analysis of Maritime Alternative Bunkering Market*
| Restraint | (~) % Impact on CAGR Forecast | Geographic Relevance | Impact Timeline |
|---|---|---|---|
| High Delivered Cost of Green Methanol, Ammonia, and Hydrogen | -2.8% | Global, most acute where carbon-pricing offsets are unavailable | Medium term (2-4 years) |
| Limited Availability of Certified Low-Carbon Feedstocks | -2.0% | Global, most acute in North America, Southeast Asia, and Middle East and Africa | Medium term (2-4 years) |
| Fuel-Specific Safety, Training, and Port-Approval Requirements | -1.2% | Global; concentrated in APAC emerging ports, MEA, and South America | Medium term (2-4 years) |
| Uncertainty Regarding Long-Term Fuel Dominance and Infrastructure Obsolescence | -0.9% | Global; most acute in markets committing to single-fuel infrastructure | Long term (≥ 4 years) |
| Source: Mordor Intelligence | |||
The Delivered Cost Gap for Zero-Emission Fuels Constrains Adoption
Green ammonia prices in Northwest Europe held near USD 2,900 per ton of MGO equivalent in 2025, 5 times conventional marine fuel pricing. An ammonia bunker barge can cost USD 30 million before fuel delivery begins. Green methanol also carries a substantial production cost premium, despite projected capital-cost reductions for synthesis plants during the late 2020s. The IMO mechanism and the EU Emissions Trading System add costs to conventional fuel, but they do not remove the near-term price gap.[3] Large liner companies can use volume commitments and supply agreements to reduce their exposure. Bulk and tanker operators often lack that scale, which slows their movement toward zero-emission fuels.
Certified Feedstock Scarcity Limits Drop-In Biofuel Scale
The Oil and Gas Climate Initiative estimated sustainable biomass availability at 1.8 billion tons in 2025, rising to 3.3 billion tons by 2050. The usable share declines when buyers require waste-based or second-generation feedstocks with recognized certification. Used cooking oil and animal fats also serve sustainable aviation fuel programs, creating competition for available material. The International Council on Clean Transportation found that redirecting current used-cooking-oil biofuels to shipping would cover only 4.9% of international shipping energy demand under the IMO framework. Biogenic CO2 for e-methanol and green hydrogen for ammonia also remain limited without financeable offtake contracts.[4] The maritime alternative bunkering market can, therefore, face supply shortages even where operators, ports, and buyers are ready to purchase certified fuel.
*Our forecasts treat driver/restraint impacts as directional, not additive. The impact forecasts reflect baseline growth, mix effects, and variable interactions.
Maritime Alternative Bunkering Market Segment Analysis
By Fuel Type, LNG Anchors Volume While Ammonia Defines Long-Term Direction
LNG held 48.46% of the maritime alternative bunkering market share in 2026, while ammonia is growing at a 22.31% CAGR through 2032. LNG is supported by more than 62 bunkering vessels and 222 port facilities worldwide, and its installed network can distribute bio-LNG and e-methane without vessel modification. This gives shipowners a route to improve lifecycle fuel performance as requirements tighten. Ammonia is progressing from pilots to contracted fleet programs, including NYK Line and Yara Clean Ammonia’s February 2025 time-charter agreement for a carrier scheduled for November 2026 delivery. The maritime alternative bunkering industry needs specialized vessels, trained operators, and safety procedures before ammonia volumes can increase materially.
Methanol is gaining ground as a dual-fuel option and was available at 20 ports by mid-2025, with more than 60 methanol-capable vessels in operation. Liquid biofuels and bio-LNG serve near-term compliance needs for vessels without new fuel systems, while Singapore recorded 1.95 million tons of alternative marine fuel uptake in 2025, compared with 1.35 million tons in 2024. Hydrogen remains centered on pilot applications because cost and safety infrastructure remain unresolved. ISCC and comparable systems require traceability and greenhouse gas savings records for biofuels and biomethane. The maritime alternative bunkering market may retain several fuel pathways because vessel design, routes, and supply availability differ.

By Bunkering Mode, Ship-to-Ship Leads While Portable Delivery Extends Reach
Ship-to-ship bunkering accounted for 43.55% of the maritime alternative bunkering market size in 2026. It offers the flexibility and scale required at major ports, where vessels cannot always wait at a dedicated terminal. LNG volumes in the Iberian Peninsula more than doubled to 893,860 cubic meters in 2025 through activity across Algeciras, Barcelona, Sines, and Valencia. Bunker vessels can be repositioned as demand changes across trade lanes, allowing suppliers to serve several nodes from one operating asset. The maritime alternative bunkering market benefits from this approach when demand remains uneven among ports.
Portable tanks and container-based delivery are growing at a 19.45% CAGR through 2032, bringing alternative fuel to smaller ports before permanent infrastructure is justified. Truck-to-ship delivery suits regular liner calls with predictable schedules, including the first Canary Islands LNG delivery in June 2026 for a Balearia dual-fuel passenger ferry. Terminal-to-ship and pipeline-to-ship delivery provide higher unit efficiency but depend on sustained volumes and long-term port confidence. The two delivery approaches can operate together, with ship-to-ship delivery serving established hubs and portable systems serving new locations. This broadens access without requiring every port to make the same capital commitment.
By Vessel Type, Container Ships Lead While Ferries Accelerate
Container vessels accounted for 36.28% of the maritime alternative bunkering market share in 2026. Major liner operators have placed dual-fuel orders across their fleets, while regular port rotations simplify fuel planning. Avenir LNG completed the first ship-to-ship LNG bunkering of a ferry at Lithuania’s Port of Klaipeda in March 2026, serving TT-Line’s Peter Pan. A 2025 journal review found that methanol had broad potential across ferry categories when lifecycle emissions and energy density were considered. The maritime alternative bunkering market can use these route patterns to establish practical early demand for new fuels.
Passenger ships and ferries are expanding at an 18.09% CAGR through 2032 because their fixed short routes reduce delivery uncertainty. Tankers, bulk carriers, and general cargo ships remain important users but have more diverse routes, which makes alternative-fuel planning harder. Offshore and specialized ships are active LNG users on fixed platform-supply routes but represent a smaller revenue pool. Supply at remote or infrequent ports can determine their fuel choice as much as vessel technology. Broader delivery availability can reduce the operating risk that holds back these fleets.
By Buyer Type, Fleet Managers Hold Scale While Charterers Grow
Shipping companies and fleet managers accounted for 42.19% of the maritime alternative bunkering market size in 2026. Their fleet scale and call frequency support predictable pricing, port scheduling, and long-term supply agreements. These agreements can underpin infrastructure investment for LNG, methanol, and biofuels. Shipowner operators are balancing dual-fuel orders with several supply agreements across their trade routes. This change spreads maritime alternative bunkering market demand beyond the concentrated group of major liner companies.
Charterers are the fastest-growing buyer group at a 17.49% CAGR through 2032, as FuelEU Maritime increases their role in voyage-period fuel choices. Brokers and energy trading desks help match available fuel with demand at ports that lack long-term arrangements, especially in newer locations. Shipping companies can reduce supply risk through direct contracts, while charterers can influence demand one voyage at a time. The buyer base becomes less concentrated as fuel responsibility becomes more distributed through charter-party agreements. This raises the value of dependable documentation, pricing, and local delivery capability.
Geography Analysis
Asia-Pacific led with a 40.12% revenue share in 2026. Singapore recorded 56.77 million tons of total marine fuel sales in 2025, including 1.95 million tons of alternative marine fuel uptake. Its LNG bunker sales reached 318,300 tons in the first half of 2026, a 30% increase from the prior-year period, while China’s LNG bunkering activity increased 45% in 2025. Singapore expanded its LNG supplier base from 3 to 11 licensed operators in September 2026, and South Korea completed its first green methanol ship-to-ship bunkering at Ulsan in September 2025. Japan is supporting an ammonia-fueled ocean-going carrier through its Green Innovation Fund, with delivery scheduled for November 2026.
Europe is the second-largest region in the maritime alternative bunkering market, supported by the ARA corridor, Iberian expansion, and Nordic bio-LNG activity. FuelEU Maritime, in force from 2025, creates a strong demand signal for certified low-carbon fuels across the maritime alternative bunkering market. Rotterdam added 180,000 cubic meters of storage through its fourth Gate Terminal LNG tank in October 2026. Hamburg approved Waltershofer Hafen for methanol and LNG ship-to-ship bunkering in August 2025. North America is developing as a growth location in the maritime alternative bunkering market, with Crowley’s LNG bunker barge Progress operating from Savannah and a December 2025 joint study advancing commercial methanol bunkering on the United States Gulf Coast.
The Middle East and Africa is expanding at an 18.23% CAGR through 2032, the fastest geographic rate in the maritime alternative bunkering market. Mawani agreed to a 20-year Yanbu land lease with Petrotank in August 2025 for SAR 500 million (USD 133 million). AD Ports Group, Masdar, Advario, and CMA CGM agreed in June 2025 to explore e-methanol bunkering at Khalifa Port. Egypt is developing LNG capability at Port Said, Oman’s Port of Salalah has leased space for biofuel storage, and South America has corridor activity in Brazil and Chile.
Competitive Landscape
The maritime alternative bunkering market remains fragmented among suppliers, while energy majors, bunker traders, and shipping companies are strengthening their positions. Shell, TotalEnergies, and ExxonMobil are using established fuel networks to add LNG, bio-LNG, and ammonia capability across the maritime alternative bunkering market. Shell and Hapag-Lloyd signed a multiyear bio-LNG supply agreement in September 2025 across 22 locations. ExxonMobil announced in October 2025 that 2 LNG bunker vessels would enter service from 2027. TFG Marine, Peninsula, Bunker Holding, and Monjasa compete through geographic coverage and delivery flexibility.
Shipping lines are taking a more direct role in the maritime alternative bunkering market through supply-chain partnerships. CMA CGM and TotalEnergies formed a 50-50 LNG bunkering logistics joint venture in Rotterdam in July 2025, covering a 20,000 cubic meter vessel by 2028 and up to 360,000 tons of annual LNG supply through 2040. TFG Marine, CF Industries, and Trafigura signed an MOU in January 2026 to advance low-carbon ammonia. These moves combine customer demand, supply security, logistics, and technical capability. Smaller port clusters in the Middle East, East Africa, and South America remain open for physical infrastructure investment in the maritime alternative bunkering market.
Ammonia is a central competitive topic because it grows at a 22.31% CAGR through 2032. Specialized bunker vessels can cost USD 30 million, while safety requirements limit the pool of capable operators. Certification and traceable blending systems also favor companies that can document qualifying fuel pathways across the maritime alternative bunkering market.
Maritime Alternative Bunkering Industry Leaders
-
Shell plc
-
TotalEnergies SE
-
Bunker Holding A/S
-
Peninsula Petroleum Limited
-
ExxonMobil Corporation
- *Disclaimer: Major Players sorted in no particular order
Maritime Alternative Bunkering Market Companies Covered in this Report
- Crowley
- Shell plc
- TotalEnergies SE
- Peninsula
- World Fuel Services
- GAC
- Global Energy International
- Equatorial Marine Fuel Management Services
- Chimbusco Pan Nation
- Golden Island
- Seascale Energy
- Minerva Bunkering
- Fratelli Cosulich Group
- TFG Marine
- Bergen Bunkers
- Bunker Partner
- InterContinental Energies
- Malik Supply
- Norwegian Oil Trading
- Transparensea Fuels
- Oilmar
- FLEX Commodities
- Exxon Mobil Corporation
- Chevron Corporation
- Bunker Holding A/S
Recent Industry Developments in Maritime Alternative Bunkering Market
- May 2026: Mitsui O.S.K. Lines (MOL) and Seaspan Energy signed the first annual LNG bunkering contract for car carriers at the Port of Vancouver, Canada, formalizing commercial supply following MOL’s first West Coast North America LNG bunkering.
- March 2026: CMA CGM and SIPG Energy completed China’s largest single biomethanol bunkering (3,643 tons) at Yangshan Port for the CMA CGM OSMIUM, setting a national record and establishing an integrated biomethanol supply chain linking production in Jilin Province with Shanghai port delivery.
- January 2026: TFG Marine signed an MOU with CF Industries Holdings and Trafigura to advance low-carbon ammonia as a marine fuel, combining CF Industries’ Donaldsonville, Louisiana, production capacity, Trafigura’s logistics expertise, and TFG Marine’s global bunkering network, with initial focus on the United States Gulf Coast and Northwest Europe.
- December 2025: Mitsui O.S.K. Lines (MOL), SINOPEC, and Marubeni signed an MOU to establish a long-term stable biodiesel fuel supply system in China, covering production, storage, and designated supply ports to support decarbonization commitments under tightening IMO requirements.
Global Maritime Alternative Bunkering Market Report Scope
Segmentation Overview
| Liquefied Natural Gas (LNG) |
| Bio-LNG and Renewable Methane |
| Liquid Biofuels |
| Methanol |
| Ammonia |
| Hydrogen |
| Other Alternative Fuels |
| Ship-to-Ship Bunkering |
| Truck-to-Ship Bunkering |
| Terminal-to-Ship Bunkering |
| Pipeline-to-Ship Bunkering |
| Portable Tank and Container-Based Bunkering |
| Other Bunkering Methods |
| Container Vessels |
| Tankers |
| Bulk Carriers |
| General Cargo Vessels |
| Passenger Ships and Ferries |
| Offshore and Specialized Vessels |
| Other Commercial and Specialized Vessels |
| Shipowner Operators |
| Charterers |
| Shipping Companies and Fleet Managers |
| Other Buyers |
| North America | United States |
| Canada | |
| Mexico | |
| South America | Brazil |
| Argentina | |
| Peru | |
| Chile | |
| Rest of South America | |
| Europe | Germany |
| United Kingdom | |
| France | |
| Italy | |
| Spain | |
| Russia | |
| Nordics (Denmark, Finland, Iceland, Norway, and Sweden) | |
| Rest of Europe | |
| Asia-Pacific | China |
| India | |
| Japan | |
| South Korea | |
| Australia | |
| Southeast Asia (ASEAN) | |
| Rest of Asia-Pacific | |
| Middle East and Africa | Saudi Arabia |
| United Arab Emirates | |
| Qatar | |
| South Africa | |
| Nigeria | |
| Egypt | |
| Rest of Middle East and Africa |
| By Fuel Type | Liquefied Natural Gas (LNG) | |
| Bio-LNG and Renewable Methane | ||
| Liquid Biofuels | ||
| Methanol | ||
| Ammonia | ||
| Hydrogen | ||
| Other Alternative Fuels | ||
| By Bunkering Mode | Ship-to-Ship Bunkering | |
| Truck-to-Ship Bunkering | ||
| Terminal-to-Ship Bunkering | ||
| Pipeline-to-Ship Bunkering | ||
| Portable Tank and Container-Based Bunkering | ||
| Other Bunkering Methods | ||
| By Vessel Type | Container Vessels | |
| Tankers | ||
| Bulk Carriers | ||
| General Cargo Vessels | ||
| Passenger Ships and Ferries | ||
| Offshore and Specialized Vessels | ||
| Other Commercial and Specialized Vessels | ||
| By Buyer Type | Shipowner Operators | |
| Charterers | ||
| Shipping Companies and Fleet Managers | ||
| Other Buyers | ||
| By Geography | North America | United States |
| Canada | ||
| Mexico | ||
| South America | Brazil | |
| Argentina | ||
| Peru | ||
| Chile | ||
| Rest of South America | ||
| Europe | Germany | |
| United Kingdom | ||
| France | ||
| Italy | ||
| Spain | ||
| Russia | ||
| Nordics (Denmark, Finland, Iceland, Norway, and Sweden) | ||
| Rest of Europe | ||
| Asia-Pacific | China | |
| India | ||
| Japan | ||
| South Korea | ||
| Australia | ||
| Southeast Asia (ASEAN) | ||
| Rest of Asia-Pacific | ||
| Middle East and Africa | Saudi Arabia | |
| United Arab Emirates | ||
| Qatar | ||
| South Africa | ||
| Nigeria | ||
| Egypt | ||
| Rest of Middle East and Africa | ||
Key Questions Answered in the Report
What is driving maritime alternative bunkering demand?
IMO and EU compliance requirements, dual-fuel fleet deliveries, corridor programs, and multi-fuel port investment are driving demand.
Which fuel leads maritime alternative bunkering?
LNG led with 48.46% revenue share in 2026, supported by established vessel and port infrastructure.
Which fuel is growing fastest for marine bunkering?
Ammonia is expanding at a 22.31% CAGR through 2032 as contracted vessel programs move forward.
Which bunkering method has the largest share?
Ship-to-ship bunkering held 43.55% revenue share in 2026 because it offers flexible delivery at major hubs.
Which region leads alternative marine fuel uptake?
Asia-Pacific led with 40.12% revenue share in 2026, with Singapore and China supporting regional activity.
What limits wider use of zero-emission marine fuels?
High delivered fuel costs and limited certified feedstock availability constrain the pace of adoption.