
Managed Print Consumables Optimization Services Market Size and Share
Market Overview
| Study Period | 2021 - 2032 |
|---|---|
| Market Size (2027) | USD 4.53 Billion |
| Market Size (2032) | USD 6.78 Billion |
| Growth Rate (2027 - 2032) | 8.39 % |
| Fastest Growing Market | Asia-Pacific |
| Largest Market | North America |
| Market Concentration | Medium |
Major Players *Disclaimer: Major Players sorted in no particular order Image © Mordor Intelligence. Reuse requires attribution under CC BY 4.0. | |
Managed Print Consumables Optimization Services Market Analysis by Mordor Intelligence
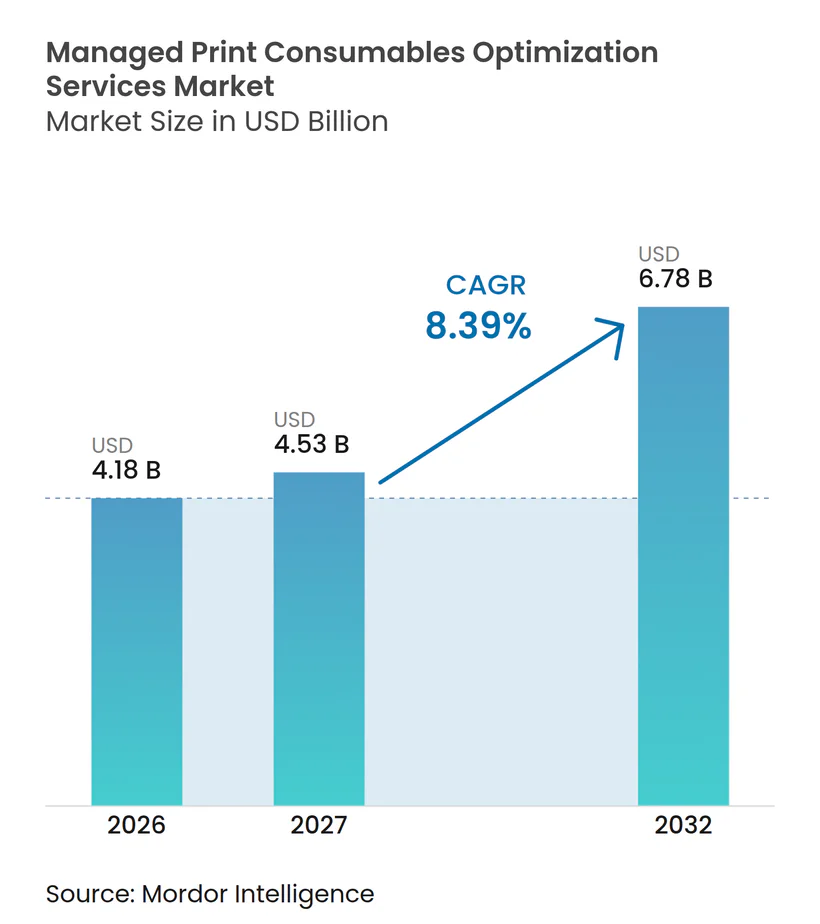
The managed print consumables optimization services market size is projected to expand from USD 4.18 billion in 2026 and USD 4.53 billion in 2027 to USD 6.78 billion by 2032, registering a CAGR of 8.39% between 2027 to 2032. Organizations are replacing reactive toner purchasing with monitoring systems that use device telemetry, toner-coverage data, and demand patterns to guide replenishment. This change places print supplies under procurement and IT control rather than treating them only as a facilities expense. Cloud delivery is widening access to analytics while supporting hybrid environments where security or data-residency requirements limit full migration. Providers that combine monitoring, forecasting, replenishment, and fulfillment can make their services part of daily fleet operations. The managed print consumables optimization services market also faces lower office print volumes, proprietary cartridge controls, and incomplete data from mixed device fleets.
Key Report Takeaways
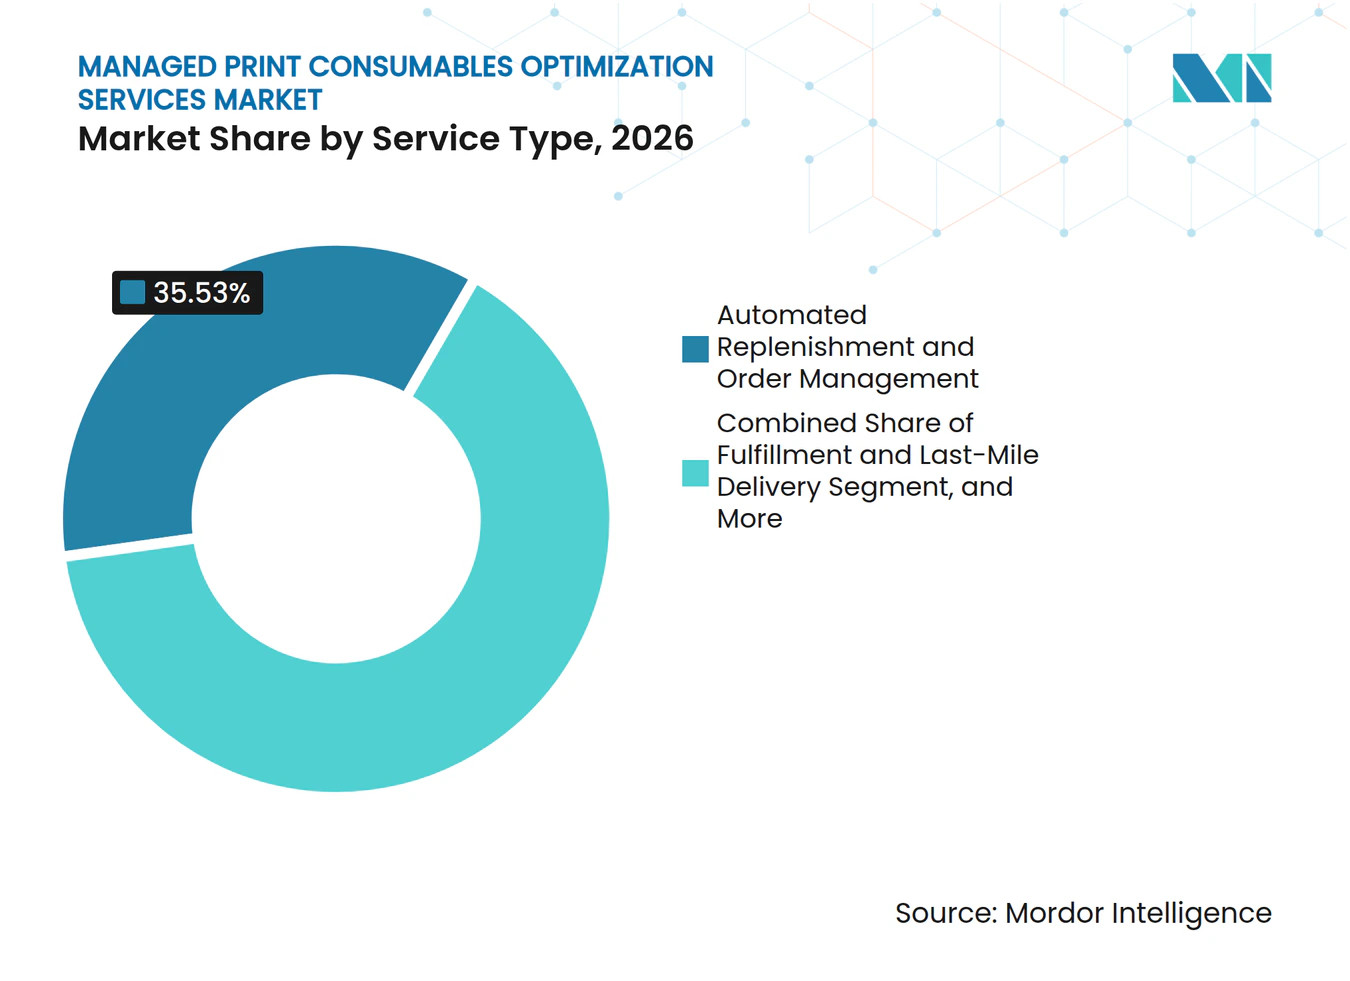
- By service type, automated replenishment and order management held 35.53% of the managed print consumables optimization services market share in 2026, while demand forecasting and usage analytics are projected to expand at a 7.11% CAGR through 2032.
- By consumables type, toner cartridges accounted for 48.89% of revenue in 2026, while ink-tank bottles are projected to expand at a 6.71% CAGR through 2032.
- By deployment mode, cloud-based services accounted for 43.96% of revenue in the managed print consumables optimization service market in 2026 and are projected to expand at a 6.69% CAGR through 2032.
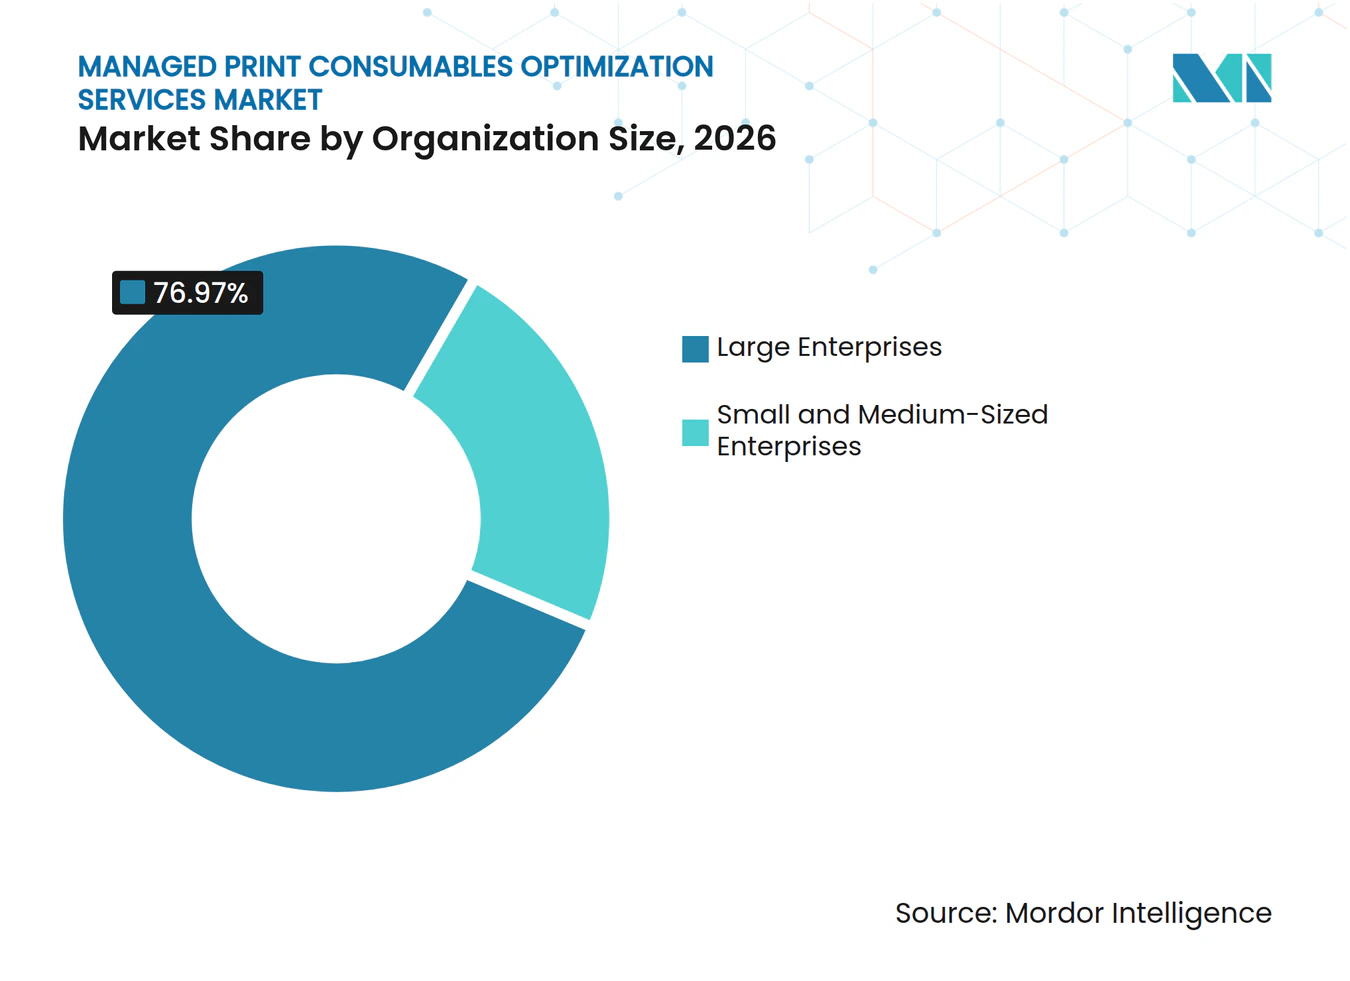
- By organization size, large enterprises held 76.97% of revenue in 2026, while small and medium-sized enterprises are projected to expand at a 6.52% CAGR through 2032.
- By end-user vertical, BFSI held 15.03% of revenue in 2026, while healthcare is projected to expand at a 7.89% CAGR through 2032.
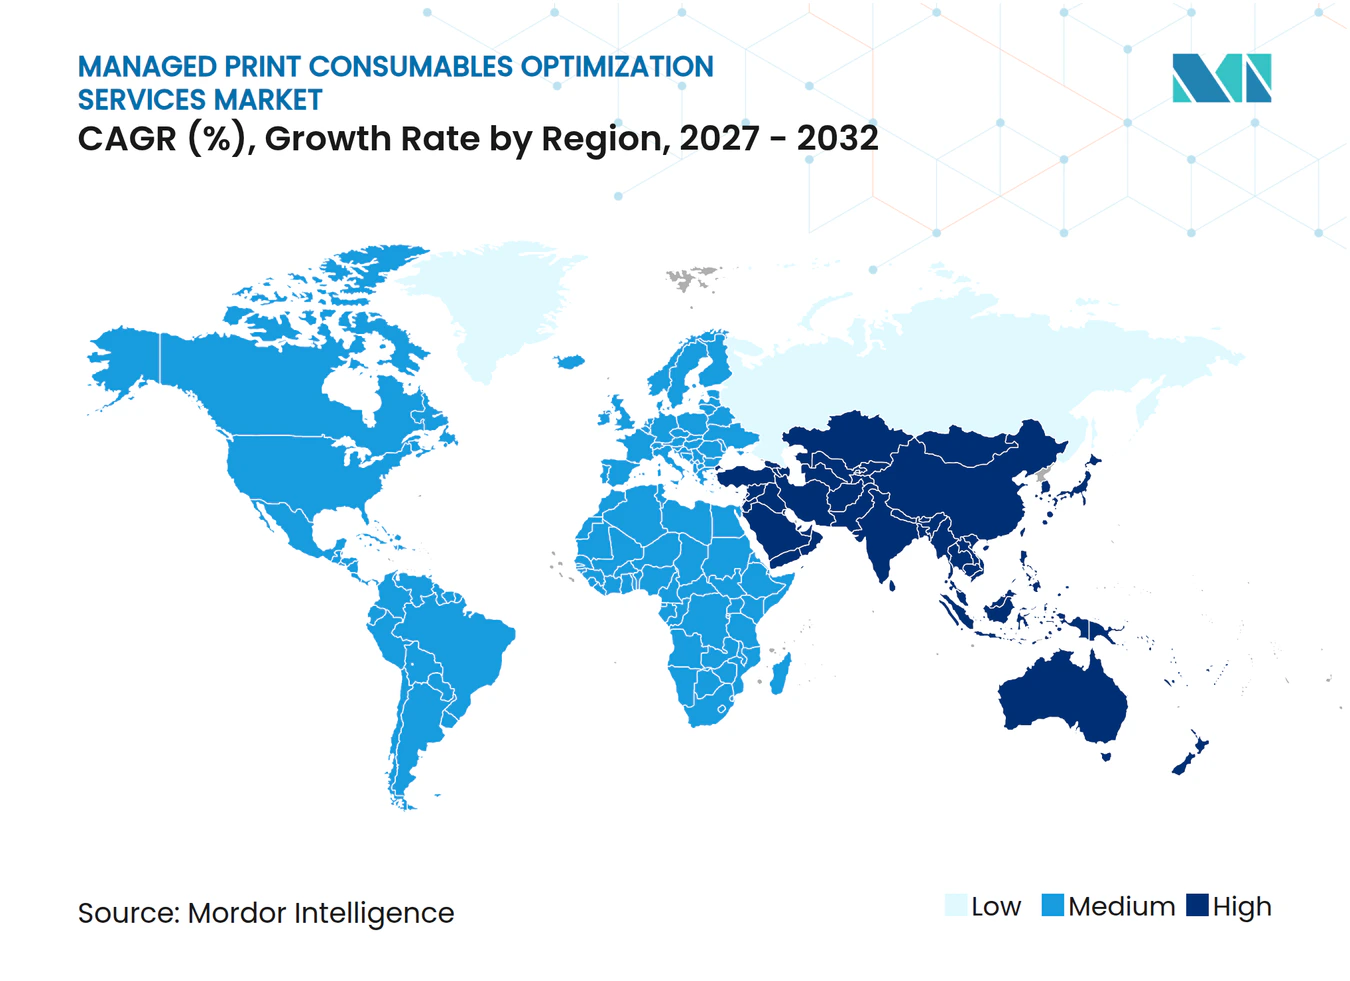
- By geography, North America held 39.04% of revenue in 2026, while Asia-Pacific is projected to expand at a 7.09% CAGR through 2032.
Note: Market numbers in this report are based on Mordor Intelligence's proprietary estimation framework, which combines nine months of actuals with Q4 projections for base year 2026.
Market Trends and Insights
Drivers Impact Analysis of Managed Print Consumables Optimization Services Market*
| Driver | (~) % Impact on CAGR Forecast | Geographic Relevance | Impact Timeline |
|---|---|---|---|
| Expansion of Cloud-Based and Hybrid Managed Print Environments | +2.0% | Global, with North America and Western Europe leading adoption and spillover to Asia-Pacific and the Middle East | Short term (≤ 2 years) |
| Demand for Automated Consumables Replenishment | +1.8% | Global, concentrated in North American and Asia-Pacific enterprise markets | Medium term (2-4 years) |
| Rising Enterprise Focus on Cost-Per-Page Visibility | +1.3% | North America and Europe, with early gains in India and South Korea | Medium term (2-4 years) |
| Sustainability Requirements for Cartridge Recovery and Waste Reduction | +0.8% | Europe, North America, with spillover to the Middle East, Africa, and Asia-Pacific | Long term (≥ 4 years) |
| Toner-Coverage Analytics Reducing Premature Cartridge Replacement | +0.5% | North America and Western Europe, concentrated in large enterprise accounts | Medium term (2-4 years) |
| Remote-Work Fleet Fragmentation Increasing Distributed Supply Optimization Needs | +0.4% | Global, most acute in North America and the United Kingdom | Short term (≤ 2 |
| Source: Mordor Intelligence | |||
Expansion of Cloud-Based and Hybrid Managed Print Environments
Cloud and hybrid environments are changing how customers manage print infrastructure and associated supplies. Y Soft reported that 64.8% of new managed print deployments were cloud-based in 2026, while 76% of IT teams had migrated or planned to migrate print to the cloud within 3 years. Moving administration away from local servers can reduce the infrastructure burden on internal IT teams. The managed print consumables optimization services market benefits because centralized data can combine usage signals from locations that previously operated separately. Hybrid models retain local routing and collection tools while centralizing analytics and replenishment controls. This approach is useful for regulated organizations that need centralized visibility but cannot move every print-related record off-site.
Demand for Automated Consumables Replenishment
Automated replenishment is becoming a normal part of enterprise-managed print contracts. Meter readings and device alerts allow providers to schedule supplies against actual usage rather than a fixed monthly estimate. This model can reduce emergency purchasing and limit excess stock held at individual sites. Lexmark’s managed print infrastructure covered more than 1.5 million devices, indicating the scale at which connected fleet data can support supply planning. The managed print consumables optimization services market, therefore, has an opportunity to link replenishment with inventory pooling across offices and branches. Better order timing can also reduce the avoidable replacement of partly used cartridges.
Rising Enterprise Focus on Cost-Per-Page Visibility
Cost-per-page reporting gives procurement, finance, and IT teams a clearer view of how printing costs vary across devices, departments, and user groups. Providers can use this information to apply duplex defaults, limit unnecessary color output, and route work to lower-cost devices. Y Soft reported that secure print release reduced unnecessary pages by an average of 13% across its telemetry base of 91,000 devices. The managed print consumables optimization services market can use such controls to position consumables management as part of wider cost governance. Customers can then assess fleet changes before committing to a renewal or equipment replacement. The value proposition is strongest when data leads to actions that can be measured within an existing contract.
Sustainability Requirements for Cartridge Recovery and Waste Reduction
Sustainability requirements are making cartridge recovery a formal part of some procurement programs. The European Commission explains that the Corporate Sustainability Reporting Directive applies phased sustainability reporting requirements to large companies from 2025.[1] Clover Technologies Group reported collecting more than 17.4 million cartridges and parts in 2025 and diverting more than 13.3 million pounds of material from landfill. Katun launched its Katun Collects program with Close the Loop in October 2025 and targeted annual recovery of more than 50 metric tons of used cartridges from European customers. These programs make recovery evidence more relevant to buyers in the managed print consumables optimization services market that need documented supply-chain practices. They also give independent suppliers a way to compete where circular procurement is important.
Restraints Impact Analysis of Managed Print Consumables Optimization Services Market*
| Restraint | (~) % Impact on CAGR Forecast | Geographic Relevance | Impact Timeline |
|---|---|---|---|
| Declining Office Print Volumes and Digital Document Substitution | -0.9% | Global, most acute in North America and Western Europe | Long term (≥ 4 years) |
| OEM Cartridge Authentication and Proprietary Ecosystem Lock-In | -0.5% | Global, concentrated in OEM-dominant enterprise accounts | Medium term (2-4 years) |
| Inconsistent Device Telemetry Across Mixed-Vendor Fleets | -0.3% | Global, concentrated in large multi-vendor enterprise fleets | Medium term (2-4 years) |
| Reverse-Logistics Complexity for Used Cartridges and Cross-Border Recovery | -0.2% | Europe and Asia-Pacific, where extended producer responsibility frameworks apply | Long term (≥ 4 years) |
| Source: Mordor Intelligence | |||
Declining Office Print Volumes and Digital Document Substitution
Digital document workflows reduce the volume of pages that require physical output and consumables. This pressure is most visible in organizations with established cloud programs and remote or hybrid work models. The managed print consumables optimization services market still has a role in print environments that require security, availability, and cost control. Providers that charge only by page volume are more exposed to declining output. Device-based management fees, software subscriptions, and workflow services can reduce this dependence. Mid-sized organizations with legacy document processes may face the largest adjustment as digitization removes entire use cases rather than simply reducing page counts.
OEM Cartridge Authentication and Proprietary Ecosystem Lock-In
Authentication mechanisms in proprietary cartridges can limit the use of compatible and remanufactured alternatives. This restricts procurement flexibility for customers whose fleets are concentrated on a single device brand. Independent platforms may identify a potential saving but still be unable to change the source of supply. Brother redesigned its liquid ink cartridges in December 2025 using blow molding to simplify cleaning and reduce labor costs by 15%, demonstrating a move toward more reusable product design. Product redesigns that make reuse easier could improve remanufacturing options over time. Until then, compatibility rules remain a practical constraint on multi-source consumables strategies in the managed print consumables optimization services market.
*Our forecasts treat driver/restraint impacts as directional, not additive. The impact forecasts reflect baseline growth, mix effects, and variable interactions.
Managed Print Consumables Optimization Services Market Segment Analysis
By Service Type:
Replenishment Leads Revenue While Forecasting AdvancesAutomated replenishment and order management held 35.53% of the managed print consumables optimization services market share in 2026. Its scale reflects the established use of IoT-based toner monitoring in large fleets that require continuity of supply. Service agreements can use device data to prompt replacement before a cartridge is exhausted. Demand forecasting and usage analytics are projected to expand at a 7.11% CAGR through 2032. This service converts telemetry into consumption expectations over the next 30 to 90 days. The managed print consumables optimization services market size for forecasting is supported by procurement teams seeking more predictable supply costs.
Consumables monitoring and meter collection provide the underlying data for the broader service stack. They are especially relevant where clients require auditable records of toner spending. Inventory optimization and stock pooling can help organizations manage buffers across several print rooms or sites. Fulfillment and last-mile delivery are also becoming service differentiators in healthcare and financial services procurement. Same-day delivery commitments can matter where a device outage disrupts routine documentation. Providers that connect forecasting and fulfillment can build closer client relationships than those offering only one service component.



By Consumables Type:
Toner Cartridges Support Revenue While Ink-Tank Bottles AdvanceToner cartridges accounted for 48.89% of revenue in 2026. Laser-based multifunction devices remain common in BFSI, government, and manufacturing settings that produce substantial text output. Toner lifecycle management in the managed print consumables optimization services market includes coverage analysis, depletion forecasting, and yield verification. These tasks give providers a broad installed base for service contracts. Ink-tank bottles are projected to expand at a 6.71% CAGR through 2032. Their adoption is linked to high-yield systems used by small businesses and remote workers.
Ink cartridges remain relevant in creative, marketing, and field-sales settings where color quality and portability matter. Imaging drums and imaging units are recurring expenses that can be planned using page-volume and toner-coverage data. Environmental reporting requirements can also influence how clients choose supplies and recovery partners. In June 2025, Katun expanded its remanufactured lineup by 38 products for multifunction and A4 printers. The managed print consumables optimization services industry can use documented recovery programs to support contracts that include recycled-content or recovery requirements.
By Deployment Mode:
Cloud-Based Services Lead Both Revenue and ExpansionCloud-based deployment accounted for 43.96% of revenue in 2026 and is projected to expand at a 6.69% CAGR through 2032. This dual position shows that cloud services are moving beyond early adoption in print management. Y Soft reported that 84% of on-premise installations had not been updated in 12 or more months. Aging installations can increase the appeal of cloud services that remove server administration. The managed print consumables optimization services market gains from this shift because connected platforms can centralize use data and automate supply actions.
Hybrid deployment remains important for healthcare, financial services, and government users. Local gateways can handle routing while cloud systems manage analytics and replenishment triggers. On-premise systems also retain a role in air-gapped environments and critical infrastructure. This means cloud adoption does not remove the need for multi-architecture support. Providers need to operate across on-premise, cloud, and hybrid fleets within a single contract. That capability has become a practical requirement for many large accounts.
By Organization Size:
Large Enterprises Hold Revenue While SMEs Gain AccessLarge enterprises held 76.97% of revenue in 2026. Multi-site fleets in the managed print consumables optimization services market create the device data and contract complexity needed to justify advanced optimization programs. Hundreds of devices can generate sufficient usage data to improve depletion forecasts. Large contracts also tend to require integration across multiple vendor environments. Small and medium-sized enterprises are projected to expand at a 6.52% CAGR through 2032. Cloud delivery removes the infrastructure cost that previously limited access for smaller fleets.
Subscription packages can combine monitoring, replenishment, and analytics through a per-device monthly charge. This structure reduces the commitment required from organizations operating only a few print rooms. Smaller clients need simpler onboarding, self-service dashboards, and lighter account support than large enterprises. Large enterprises still generate higher revenue per device because they need more complex analytics and fleet support. That supports their continued revenue leadership. The managed print consumables optimization services market is therefore broadening its client base without removing the importance of large accounts.

By End-User Vertical:
BFSI Holds Revenue While Healthcare ExpandsBFSI held 15.03% of revenue in 2026. Branch networks, document-heavy processes, and printed audit trails support sustained demand for managed supplies. Meter collection in the managed print consumables optimization services market can allocate costs by branch and cost center with greater consistency than manual processes. Healthcare is projected to expand at a 7.89% CAGR through 2032. Health systems use consumables monitoring where printer availability affects documentation workflows. The U.S. Department of Health and Human Services identifies physical safeguards as part of the HIPAA Security Rule framework.
IT and telecom buyers can assess telemetry quality and replenishment performance against internal data practices. Government and public administration provide a stable demand through framework agreements. The UK Crown Commercial Service awarded its Multifunctional Devices, GovPrint Hardware, Managed Print Services, and Digital Workflow Software Services framework in September 2025. Education is extending programs across campus and home environments as hybrid learning continues. Manufacturing users can incorporate print monitoring into broader asset management activities. These vertical differences require providers to adjust their service design, security controls, and fulfillment approach.
Geography Analysis
North America Managed Print Consumables Optimization Services Market
North America held 39.04% of the managed print consumables optimization services market share in 2026. The managed print consumables optimization services market in the region benefits from mature outsourcing practices and a dense base of BFSI, healthcare, and government organizations. Federal and state procurement structures can support long-term fleet agreements. Ricoh USA renewed its University of California system-wide managed print agreement for 5 years beginning January 26, 2026.[2] These arrangements reward vendors that can provide broad monitoring and replenishment coverage. Canada and Mexico can offer expansion opportunities where enterprise clients seek consistent fleet management across North American operations.
APAC Managed Print Consumables Optimization Services Market
Asia-Pacific is projected to expand at a 7.09% CAGR through 2032. Expanding commercial device fleets and fleet consolidation efforts are supporting demand in China, India, South Korea, and Southeast Asia. India’s hybrid office environment continues to require a combination of physical document workflows and digital capture. Japanese manufacturers place value on waste reduction and cost traceability at production sites. HP and Visionet Data Internasional launched a managed print services partnership in Indonesia in April 2026. OEM-led partnerships can help address service infrastructure constraints across Southeast Asian markets.
EMEA and South America Managed Print Consumables Optimization Services Market
Europe is shaped by reporting and recovery requirements, which increase the importance of documentation for consumables. The Corporate Sustainability Reporting Directive gives large companies a structured basis for sustainability reporting. South America, the Middle East, and Africa are at earlier stages of managed print adoption. Their demand is supported by OEM distribution partnerships and multinational clients extending programs from parent operations. Ricoh Europe announced a strategic realignment of Ricoh South Africa in October 2025 to expand direct service capability. Local service capacity can be important where clients need support for compliance-focused print operations.
Competitive Landscape
Market Concentration
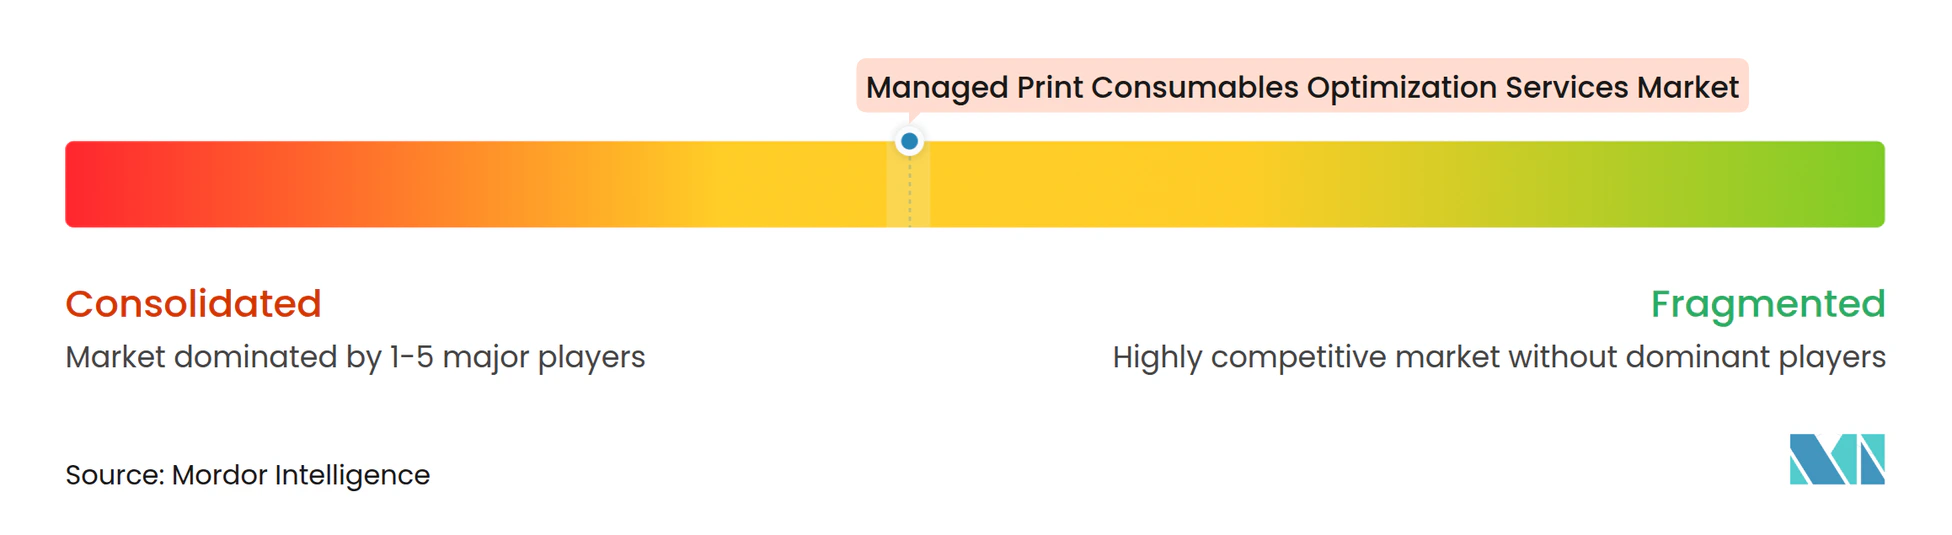
The managed print consumables optimization services market is moderately concentrated. In the managed print consumables optimization services market, global OEM-linked providers manage large fleet portfolios, while independent remanufacturers, analytics platforms, and regional fulfillment specialists serve a fragmented middle tier. Xerox completed its acquisition of Lexmark in July 2025 for USD 1.5 billion, including net debt and liabilities.[3] The transaction combined Xerox’s enterprise service infrastructure with Lexmark’s fleet-management and analytics capabilities. Xerox then announced an expanded A3 portfolio under a unified commercial approach in March 2026.
HP, Canon, Konica Minolta, Ricoh, and Kyocera compete through direct device-to-cloud integration and bundled service contracts. Those arrangements can create switching costs because hardware, supplies, and fleet support are connected. Visual Edge IT and Konica Minolta formalized a nationwide partnership in July 2026 to expand managed print delivery through Visual Edge IT’s dealer network in the United States. Konica Minolta also made its KPAX managed print services solution available to authorized dealers in January 2025. These moves show how OEMs can broaden service reach through regional partners.
Independent suppliers can compete by combining multi-vendor analytics with recovery programs and flexible fulfillment. Clover and Katun use recycling and remanufacturing programs to address public-sector and sustainability-oriented procurement. Analytics providers seek to normalize telemetry across mixed fleets without requiring customers to change installed hardware. This approach can make analytics portable across devices that use different OEM ecosystems. Providers also compete on their ability to connect recovery records with cost reporting. The managed print consumables optimization services industry has room for suppliers that can provide auditable lifecycle records alongside day-to-day supply optimization.
Managed Print Consumables Optimization Services Industry Leaders
-
HP Inc.
-
Seiko Epson Corporation
-
Canon Inc.
-
Brother Industries, Ltd.
-
Pantum International Limited
- *Disclaimer: Major Players sorted in no particular order
Managed Print Consumables Optimization Services Market Companies Covered in this Report
- HP Inc.
- Canon Inc.
- Seiko Epson Corporation
- Brother Industries, Ltd.
- Xerox Corporation
- Ricoh Company, Ltd.
- Konica Minolta, Inc.
- Kyocera Corporation
- Sharp Corporation
- FUJIFILM Business Innovation Corp.
- Toshiba Tec Corporation
- OKI Electric Industry Co., Ltd.
- Lexmark International, Inc.
- Pantum International Limited
- Ninestar Corporation
- Static Control Components, Inc.
- Clover Technologies Group, LLC
- LMI Solutions, Inc.
- Print-Rite Holdings Limited
- Apex Microelectronics Co., Ltd.
Recent Industry Developments in Managed Print Consumables Optimization Services Market
- July 2026: Visual Edge IT and Konica Minolta formalized a nationwide strategic partnership expanding managed print services delivery across Visual Edge IT's multi-state dealer network in the United States, signaling accelerating consolidation among regional managed print resellers and deepening OEM-to-reseller distribution for mid-market accounts.
- April 2026: HP and Visionet Data Internasional launched a managed print services partnership in Indonesia, targeting enterprise operational complexity across Southeast Asia's largest economy and extending HP's OEM-integrated optimization portfolio into a market where direct service delivery has historically been infrastructure-constrained.
- March 2026: Xerox Corporation formalized its integrated go-to-market strategy post-Lexmark acquisition, announcing an expanded A3 product portfolio under a unified commercial approach that combines Xerox's enterprise service infrastructure with Lexmark's IoT-enabled fleet management and analytics capabilities.
- January 2026: Ricoh USA renewed its University of California system-wide managed print agreement for a 5-year term beginning January 26, 2026, covering consumables optimization across one of North America's largest higher-education device fleets and reinforcing long-term institutional procurement as a high-value revenue channel.
Global Managed Print Consumables Optimization Services Market Report Scope
The managed print consumables optimization services market refers to the industry that provides specialized services and solutions to help organizations monitor, forecast, procure, manage, and replenish printing consumables efficiently across their printer and multifunction device fleets. These services leverage usage monitoring, demand forecasting, analytics, automated ordering, inventory optimization, and delivery coordination to reduce consumables waste, minimize stockouts, control printing costs, and improve supply chain efficiency.
The Managed Print Consumables Optimization Services Market Report is Segmented by Service Type (Consumables Monitoring and Meter Collection, Demand Forecasting and Usage Analytics, Automated Replenishment and Order Management, Inventory Optimization and Stock Pooling, Fulfillment and Last-Mile Delivery, and Other Service Types), Consumables Type (Toner Cartridges, Ink Cartridges, Ink-Tank Bottles, Imaging Drums and Imaging Units, and Other Consumables Type), Deployment Mode (On-Premise, Cloud-Based, and Hybrid), Organization Size (Large Enterprises and Small and Medium-Sized Enterprises), End-User Vertical (BFSI, Healthcare, IT and Telecom, Government and Public Administration, Education, Manufacturing, and Other End-User Verticals), and Geography (North America, South America, Europe, Asia-Pacific, Middle East, and Africa). The Market Forecasts are Provided in Terms of Value (USD).
Segmentation Overview
| Consumables Monitoring and Meter Collection |
| Demand Forecasting and Usage Analytics |
| Automated Replenishment and Order Management |
| Inventory Optimization and Stock Pooling |
| Fulfillment and Last-Mile Delivery |
| Other Service Types |
| Toner Cartridges |
| Ink Cartridges |
| Ink-Tank Bottles |
| Imaging Drums and Imaging Units |
| Other Consumables Type |
| On-Premise |
| Cloud-Based |
| Hybrid |
| Large Enterprises |
| Small and Medium-Sized Enterprises |
| BFSI |
| Healthcare |
| IT and Telecom |
| Government and Public Administration |
| Education |
| Manufacturing |
| Other End-User Verticals |
| North America | United States |
| Canada | |
| Mexico | |
| South America | Brazil |
| Argentina | |
| Chile | |
| Rest of South America | |
| Europe | Germany |
| United Kingdom | |
| France | |
| Italy | |
| Spain | |
| Russia | |
| Rest of Europe | |
| Asia-Pacific | China |
| Japan | |
| India | |
| South Korea | |
| Australia | |
| Southeast Asia | |
| Rest of Asia-Pacific | |
| Middle East | Turkey |
| Saudi Arabia | |
| United Arab Emirates | |
| Israel | |
| Rest of Middle East | |
| Africa | South Africa |
| Egypt | |
| Nigeria | |
| Kenya | |
| Rest of Africa |
| By Service Type | Consumables Monitoring and Meter Collection | |
| Demand Forecasting and Usage Analytics | ||
| Automated Replenishment and Order Management | ||
| Inventory Optimization and Stock Pooling | ||
| Fulfillment and Last-Mile Delivery | ||
| Other Service Types | ||
| By Consumables Type | Toner Cartridges | |
| Ink Cartridges | ||
| Ink-Tank Bottles | ||
| Imaging Drums and Imaging Units | ||
| Other Consumables Type | ||
| By Deployment Mode | On-Premise | |
| Cloud-Based | ||
| Hybrid | ||
| By Organization Size | Large Enterprises | |
| Small and Medium-Sized Enterprises | ||
| By End-User Vertical | BFSI | |
| Healthcare | ||
| IT and Telecom | ||
| Government and Public Administration | ||
| Education | ||
| Manufacturing | ||
| Other End-User Verticals | ||
| By Geography | North America | United States |
| Canada | ||
| Mexico | ||
| South America | Brazil | |
| Argentina | ||
| Chile | ||
| Rest of South America | ||
| Europe | Germany | |
| United Kingdom | ||
| France | ||
| Italy | ||
| Spain | ||
| Russia | ||
| Rest of Europe | ||
| Asia-Pacific | China | |
| Japan | ||
| India | ||
| South Korea | ||
| Australia | ||
| Southeast Asia | ||
| Rest of Asia-Pacific | ||
| Middle East | Turkey | |
| Saudi Arabia | ||
| United Arab Emirates | ||
| Israel | ||
| Rest of Middle East | ||
| Africa | South Africa | |
| Egypt | ||
| Nigeria | ||
| Kenya | ||
| Rest of Africa | ||
Key Questions Answered in the Report
What is the managed print consumables optimization services market size?
The managed print consumables optimization services market size is USD 4.18 billion in 2026 and is projected to reach USD 6.78 billion by 2032 at an 8.39% CAGR. The forecast reflects the wider use of connected monitoring, automated replenishment, and cloud delivery.
What services are central to managed print consumables optimization?
Consumables monitoring, usage analytics, automated replenishment, inventory optimization, and last-mile fulfillment are central service areas. Combined delivery helps clients connect supply decisions with live fleet information.
Which consumable category has the largest revenue share?
Toner cartridges accounted for 48.89% of revenue in 2026 because laser-based devices remain widely used in enterprise fleets. Ink-tank bottles are projected to expand fastest at a 6.71% CAGR through 2032.
Why are cloud-based print services gaining adoption?
Cloud delivery centralizes fleet data, can reduce server costs, and supports automated supply decisions across dispersed locations. It also supports smaller organizations that do not want to maintain local print infrastructure.
Which end-user vertical is projected to expand fastest?
Healthcare is projected to expand at a 7.89% CAGR through 2032 as health systems link monitoring with documentation workflows. BFSI held the largest reported vertical share at 15.03% in 2026.
Which region is projected to expand fastest?
Asia-Pacific is projected to expand at a 7.09% CAGR through 2032, supported by expanding commercial fleets and regional partnerships. North America held 39.04% of revenue in 2026.