
Machine To Machine (M2M) Services Market Size and Share
Market Overview
| Study Period | 2020 - 2031 |
|---|---|
| Market Size (2026) | USD 62.99 Billion |
| Market Size (2031) | USD 102.12 Billion |
| Growth Rate (2026 - 2031) | 10.16 % |
| Fastest Growing Market | Middle East |
| Largest Market | Asia Pacific |
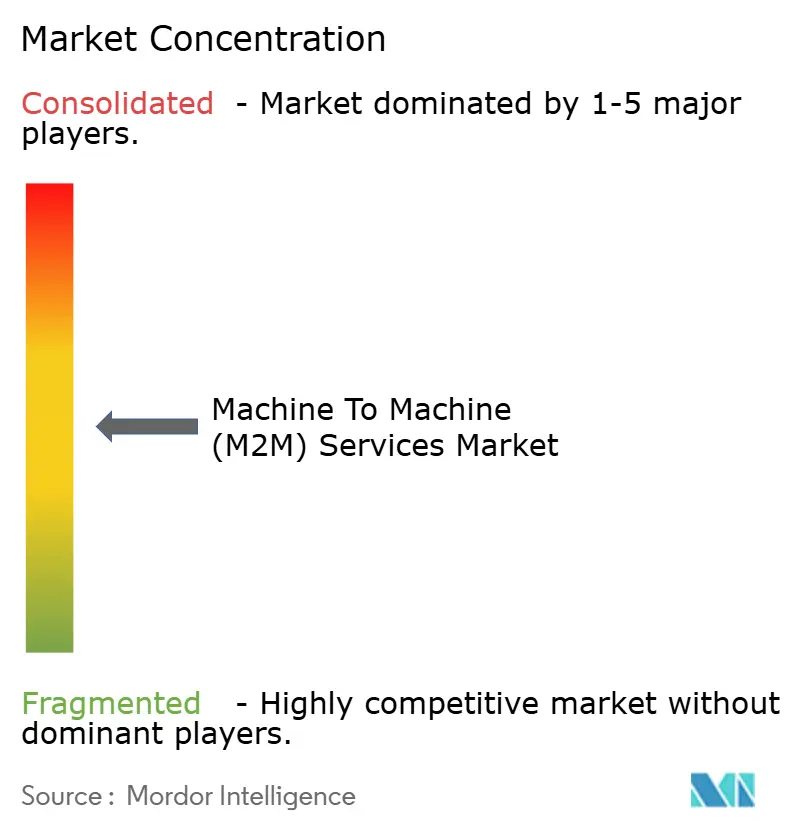
| Market Concentration | Medium |
Major Players *Disclaimer: Major Players sorted in no particular order Image © Mordor Intelligence. Reuse requires attribution under CC BY 4.0. | |
Machine To Machine (M2M) Services Market Analysis by Mordor Intelligence
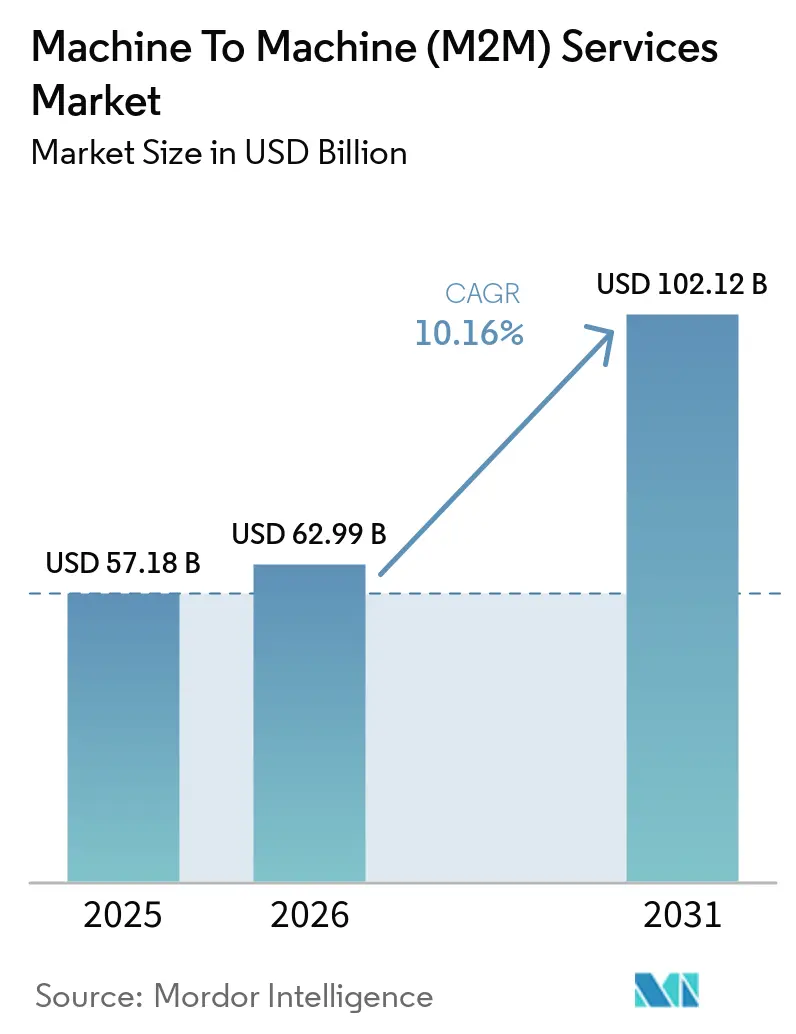
The Machine To Machine (M2M) Services Market size is expected to grow from USD 57.18 billion in 2025 to USD 62.99 billion in 2026 and is forecast to reach USD 102.12 billion by 2031 at 10.16% CAGR over 2026-2031. Growth rests on accelerated 5G and low-power wide-area rollouts, utility and automotive regulations that force connected-endpoint deployment, and subscription-based business models that shift spending from capital to operating budgets. Enterprises now favor secure, global eSIM footprints that reduce logistics costs and enable carrier switching, while edge analytics embedded in gateways lift average revenue per connection through higher-value services. Managed-service vendors capitalize on multiyear contracts that bundle connectivity, device lifecycle management, and cybersecurity guarantees, yet specialist MVNOs sustain pricing pressure by offering flat-rate plans that remove bill-shock risk for global fleets. Integration complexity and tightening data-privacy rules remain the limiting factors, driving demand for professional services and regional data-sovereignty architectures across the Machine To Machine (M2M) Services Market.
Key Report Takeaways
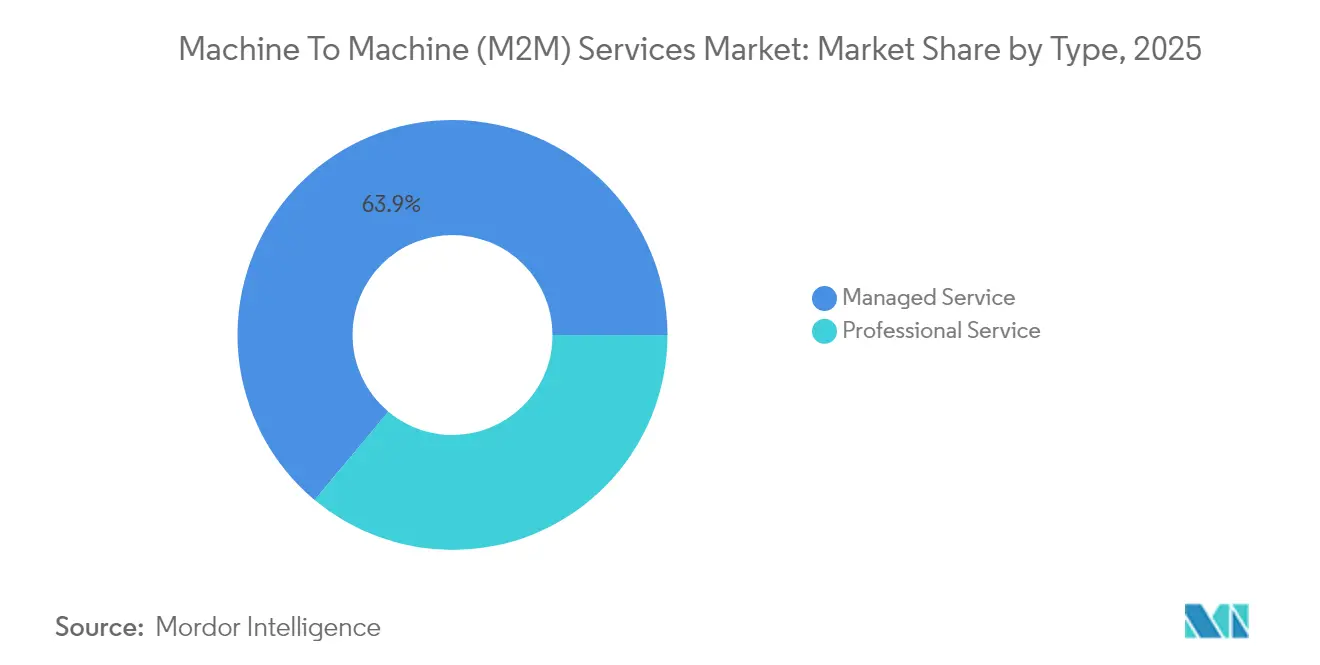
- By service type, managed services led with 63.92% of machine to machine (M2M) services market share in 2025; professional services are forecast to expand at a 12.52% CAGR through 2031.
- By connectivity technology, cellular networks captured 73.90% revenue in 2025, while LPWAN alternatives are poised to grow at a 13.05% CAGR to 2031.
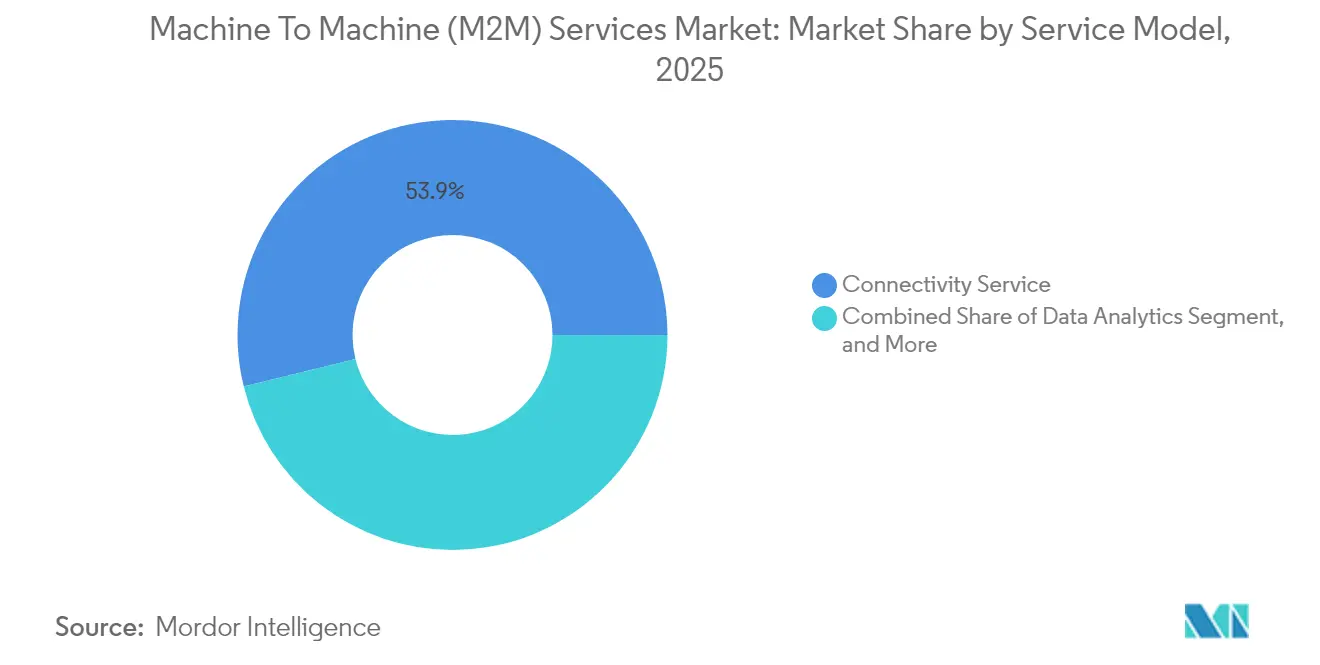
- By service model, connectivity services generated 53.85% revenue in 2025; data management and analytics are advancing at an 11.63% CAGR through 2031.
- By end user, automotive applications commanded 29.35% of 2025 demand, whereas healthcare connections are projected to rise at a 12.37% CAGR to 2031.
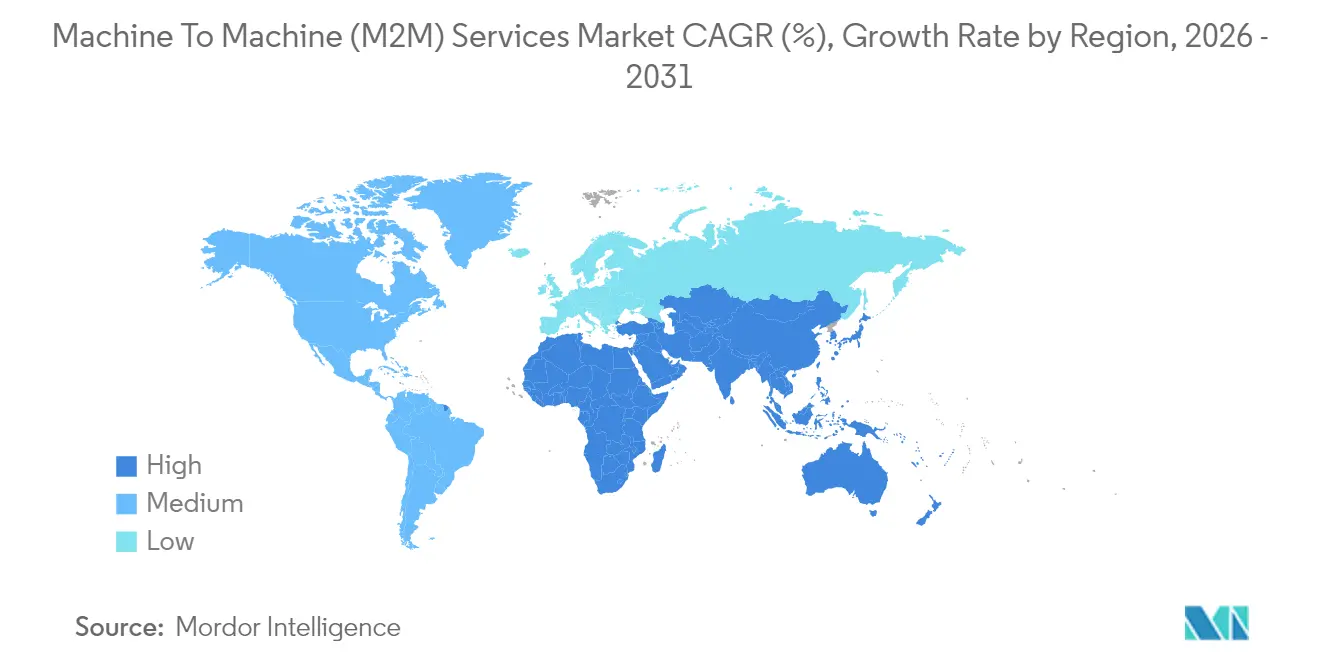
- By geography, Asia Pacific accounted for 37.88% of 2025 revenue, and the Middle East is on track for a 13.34% CAGR between 2026 and 2031.
Note: Market size and forecast figures in this report are generated using Mordor Intelligence’s proprietary estimation framework, updated with the latest available data and insights as of 2026.
Market Trends and Insights
Drivers Impact Analysis of Machine To Machine (M2M) Services Market*
| Driver | (~) % Impact on CAGR Forecast | Geographic Relevance | Impact Timeline |
|---|---|---|---|
| Proliferation of LPWAN and 5G Networks | +2.1% | Global, with Asia Pacific and Middle East leading standalone 5G rollouts | Medium term (2-4 years) |
| Surge in Global IoT Device Deployments | +2.5% | Global, concentrated in North America, Europe, and Asia Pacific manufacturing hubs | Short term (≤ 2 years) |
| Adoption of Managed Connectivity Platforms | +1.4% | North America and Europe enterprise segments, expanding to Asia Pacific | Medium term (2-4 years) |
| Regulatory Mandates for Smart Metering and e-Call | +1.8% | Europe (eCall), North America and Asia Pacific (smart meters), Middle East utilities | Long term (≥ 4 years) |
| AI-Driven Edge Analytics for Predictive Maintenance | +1.3% | North America and Europe industrial sectors, Asia Pacific manufacturing | Medium term (2-4 years) |
| Demand for End-to-End Subscription-Based Solutions | +1.2% | Global, particularly North America SaaS-mature enterprises | Short term (≤ 2 years) |
| Source: Mordor Intelligence | |||
Proliferation of LPWAN and 5G Networks
Standalone 5G cores now operate in 47 countries, enabling network slices that guarantee sub-10 millisecond latency for robotics and autonomous vehicles while reserving low-cost NB-IoT slices for massive sensor traffic. China Mobile closed 2024 with 230 million NB-IoT connections and average monthly revenue per unit near CNY 2 (USD 0.28). In Europe, 34% of enterprises specified LPWAN for new deployments in 2024, up from 22% the prior year, reflecting demand for 10-year battery life in agriculture and environmental monitoring.[1]Vodafone Business, “IoT Barometer 2024,” vodafone.com As chipset prices for 5G RedCap modules approach LTE-M parity by 2026, the M2M services market will expand into uplink-intensive video surveillance within 1 watt power budgets. Operators are already monetizing spectrum assets by offering tiered slices that match latency and throughput classes to industrial use cases, reinforcing cellular primacy while acknowledging LPWAN economics.
Surge in Global IoT Device Deployments
GSMA Intelligence tracked 17.5 billion IoT connections worldwide by year-end 2024, of which 3.2 billion used licensed cellular networks.[2]GSMA Intelligence, “IoT Connections Tracker 2024,” gsma.com Automotive telematics added 120 million new cellular links during 2024 as insurers in North America and Europe adopted usage-based premiums that cut rates up to 30% for data-sharing drivers. India’s Advanced Metering Infrastructure program deployed 50 million smart electric meters, each bundled with 15-year cellular contracts that guarantee predictable revenue for service providers. Device heterogeneity complicates scale: a single smart-city project can encompass 200 hardware models and 40 firmware tracks, increasing demand for unified device-management platforms. The M2M services market benefits when enterprises outsource this complexity to managed-service vendors that can provision, monitor, and secure multivendor fleets under service-level agreements.
Adoption of Managed Connectivity Platforms
Enterprises aim to streamline billing, roaming, and security by sourcing connectivity through global eSIM orchestration rather than juggling multiple carrier contracts. 1NCE’s flat-rate plan of EUR 10 (USD 11) for 10 years and 500 MB has attracted 10 million active lines and a 95% retention rate by mid-2024. Large operators answer with cloud-native control centers that expose APIs for bulk provisioning and diagnostics, reducing average onboarding time from weeks to hours. As connectivity becomes commoditized, platform vendors upsell traffic analytics, anomaly detection, and policy-based security, lifting average revenue per user even as per-megabyte tariffs erode. The managed-platform shift widens the addressable base of the M2M services market by allowing smaller enterprises to launch connected products without building in-house network operations.
Regulatory Mandates for Smart Metering and e-Call
The European Union’s eCall directive achieved full fleet penetration in 2024, embedding 15 million modules annually that require 15-year contracts and enable recurring service income for automotive OEMs. California utilities finished rolling out 16 million LTE-M smart meters under Public Utilities Commission rules, each transmitting consumption data every 15 minutes. Saudi Arabia’s NEOM project specifies 1 million IoT endpoints to be installed by 2028, underpinning double-digit growth in the Middle East. Data-residency mandates such as GDPR and China’s Personal Information Protection Law compel service providers to localize storage and processing, fragmenting global platforms into regional instances. Compliance transforms connectivity from optional to compulsory, accelerating deployment schedules and enlarging the M2M services market.
Restraints Impact Analysis of Machine To Machine (M2M) Services Market*
| Restraint | (~) % Impact on CAGR Forecast | Geographic Relevance | Impact Timeline |
|---|---|---|---|
| Fragmented Interoperability Standards | -1.3% | Global, especially Europe and North America multi-vendor projects | Medium term (2-4 years) |
| Escalating Cybersecurity and Data-Privacy Risks | -1.6% | Global, with tight regulation in Europe (GDPR) and North America | Short term (≤ 2 years) |
| High Initial Integration and Deployment Costs | -0.9% | Emerging markets across Asia Pacific, Latin America, and Africa | Medium term (2-4 years) |
| Shortage of M2M-Skilled Workforce | -0.7% | Africa, Latin America, Southeast Asia | Long term (≥ 4 years) |
| Source: Mordor Intelligence | |||
Escalating Cybersecurity and Data-Privacy Risks
The U.S. Cybersecurity and Infrastructure Security Agency logged 47 public IoT breaches in 2024, up from 29 the prior year, with median remediation expenses of USD 2.8 million. GDPR violations can reach 4% of global revenue, motivating enterprises to demand hardware secure elements, zero-trust architectures, and 72-hour breach-notification processes. The U.S. FDA now requires software bill-of-materials disclosures for connected medical devices, extending certification cycles by up to nine months. Cyber-insurance underwriters fold these mandates into premium calculations, adding USD 3 to USD 8 to each device bill of materials. As a result, security-service attach rates exceeded 20% in regulated verticals during 2024. Providers that can bundle certified encryption, continuous monitoring, and over-the-air patching will gain share, whereas vendors lacking compliance credentials face procurement exclusion, tempering the overall CAGR of the M2M services market.
Fragmented Interoperability Standards
Enterprises deploying multi-vendor fleets wrestle with incompatible OneM2M, ETSI, and GSMA specifications, which inflate testing budgets and burn project timelines. An Industrial Internet Consortium study found that 61% of manufacturers experienced integration cycles longer than 18 months, with 40% of budgets devoted to interoperability validation. Although ETSI began aligning its framework with OneM2M in 2024, legacy sensor nodes certified under earlier revisions will remain active beyond 2035, prolonging fragmentation. Vendors are shipping protocol-translation gateways and unified APIs to mask heterogeneity, but these layers raise latency and operations costs. The M2M services market suffers when enterprises delay rollouts until standards stabilize, making harmonization initiatives pivotal for sustaining double-digit growth.
*Our forecasts treat driver/restraint impacts as directional, not additive. The impact forecasts reflect baseline growth, mix effects, and variable interactions.
Machine To Machine (M2M) Services Market Segment Analysis
By Type:
Managed Services Dominate, Professional Services AccelerateManaged services generated 63.92% of 2025 revenue as enterprises outsourced SIM lifecycle management, roaming optimization, and regulatory compliance, underscoring the maturity of the machine to machine (M2M) services market. Professional services deliver integration, application development, and training; they are projected to expand at a 12.52% CAGR through 2031, reflecting the growing need to mesh legacy SCADA, ERP, and MES systems with cloud-native analytics. Large energy firms are commissioning global eSIM rollouts that bundle three-year managed connectivity contracts with six-month professional-services engagements to ensure smooth migration from 2G telemetry to LTE-M gateways. The gross-margin profile favors professional engagements at more than 50%, yet vendors temper volatility by coupling them with recurring connectivity revenue. Workforce-development modules address adoption hurdles; vendors frequently embed operator training and change-management workshops within statements of work to cut project-failure risk and cement multiyear renewals.
In year-two and beyond, managed-service buyers often graduate to professional engagements that optimize data pipelines and integrate AI inference engines at the edge. This cross-sell dynamic prolongs customer lifetime value and lifts the blended profitability of the machine to machine (M2M) services market. Providers that automate onboarding, diagnostics, and billing through self-service portals can serve thousands of small accounts at marginal cost, freeing engineering talent for high-value professional projects. As emerging regulations demand real-time compliance reporting, managed-service portfolios that embed security analytics and regional data-sovereignty options will command premium pricing.



By Connectivity Technology:
Cellular Dominance Faces LPWAN DisruptionCellular connections captured 73.90% of 2025 revenue, anchored by LTE-M and NB-IoT deployments in automotive, utilities, and logistics, driving demand for cellular M2M solutions. The looming sunset of 2G and 3G services forces fleet owners to retrofit modems at USD 150-USD 300 per unit, creating a short-term uplift for module vendors and operators. LPWAN technologies such as LoRaWAN and Sigfox reached 170 countries, offering 10-year battery life and sub-USD 5 modules that appeal to agriculture and environmental monitoring. LoRa-enabled device shipments passed 300 million in 2024. Satellite IoT grew 18% year-over-year as maritime, aviation, and mining customers embraced hybrid terminals that default to cellular but switch to L-band or low-Earth-orbit links when terrestrial coverage fades.
Competition now centers on 5G RedCap, which promises 100 Mbps uplinks at reduced cost and power, blurring lines between massive-IoT and broadband categories. The machine to machine (M2M) services market size for cellular connections is expected to remain dominant, yet LPWAN’s 13.05% CAGR through 2031 highlights a strategic shift toward use-case-specific economics rather than a one-size-fits-all approach. Providers positioned with multi-bearer orchestration and intelligent traffic steering will mitigate churn as enterprises adopt connectivity portfolios tailored to latency, bandwidth, and power-consumption constraints.
By Service Model:
Connectivity Leads, Analytics Gains TractionConnectivity services accounted for 53.85% of 2025 revenue, reflecting the historic focus on data plans and SIM provisioning. Data management and analytics are growing at an 11.63% CAGR because enterprises increasingly monetize telemetry via predictive maintenance and dynamic pricing. Application enablement and low-code platforms shorten time-to-market; Cisco’s IoT Control Center pre-integrates with Salesforce, SAP, and Microsoft Azure, cutting deployment timelines from months to weeks. The machine to machine (M2M) services market size for device-management platforms is swelling as firmware-over-the-air updates become mandatory under medical-device and automotive regulations. Security add-ons such as anomaly detection and certificate management lift average revenue per connection while satisfying cyber-insurance prerequisites.
Outcome-based pricing is emerging, whereby providers guarantee equipment uptime or fuel-consumption targets rather than selling gigabytes of data. Such models require deep analytics and domain expertise but lock in customers through performance-linked fees that are hard to compare across vendors. As analytics penetrate edge gateways, connectivity services risk commoditization, making value-added layers essential for margin protection in the machine to machine (M2M) services market.
By End User:
Automotive Leads, Healthcare SurgesAutomotive applications held 29.35% of 2025 demand, fueled by eCall mandates, usage-based insurance, and over-the-air software updates. Remote diagnostics allow OEMs to deploy features post-sale, converting connectivity from cost center to revenue stream. Healthcare exhibits the fastest growth at a 12.37% CAGR, propelled by reimbursement parity for remote patient monitoring under expanded Medicare codes. Each connected glucose sensor or cardiac implant demands secure, always-on links that comply with HIPAA and GDPR. Utilities compose a steady baseline, with national smart-meter rollouts in India, Japan, and the Middle East. Manufacturing uses M2M to cut downtime; Siemens reported a 28% drop in unplanned outages across 1,200 sites after deploying edge analytics.
Logistics fleets integrate telematics for route optimization and cold-chain compliance, reducing spoilage by 15% at shipping lines such as Maersk. Agriculture employs soil sensors and livestock trackers, with John Deere reporting 500,000 connected machines in the field. As reimbursement, safety, and sustainability incentives expand, the machine to machine (M2M) services market will deepen penetration in these verticals, although cybersecurity and data-sovereignty requirements raise entry thresholds for new providers.
Geography Analysis
APAC Machine to Machine (M2M) Services Market
Asia Pacific generated 37.88% of global 2025 revenue, driven by China Mobile’s 230 million NB-IoT lines and India’s Smart Cities Mission, which committed INR 200 billion (USD 2.4 billion) for connected street lighting, waste management, and traffic systems. Japan’s 95% 5G standalone coverage supports robotics pilots in Osaka and Tokyo, while South Korean operators bundle edge computing with connectivity for manufacturing clients.
MEA Machine to Machine (M2M) Services Market
The Middle East is forecast to grow at a 13.34% CAGR through 2031, buoyed by Saudi Arabia’s USD 500 billion NEOM smart-infrastructure program and the UAE’s mandate to install 3 million smart meters by 2025. Africa’s adoption clusters in South Africa, Kenya, and Nigeria, where mobile-money platforms integrate IoT-enabled solar home systems that allow pay-as-you-go financing.
North America, Europe and LATAM Machine to Machine (M2M) Services Market
North America shows mature penetration; Verizon supports 27 million connections, flat year-over-year as 2G/3G sunsets offset new wins. Europe leverages GDPR-driven data-residency requirements that encourage regional players, with Vodafone generating EUR 1.2 billion (USD 1.3 billion) in IoT revenue for fiscal 2024. Latin America’s growth centers on Brazilian agriculture, where NB-IoT links monitor crop moisture and optimize logistics. Collectively, regional mandates and infrastructure investments maintain a healthy demand pipeline that anchors the global machine to machine (M2M) services market.

Regulatory Landscape
Regulation for M2M services is tightening around identity, roaming, and security, with more attention on how foreign SIMs, eSIM profiles, and satellite-to-terrestrial links are used in-country. In India, M2M service providers and WPAN/WLAN connectivity providers for M2M services are required to register via the SaralSanchar portal, reinforcing a licensing-and-registration approach for large-scale device fleets. In December 2025, the Telecom Regulatory Authority of India (TRAI) recommended an International M2M SIM Service Authorisation to govern the sale of foreign SIMs for exported M2M devices, reflecting increased scrutiny of permanent roaming models and cross-border provisioning.
Standards updates are also shaping compliance roadmaps for operators, MVNOs, and platform providers. ITU-T issued multiple IoT and network-interworking recommendations across 2025 and 2026, including Q.5035 (January 2026) for IMT-2020 interconnection signaling with IMS, and Y.4814 (September 2025) covering zero-trust-based access control for IoT platforms. ETSI/oneM2M published an updated oneM2M Security Solutions specification (TS-0003, version 4.7.1) on March 4, 2026, giving procurement teams clearer security baselines for device onboarding, platform access, and lifecycle security in regulated verticals such as utilities, automotive, and healthcare.
Value Chain Analysis
The M2M services value chain starts with connectivity-enabling hardware (chipsets, modules, gateways, and secure elements) and extends through network access (MNOs and specialized MVNOs), eSIM/profile orchestration, device and connectivity management platforms, and value-added layers such as data management, analytics, and managed security. Hyperscalers and enterprise software ecosystems play a major role at the platform and integration layers, while professional services partners handle multi-vendor integration across legacy OT/IT stacks (for example, SCADA, ERP, and MES) and ongoing operations tied to service-level agreements.
Two pressure points increasingly shape how this chain is configured across geographies. First, 2G/3G network sunsets and forced migrations push fleet refresh cycles and increase demand for provisioning automation, device certification, and remote lifecycle management at scale. Second, regulators in multiple regions are enforcing SIM registration and restricting permanent roaming, pushing global deployments away from single-global-SIM approaches toward multi-carrier architectures and local-profile strategies. That shift elevates the role of eSIM management and compliance tooling. In parallel, standards evolution such as 3GPP Release 19 finalization (April 2026) reinforces the importance of standards-aligned modules and core-network interoperability for massive IoT and 5G standalone-based M2M deployments.
Competitive Landscape
The top 10 providers captured roughly 55% of 2024 revenue, indicating moderate concentration in the M2M services market. Tier-1 mobile network operators such as AT&T, Verizon, Vodafone, China Mobile, and Deutsche Telekom leverage licensed spectrum and customer-billing systems to bundle connectivity and cloud platforms. MVNO specialists including KORE Wireless, Sierra Wireless, and 1NCE differentiate through flat-rate global plans, eSIM orchestration, and vertical-specific solutions that eliminate roaming surprises for cross-border fleets.
Technology roadmaps focus on energy-harvesting modules, quantum-resistant encryption, and federated learning algorithms that train predictive models without centralizing sensitive data. Cisco’s USD 28 billion purchase of Splunk strengthens its security and observability stack, enabling real-time correlation between M2M telemetry and threat intelligence.[3]Cisco Systems Inc., “Splunk Acquisition 2024,” cisco.com Starlink’s direct-to-device satellite service, announced for 2025 launch, threatens to bypass terrestrial networks in remote areas, prompting operators to forge hybrid cellular-satellite partnerships.
Strategic moves include Vodafone’s 10-year pact with Microsoft to integrate Azure IoT Hub, AT&T’s USD 450 million acquisition of KORE’s North American business to expand managed services, and Deutsche Telekom’s joint edge-computing platform with Ericsson. Vendors active in 3GPP Release 18 for 5G RedCap and GSMA’s IoT SAFE gain first-mover influence over emerging standards. The competitive narrative underscores a race to move beyond commoditized data transport toward software, analytics, and security layers that deepen customer lock-in and widen margins.
Machine To Machine (M2M) Services Industry Leaders
AT&T Inc.
Verizon Communications Inc.
Vodafone Group Plc
China Mobile Communications Corporation
Cisco Systems Inc.
- *Disclaimer: Major Players sorted in no particular order
Machine To Machine (M2M) Services Market Companies Covered in this Report
- AT&T Inc.
- Verizon Communications Inc.
- Vodafone Group Plc
- China Mobile Communications Corporation
- Deutsche Telekom AG
- Rogers Communications Inc.
- International Business Machines Corporation
- Cisco Systems Inc.
- Huawei Technologies Co. Ltd.
- Intel Corporation
- Thales Group
- Amdocs Ltd.
- EE Ltd.
- Nokia Corporation
- Comarch S.A.
- KORE Wireless Group Inc.
- Sierra Wireless Inc.
- Telit Cinterion
- Aeris Communications Inc.
- 1NCE GmbH
- Emnify GmbH
- Transatel S.A.S.
- Orange Business Services
Read Analysis of Machine To Machine (M2M) Services Companies

Market Opportunities and Future Outlook
A whitespace is emerging around compliance-led global connectivity operations, where enterprises need scalable alternatives to permanent roaming as more countries enforce SIM registration, licensing, and in-country profile requirements. This shifts opportunity toward eSIM orchestration, multi-IMSI or multi-profile strategies, and managed connectivity platforms that can localize onboarding, billing, and data-handling by jurisdiction. The policy direction is visible in India, where M2M ecosystem participants must register through SaralSanchar and where TRAI, in December 2025, recommended an International M2M SIM Service Authorisation to regulate foreign SIM sales for exported M2M devices. That move is creating demand for governance, auditability, and compliant export provisioning workflows.
Technology roadmaps also create service-attachment opportunities beyond basic data transport, particularly around standardized 5G device classes and stronger security baselines. 3GPP Release 18 (finalized in 2024) introduced eRedCap as a standardized 5G NR reduced-capability class for M2M, supporting operator moves from legacy LTE categories toward 5G standalone-aligned massive IoT deployments. It also enables new bundles that combine connectivity with edge analytics and lifecycle operations. In security, ETSI/oneM2M updated its Security Solutions specification (TS-0003 v4.7.1) in March 2026 and ITU-T published guidance including zero-trust platform access control (Y.4814, September 2025). This supports commercial demand for managed security services such as device identity, policy-based access, continuous monitoring, and over-the-air vulnerability response across regulated fleets.
Recent Industry Developments in Machine To Machine (M2M) Services Market
- July 2026: Verizon announced a collaboration with KDDI to provide 5G Standalone and LTE connectivity for newly manufactured BMW Group vehicles for the U.S. market. The program aligns with 3GPP Release 16 standards, reflecting the market shift toward standardized 5G SA automotive connectivity. Securing OEM programs at manufacturing scale strengthens carrier positioning in telematics and vehicle lifecycle services beyond consumer data plans.
- May 2026: Telenor IoT and Sateliot entered a strategic partnership to integrate terrestrial mobile networks with satellite-based non-terrestrial networks (NTN) for global IoT connectivity. The move targets coverage gaps in remote industrial deployments where terrestrial-only footprints limit fleet visibility. Hybrid cellular-satellite offers M2M providers a pathway to monetize hard-to-serve geographies with unified connectivity management.
- October 2024: Vodafone Business and Microsoft formed a 10-year alliance to connect 5 million devices in Europe via integrated IoT and edge services. The partnership ties operator connectivity to cloud platforms and edge capabilities, supporting enterprise rollouts that require integration with existing IT stacks. It also raises competitive pressure on standalone connectivity providers by normalizing bundled, platform-led M2M propositions.


Machine To Machine (M2M) Services Market Report Scope and Research Methodology
Market Definition and Coverage
This market covers revenue earned from services that enable devices, machines, and sensors to communicate with each other without human input, including connectivity, device management, security, and analytics services used in enterprise and industrial use cases.
Scope exclusions: We do not count one time sales of physical IoT devices and modules, or general consumer mobile voice and data plans that are not tied to dedicated M2M service delivery.
Segments Covered in This Report
- By Type
- Managed Service
- Professional Service
- By Connectivity Technology
- Cellular (2G - 5G)
- LPWAN (NB-IoT / LTE-M / LoRa / Sigfox)
- Satellite
- Wired (Ethernet / xDSL)
- By Service Model
- Connectivity Service
- Device Management Service
- Data Management and Analytics Service
- Security Service
- Application Enablement Service
- By End User
- Retail
- Banking and Financial Institutions
- Telecom and IT
- Healthcare
- Automotive
- Oil and Gas
- Transportation
- Utilities
- Manufacturing
- Agriculture
- Smart Cities
- Consumer Electronics
- By Geography
- North America
- United States
- Canada
- Mexico
- South America
- Brazil
- Argentina
- Chile
- Rest of South America
- Europe
- United Kingdom
- Germany
- France
- Italy
- Spain
- Rest of Europe
- Asia-Pacific
- China
- Japan
- India
- South Korea
- Australia and New Zealand
- Rest of Asia-Pacific
- Middle East and Africa
- Middle East
- United Arab Emirates
- Saudi Arabia
- Turkey
- Rest of Middle East
- Africa
- South Africa
- Kenya
- Nigeria
- Rest of Africa
- Middle East
- North America
Data Sources, Market Sizing, and Validation
Desk Research
Desk research is used to set the boundaries of what counts as M2M services, and to build the first layer of assumptions for connections growth, technology mix, and pricing direction. We relied on public statistics and standards bodies that track wireless adoption and spectrum direction, such as ITU releases, OECD digital indicators, and 3GPP documentation on cellular evolution.
To anchor demand signals, we also reviewed non-paywalled material such as regulator publications (for example, FCC and EU telecom updates), national statistics office data for industrial activity context, and association portals on IoT deployment themes. On the supply side and commercialization model, we referenced company annual reports, investor presentations, and reputable press coverage to understand service bundles, contract structures, and typical monetization levers. We also used paid subscriptions for company financials and intelligence, news and financials, and patent databases, and where relevant we checked shipment-level import export data to sanity check narratives around device volumes and cross-border deployments. The desk sources listed here are illustrative only, and many other public documents were also reviewed to collect, validate, and clarify inputs.
Primary Interviews and Surveys
Primary work focused on interviews and surveys with telecom operators, M2M platform and managed service teams, system integrators, and large enterprise users across key verticals like automotive, manufacturing, utilities, and logistics. We used these conversations to confirm what is being paid for as a service, how pricing is structured (per connection, per device, per bundle, or per site), and which connectivity options are being chosen in real deployments across APAC, EMEA, and the Americas.
Distribution of primary research fieldwork respondents
| Company type | Respondent position | Region |
|---|---|---|
| Top tier: 36% | CXOs: 13% | APAC: 52% |
| Mid tier: 50% | Functional/Unit leaders: 33% | EMEA: 29% |
| Smaller Players: 14% | Managers: 54% | Americas: 19% |
Market-Sizing & Forecasting
Sizing starts from a top-down build where the addressable demand pool is reconstructed using active M2M connection growth, connectivity technology mix (cellular, LPWAN, satellite, and wired), and average service revenue patterns attached to these connections in enterprise use cases. Once those totals are shaped, they are checked through selective bottom-up approximations, such as rolling up sampled operator and service provider revenue disclosures, and then extending them with ASP and volume logic for managed services versus professional services.
Inputs are kept practical and repeatable, so the model leans on a handful of fingerprints that can be refreshed each cycle, such as active SIM and eSIM trends, migration pace from 2G and 3G to 4G and 5G for M2M, adoption of LPWAN for low power devices, device management and security attach rates, and vertical deployment momentum in connected vehicles, utilities, smart cities, and industrial automation. Where a bottom-up roll up has gaps because private players do not disclose revenue, we apply conservative ranges from primary interviews and use sensitivity checks so the total stays consistent with the broader demand pool.
For forecasting, we run scenario analysis alongside time series methods like ARIMA on connections and service ARPU series, and the outputs are then adjusted based on what experts expect for regulation, roaming and connectivity rules, and security spend behavior. The final curve is not driven by one assumption, since volume, mix, and pricing are each projected separately and then recombined into yearly market values.
Data Validation & Update Cycle
Model results are cross-checked against independent signals, including connection counts, regional telecom indicators, and reported service revenue direction from major operator disclosures, before the numbers are locked. When variances show up, the drivers are unpacked, which usually means revisiting technology mix, service bundle boundaries, or currency timing assumptions, and then re-contacting a small set of respondents to confirm what changed.
A multi step review is followed so definitions, inputs, and calculations are verified by another analyst before sign-off. Reports are refreshed annually, and interim updates are made when a material change affects pricing, regulation, or deployment pace. Before delivery, we do a fresh pass on the model and the narrative so clients receive the latest updated view.
Mordor Intelligence's Machine to Machine M2m Services Market Size Versus Other Published Estimates
Published market sizes for M2M services can vary quite a lot, even when multiple reports are discussing the same connected devices and managed connectivity theme. The differences usually come from what is counted as a service, how connectivity revenue is separated from broader IoT spending, and which years and currencies are used for conversion.
By tracking connectivity plus service-model revenues and then refreshing scope checks through interviews, Mordor Intelligence keeps the count limited to service value delivered for M2M operations. That can lead to a lower 2025 value than estimates that fold in wider IoT software, hardware, or long-range projections.
Benchmark comparison
| Source | Market Size | Gaps in Research Methodology |
|---|---|---|
| Mordor Intelligence | USD 57.18 B (2025) | |
| Industry Research House A | USD 69.40 B (2025) | Uses a broader definition that can blend M2M connectivity services with adjacent IoT enablement work, and it applies a longer forecast window that may assume faster ARPU expansion across service bundles. |
| Market Analytics Firm B | USD 77.58 B (2025) | Scope and inclusions are not clearly bounded on the public page, so items like device or platform revenue can be indirectly captured, which tends to push the total higher versus a services-only cut. |
The spread across the table is mainly explained by scope control and how service revenue is separated from adjacent IoT categories. With clear counting rules, a repeatable set of demand indicators, and checks back to real deployment and pricing behavior, the final number stays understandable for users and easier to update each year.


Key Questions Answered in the Report
What is the projected value of the M2M services market in 2031?
The M2M services market is forecast to reach USD 102.12 billion by 2031.
Which connectivity technology dominates current deployments?
Cellular networks, including LTE-M and NB-IoT, held 73.90% of 2025 revenue.
Which end-user segment is expanding the fastest?
Healthcare connections are expected to grow at a 12.37% CAGR through 2031.
Why are professional services gaining traction?
Enterprises require integration expertise to link legacy systems with cloud analytics, driving a 12.52% CAGR for professional engagements.
Which region will post the highest growth rate to 2031?
The Middle East is poised for a 13.34% CAGR, propelled by smart-infrastructure mandates in Saudi Arabia and the UAE.
How is cybersecurity influencing procurement decisions?
Rising breach costs and regulatory fines push enterprises to demand end-to-end encryption and zero-trust architectures, raising security-service attach rates above 20%.
Page last updated on:





