M2M Connections Market Size and Share
Market Overview
| Study Period | 2020 - 2031 |
|---|---|
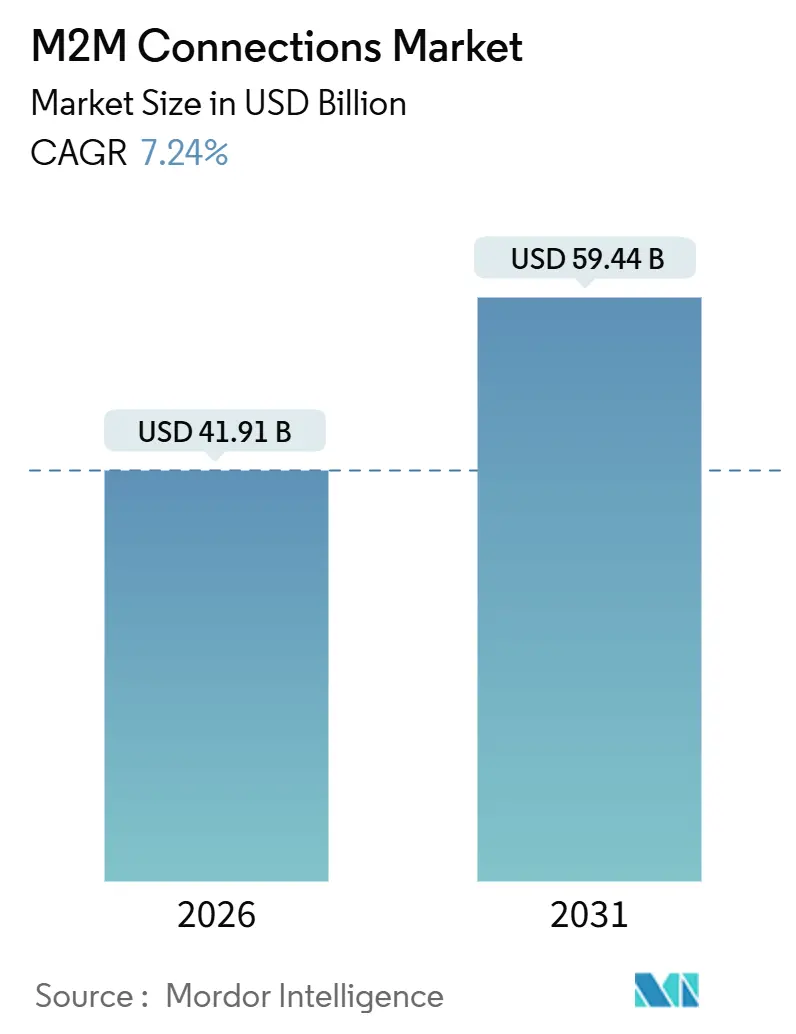
| Market Size (2026) | USD 41.91 Billion |
| Market Size (2031) | USD 59.44 Billion |
| Growth Rate (2026 - 2031) | 7.24% CAGR |
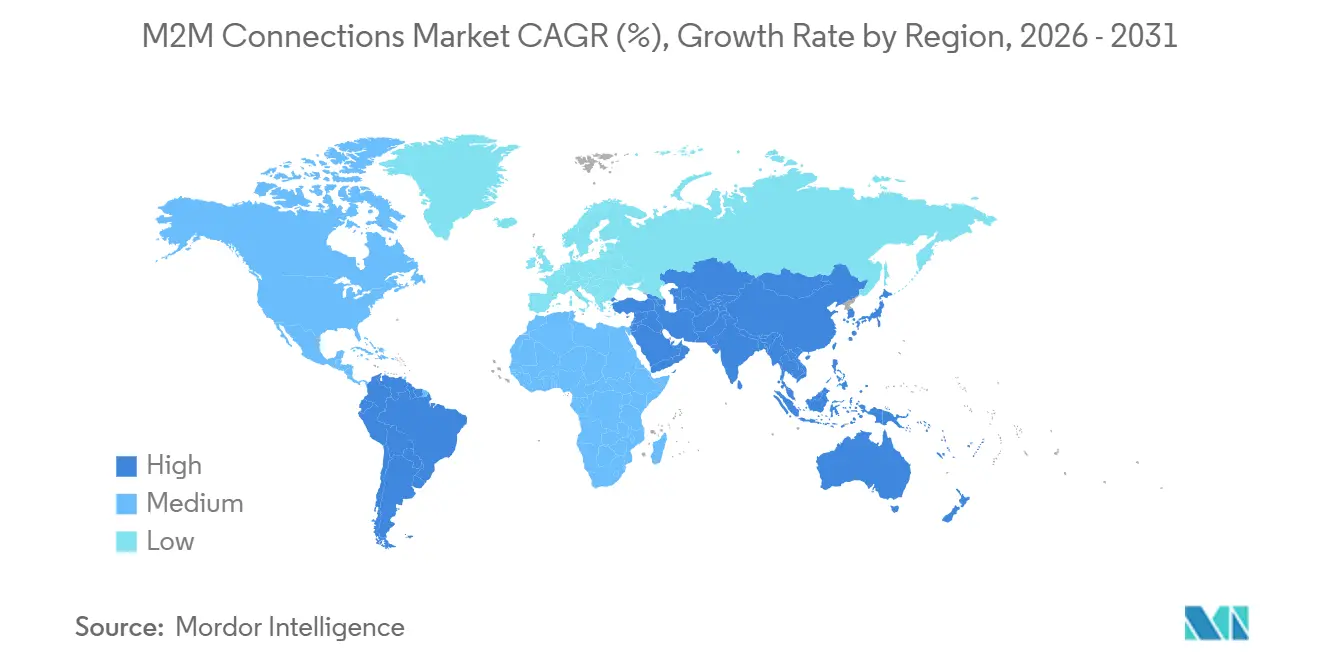
| Fastest Growing Market | Middle East |
| Largest Market | Asia Pacific |
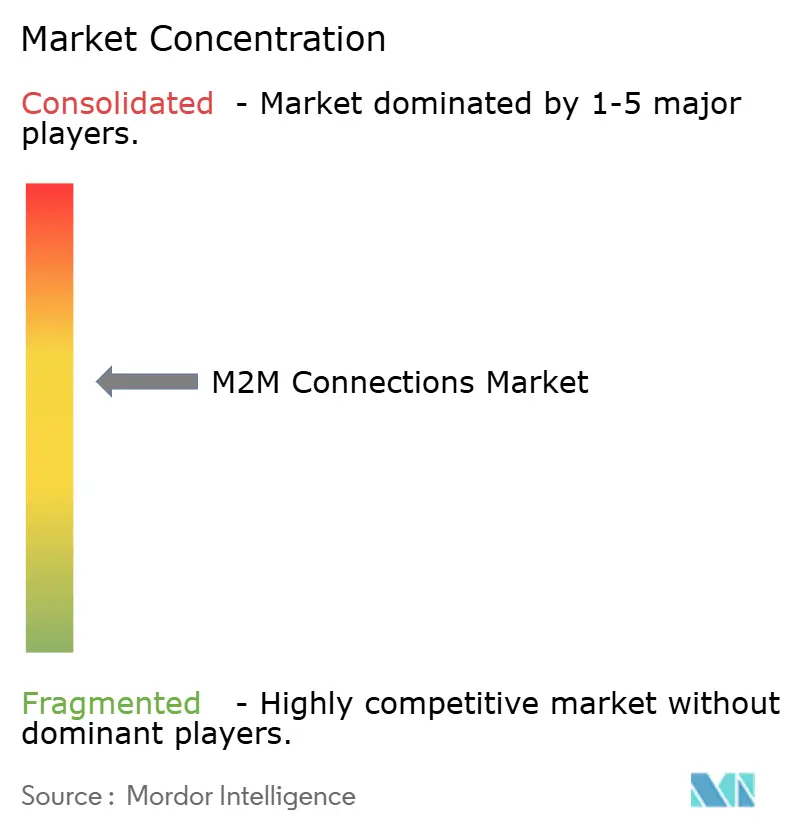
| Market Concentration | Medium |
Major Players *Disclaimer: Major Players sorted in no particular order Image © Mordor Intelligence. Reuse requires attribution under CC BY 4.0. | |
M2M Connections Market Analysis by Mordor Intelligence
The M2M connections market size stands at USD 41.91 billion in 2026 and is forecast to reach USD 59.44 billion by 2031, expanding at a 7.24% CAGR. Demand is rising as enterprises pair denser cellular footprints with edge processing, eSIM provisioning, and cloud-native device management. These advances cut recurring connectivity costs, unlock use cases that once failed due to latency or power constraints, and spur new revenue models for operators and module suppliers. Wireless links dominate because they eliminate trenching expenses in remote sites, while cloud-hosted control planes streamline firmware updates and analytics. Competition is intensifying as hyperscale clouds bundle connectivity with application services, prompting mobile network operators to add integrated edge compute and verticalized solutions. Security hardening and protocol convergence remain critical priorities as device counts scale into the tens of billions.
Key Report Takeaways
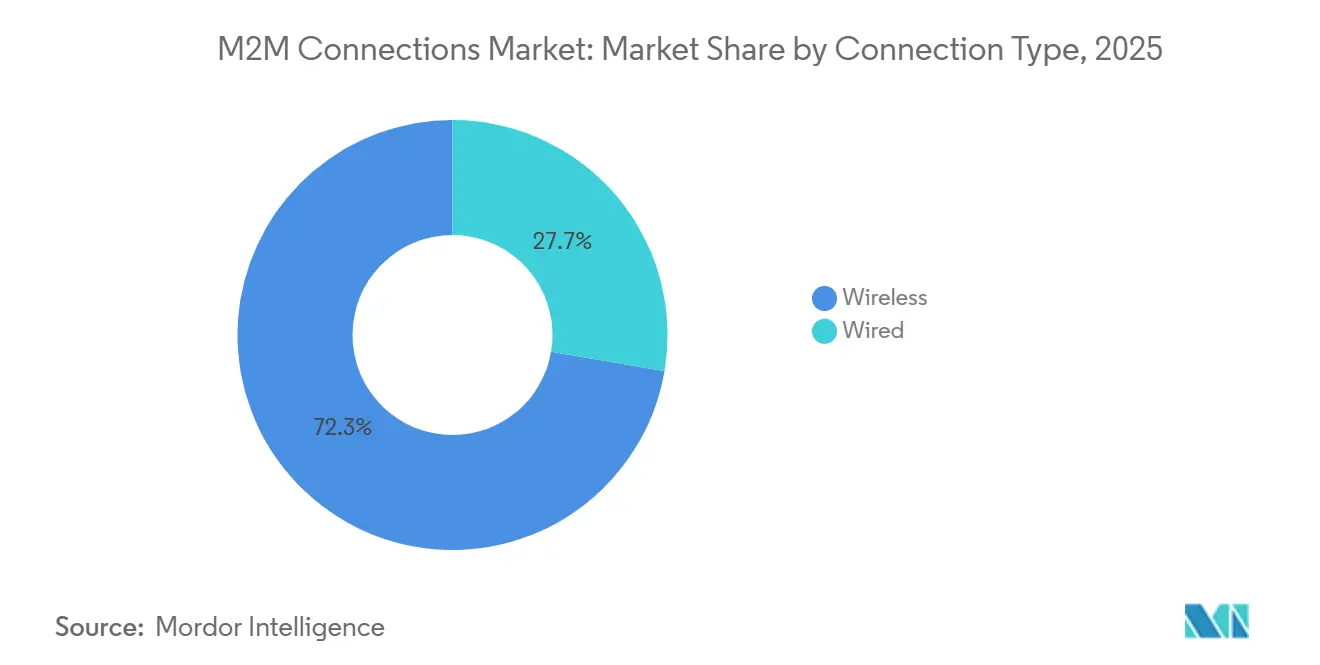
- By connection type, wireless dominated with 72.33% of the M2M connections market share in 2025 and is set to grow at a 7.66% CAGR through 2031.
- By technology, cellular accounted for 47.19% of the market share in 2025, while low-power wide-area networks are forecast to grow at an 8.41% CAGR through 2031.
- By deployment model, cloud deployment accounted for 56.89% of revenue in 2025 and is projected to register the highest 7.83% CAGR through 2031.
- By end-user industry, automotive led with 23.47% share in 2025, whereas healthcare is poised for the fastest 8.89% CAGR through 2031.
- By geography, Asia-Pacific captured 33.82% of 2025 volume, while the Middle East is expected to post the swiftest 8.91% CAGR through 2031.
Note: Market size and forecast figures in this report are generated using Mordor Intelligence’s proprietary estimation framework, updated with the latest available data and insights as of January 2026.
Global M2M Connections Market Trends and Insights
Drivers Impact Analysis*
| Driver | (~) % Impact on CAGR Forecast | Geographic Relevance | Impact Timeline |
|---|---|---|---|
| Proliferation of IoT Devices Across Industries | +1.8% | Global, with concentration in Asia-Pacific manufacturing hubs and North American logistics networks | Medium term (2-4 years) |
| Increasing Number of Mobile Connections and Smartphone Penetration | +1.3% | Asia-Pacific core, spillover to Middle East and Africa | Short term (≤ 2 years) |
| Growing Adoption of Telematics in Automotive and Transport | +1.5% | North America and Europe for passenger vehicles; Asia-Pacific for commercial fleets | Medium term (2-4 years) |
| Integration of eSIM Technology Enabling Massive M2M Scalability | +1.2% | Global, early adoption in Europe and North America | Long term (≥ 4 years) |
| Rise of Private 5G Networks for Industrial M2M Applications | +1.0% | North America and Europe industrial corridors; emerging in Asia-Pacific special economic zones | Long term (≥ 4 years) |
| Emerging Demand for Real-Time Edge Analytics Reducing Latency | +0.9% | Global, concentrated in urban centers with dense edge infrastructure | Medium term (2-4 years) |
| Source: Mordor Intelligence | |||
Proliferation Of IoT Devices Across Industries
Industrial firms are embedding sensors in once-isolated equipment to collect telemetry that feeds predictive maintenance programs, trimming unplanned downtime and energy waste. Manufacturer subsidies and falling module prices, now below USD 5 for NB-IoT chipsets, make connectivity viable for low-value assets. Retail chains run smart shelves that trigger restocks automatically, and pipeline operators outfit thousands of kilometers of infrastructure with pressure sensors that detect leaks within minutes. Momentum is strongest in heavy industry, mining, and petrochemicals, where every hour of outage carries six-figure losses.[1]Bosch Global, “Industry 4.0 and Private 5G Networks,” bosch.com Equipment makers now ship connectivity-ready machines by default, accelerating the installed base and stimulating recurring service revenue for operators and analytics vendors.
Increasing Number Of Mobile Connections And Smartphone Penetration
Rapid smartphone adoption in emerging markets lowers the marginal cost of adding M2M endpoints by allowing carriers to reuse existing LTE and 5G capacity. India’s Department of Telecommunications requires every new tower to support NB-IoT and LTE-M, expanding rural coverage for agriculture sensors.[2]Department of Telecommunications India, “National IoT Policy Framework 2024,” dot.gov.in Technicians now provision gateways via Bluetooth and NFC on handheld devices rather than proprietary laptops, cutting installation times from hours to minutes. China Mobile’s OneLink platform added 180 million connections in the 12 months ending September 2024, proving the scalability of app-based onboarding. Logistics fleets mirror this shift, as drivers pair smartphones with vehicle units to upload telematics without dedicated scanners, reinforcing the flywheel effect for operator economics.
Growing Adoption Of Telematics In Automotive And Transport
Automakers embed cellular modules to push over-the-air software updates, perform remote diagnostics, and enable usage-based insurance. General Motors generated USD 2.1 billion in subscription revenue from its OnStar service in 2024.[3]General Motors, “2024 Annual Report,” gm.com European Union mandates on eCall have seeded more than 50 million connected cars, which now support stolen-vehicle tracking and predictive maintenance. Commercial fleets achieve up to 20% fuel savings by mining telematics for route optimization. United States regulators funded USD 300 million in cellular V2X pilots that cut intersection collisions and reinforced connectivity demand. Electric vehicles further amplify telematics penetration, as battery health monitoring requires persistent data uplinks to avoid thermal events.
Integration of eSIM Technology Enabling Massive M2M Scalability
eSIM decouples hardware from carrier selection, allowing remote profile downloads that slash supply-chain complexity. GSMA’s 2024 Remote SIM Provisioning update adds post-quantum cryptography, enabling devices to switch carriers over-the-air while maintaining security. IDEMIA and Qualcomm commercialized an integrated SIM chipset that frees 40% of board space, critical for wearables and implants where miniaturization is paramount. Automotive manufacturers bundle multi-year connectivity that roams seamlessly across borders, and utilities rely on eSIM to meet data-localization mandates by activating domestic profiles on install. Together, these capabilities remove friction and pave the way for billions of incremental endpoints.
Restraints Impact Analysis*
| Restraint | (~) % Impact on CAGR Forecast | Geographic Relevance | Impact Timeline |
|---|---|---|---|
| Privacy and Security Concerns in M2M Communications | -0.9% | Global, acute in Europe due to GDPR enforcement and North America due to sector-specific regulations | Short term (≤ 2 years) |
| Lack of Global M2M Standards and Interoperability | -0.7% | Global, fragmentation most severe in application layer protocols | Medium term (2-4 years) |
| Scarcity of IPv4 Address Space and Delays in IPv6 Transition | -0.5% | North America and Europe legacy networks; emerging markets less constrained | Long term (≥ 4 years) |
| Supply-Chain Disruptions for Specialized M2M Chipsets | -0.6% | Global, concentrated impact in automotive and industrial sectors | Short term (≤ 2 years) |
| Source: Mordor Intelligence | |||
Privacy And Security Concerns In M2M Communications
Weak authentication and outdated firmware expose critical infrastructure. CISA issued 23 industrial control advisories in 2024, citing hardcoded credentials and insecure bootloaders. A botnet hijacked 40,000 routers after manufacturers shipped devices with default passwords, underscoring provisioning lapses. Healthcare regulators demand end-to-end encryption for insulin pumps and cardiac monitors, raising compliance costs and delaying launches. Enterprises are adopting zero-trust architectures, but retrofitting cryptographic hardware onto legacy sensors remains cost-prohibitive for low-value assets. Certification regimes such as IEC 62443 add 10-15% to the bill of materials, squeezing margins.
Lack Of Global M2M Standards And Interoperability
Divergent protocols force manufacturers to support multiple firmware branches, inflating R&D overhead. MQTT, CoAP, and LwM2M use incompatible message formats, so gateways must translate traffic, introducing latency and failure points. OneM2M offers a common service layer, yet adoption lags as vendors race to market with proprietary stacks. Vehicle makers lock diagnostic data behind closed interfaces, fragmenting aftermarket services. Industrial automation remains siloed because PLC suppliers use proprietary buses that prevent best-of-breed sensor integration. Cross-border logistics suffer when devices cannot authenticate with local networks during roaming, leading to blind spots in global tracking.
*Our forecasts treat driver/restraint impacts as directional, not additive. The impact forecasts reflect baseline growth, mix effects, and variable interactions.
Segment Analysis
By Connection Type: Wireless Extends Its Lead On Flexibility
Wireless links accounted for 72.33% of the M2M connections market in 2025 and are on track for a 7.66% CAGR through 2031. Mining companies in Australia and Chile cover sprawling pits with LTE-M, connecting autonomous haul trucks without costly fiber runs. Smart agriculture favors wireless because sensors and weather stations spread across fragmented acreage cannot justify trenching. Satellite fills coverage gaps for pipelines and maritime assets, with Iridium and Globalstar offering narrowband service where terrestrial signals fade.
Total cost of ownership keeps tilting toward wireless as module prices drop 40% between 2022 and 2024, while skilled-labor shortages drive up wired-installation costs. Wired Ethernet still holds its ground in building automation, where power-over-Ethernet simplifies provisioning and eliminates battery maintenance. Hybrid topologies are emerging, aggregating wired sensor clusters into cellular backhaul to balance reliability and cost, but the overall momentum remains firmly behind wireless in the M2M connections market.


By Technology: Cellular Holds Share While LPWA Leads Growth
Cellular connections secured 47.19% of the M2M connections market share in 2025, driven by ubiquitous LTE and 5G networks that support high-bandwidth video and real-time tracking. NB-IoT and LTE-M extend battery life for meters and environmental monitors, propelling LPWA toward the fastest 8.41% CAGR to 2031. China Mobile alone manages more than 1.47 billion IoT lines, the majority of which are on NB-IoT.
Short-range radios like Bluetooth Low Energy and Zigbee dominate wearables and smart home clusters within 100 meters of a gateway. LoRaWAN occupies a middle ground for city-scale deployments where cellular data plans incur unsustainable recurring fees, with Amsterdam and Singapore running public networks that host parking and air-quality sensors. Satellite technologies remain indispensable for maritime, aviation, and remote pipelines, reinforcing a multi-modal landscape that chipset vendors now address with integrated radios capable of dynamic network selection.
By Deployment Model: Cloud Platforms Capture Majority Share
Cloud deployments held 56.89% of 2025 revenue and will retain leadership at a 7.83% CAGR through 2031. Amazon Web Services IoT Core and Microsoft Azure IoT Hub together hosted more than 500 million devices in 2024. Enterprises choose the cloud to avoid up-front server purchases and gain global redundancy for firmware distribution.
On-premises installations persist in defense, critical infrastructure, and sites with patchy internet connectivity. Hybrid models are rising as manufacturers deploy edge gateways for real-time analytics while synchronizing summaries to cloud data lakes. PCI-compliant payment networks keep transaction logic local to shield cardholder information, batching encrypted records to central vaults during off-peak windows. Cloud providers now offer managed edge containers that blur lines between deployment models, advancing scalability and operational simplicity across the M2M connections market.


By End-User Industry: Automotive Dominates, Healthcare Accelerates
Automotive applications captured 23.47% of the 2025 volume as connected-service bundles became standard in new vehicles. Remote diagnostics, infotainment updates, and eCall safety mandates create durable demand for cellular modules. Meanwhile, healthcare is the fastest-growing sector, with an 8.89% CAGR, thanks to expanded reimbursement for cellular glucose monitors and cardiac rhythm devices in the United States.
Retail chains deploy M2M point-of-sale terminals that sync inventory across brick-and-mortar and e-commerce channels, reducing stockouts by 25%. Oil and gas firms instrument wells and pipelines to detect leaks more quickly, thereby mitigating environmental fines. Logistics providers outfit containers with GPS and temperature sensors to safeguard the cold chain for pharmaceuticals. Diverse vertical adoption secures a broad demand base that underpins the M2M connections market.
Geography Analysis
Asia-Pacific accounted for 33.82% of global connections in 2025, driven by state mandates for smart cities and utilities. China’s vast installed base is complemented by India’s National IoT Policy, which aims to reach 500 million devices by 2027 and offers subsidies to module makers. Japan trials vehicle-to-infrastructure use cases over 5G standalone networks, while South Korea funds private 5G testbeds that anchor factory automation.
North America and Europe show slower connection growth yet richer revenue per line as enterprises focus on value-added analytics and stringent security certifications. The European Union’s Radio Equipment Directive, effective January 2025, requires all devices to support secure software updates, raising compliance hurdles but boosting trust in connected endpoints. In the United States, FirstNet provides priority lanes for public-safety M2M traffic, tallying 5 million devices by mid-2024.
The Middle East projects the highest CAGR of 8.91% through 2031, fueled by Saudi Arabia’s NEOM deployment of 1 million sensors and Dubai’s smart infrastructure, which cut energy use by 30%. South America sees concentrated adoption of precision agriculture in Brazil and Argentina, aided by subsidies from the Brazilian Ministry of Agriculture. Africa lags in rural coverage, but urban NB-IoT rollouts in South Africa and Egypt are enabling metering and fleet management.

Competitive Landscape
Market concentration is moderate: the top five operators manage roughly 45% of global connections. Hyperscale clouds bundle connectivity with application services, compressing operator margins and forcing carriers to verticalize. Verizon’s ThingSpace marries connectivity, edge compute, and device management for industrial and fleet customers. Vodafone’s platform spans 190 countries with 175 million lines, leveraging roaming agreements for automotive and logistics deployments.
Module makers are consolidating as Telit absorbed Thales’s M2M business, giving the combined entity a 30% share in automotive telematics modules. Qualcomm filed 47 patents in 2024 around integrated SIM and multi-mode radio designs, underscoring a pivot toward tighter hardware-software integration. Satellite disruptors such as Swarm Technologies, now under SpaceX, offer USD 5 monthly plans for remote assets, undercutting legacy satellite pricing by 80%.
Private 5G gains momentum as Deutsche Telekom and Ericsson connected 8,000 sensors at BMW’s Leipzig plant with 5 millisecond latency, illustrating the push for deterministic industrial networks. Orange Business Services released a multi-IMSI SIM that roams across 180 countries, simplifying fleet operations. As vertical solutions multiply, smaller regional carriers and module suppliers face scale disadvantages, foreshadowing further consolidation in the M2M connections market.
M2M Connections Industry Leaders
AT&T Inc.
Cisco Systems Inc.
Huawei Technologies Co., Ltd.
Intel Corporation
Ericsson AB
- *Disclaimer: Major Players sorted in no particular order

Recent Industry Developments
- December 2025: Vodafone and Amazon Web Services integrated AWS IoT Core with Vodafone’s global platform to streamline provisioning for multi-region automotive clients.
- September 2025: Huawei launched HiLink IoT 3.0 with edge AI, reducing cellular data by 60% in pilot factories.
- August 2025: Verizon extended ThingSpace with 5G RedCap targeting mid-bandwidth sensors in 15 U.S. cities.
- July 2025: Quectel introduced the BG770A-GL LTE-M/NB-IoT module with GNSS in a compact 16 x 26 mm package.


Global M2M Connections Market Report Scope
The M2M Connections Market Report is Segmented by Connection Type (Wired, and Wireless), Technology (Cellular Connections, Low Power Wide Area (LPWA), Short Range, Metropolitan Area Network (MAN), Wide Area Fixed, Satellite), Deployment Model (On-Premise, Cloud, Hybrid), End-User Industry (Retail, Banking and Financial Institutions, Telecom and IT, Healthcare, Automotive, Oil and Gas, Transportation, Other End-User Industries), and Geography (North America, Europe, Asia-Pacific, Middle East and Africa, South America). Market Forecasts are Provided in Terms of Value (USD).
| Wired |
| Wireless |
| Cellular Connections |
| Low Power Wide Area (LPWA) |
| Short Range |
| Metropolitan Area Network (MAN) |
| Wide Area Fixed |
| Satellite |
| On-Premise |
| Cloud |
| Hybrid |
| Retail |
| Banking and Financial Institutions |
| Telecom and IT |
| Healthcare |
| Automotive |
| Oil and Gas |
| Transportation |
| Other End-User Industries |
| North America | United States | |
| Canada | ||
| Mexico | ||
| Europe | Germany | |
| United Kingdom | ||
| France | ||
| Russia | ||
| Rest of Europe | ||
| Asia-Pacific | China | |
| Japan | ||
| India | ||
| South Korea | ||
| Australia | ||
| Rest of Asia-Pacific | ||
| Middle East and Africa | Middle East | Saudi Arabia |
| United Arab Emirates | ||
| Rest of Middle East | ||
| Africa | South Africa | |
| Egypt | ||
| Rest of Africa | ||
| South America | Brazil | |
| Argentina | ||
| Rest of South America | ||
| By Connection Type | Wired | ||
| Wireless | |||
| By Technology | Cellular Connections | ||
| Low Power Wide Area (LPWA) | |||
| Short Range | |||
| Metropolitan Area Network (MAN) | |||
| Wide Area Fixed | |||
| Satellite | |||
| By Deployment Model | On-Premise | ||
| Cloud | |||
| Hybrid | |||
| By End-User Industry | Retail | ||
| Banking and Financial Institutions | |||
| Telecom and IT | |||
| Healthcare | |||
| Automotive | |||
| Oil and Gas | |||
| Transportation | |||
| Other End-User Industries | |||
| By Geography | North America | United States | |
| Canada | |||
| Mexico | |||
| Europe | Germany | ||
| United Kingdom | |||
| France | |||
| Russia | |||
| Rest of Europe | |||
| Asia-Pacific | China | ||
| Japan | |||
| India | |||
| South Korea | |||
| Australia | |||
| Rest of Asia-Pacific | |||
| Middle East and Africa | Middle East | Saudi Arabia | |
| United Arab Emirates | |||
| Rest of Middle East | |||
| Africa | South Africa | ||
| Egypt | |||
| Rest of Africa | |||
| South America | Brazil | ||
| Argentina | |||
| Rest of South America | |||


Key Questions Answered in the Report
What is the global size of the M2M connections space in 2026 and its projected compound growth to 2031?
It stands at USD 41.91 billion in 2026 and is projected to expand at a 7.24% CAGR to reach USD 59.44 billion by 2031.
Which connection type is most widely adopted today and what drives its dominance?
Wireless links hold 72.33% share because they avoid trenching costs, simplify deployment in remote sites, and benefit from falling module prices.
Which end-user segment is registering the fastest expansion through 2031?
Healthcare posts the highest 8.89% CAGR as remote patient monitoring devices secure regulatory clearance and reimbursement.
Why are low-power wide-area technologies attracting rapid uptake?
NB-IoT and LTE-M enable battery-powered sensors to run for about 10 years, so utilities and municipalities favor them for metering and environmental monitoring.
How does eSIM improve large-scale device rollouts?
Remote profile provisioning lets enterprises ship hardware globally and switch carriers over-the-air, removing physical SIM logistics and cutting inventory complexity.
What security concern poses the greatest short-term risk to growth?
Weak authentication and unpatched firmware expose devices to botnets, as highlighted by 23 CISA advisories on industrial gateways in 2024.
Page last updated on:


