
Market Overview
| Study Period | 2021 - 2031 |
|---|---|
| Forecast Data Period | 2026 - 2031 |
| Base Year Market Size (2025) | USD 2.38 Billion |
| Market Size (2026) | USD 2.52 Billion |
| Market Size (2031) | USD 3.32 Billion |
| Growth Rate (2026 - 2031) | 5.69 % |
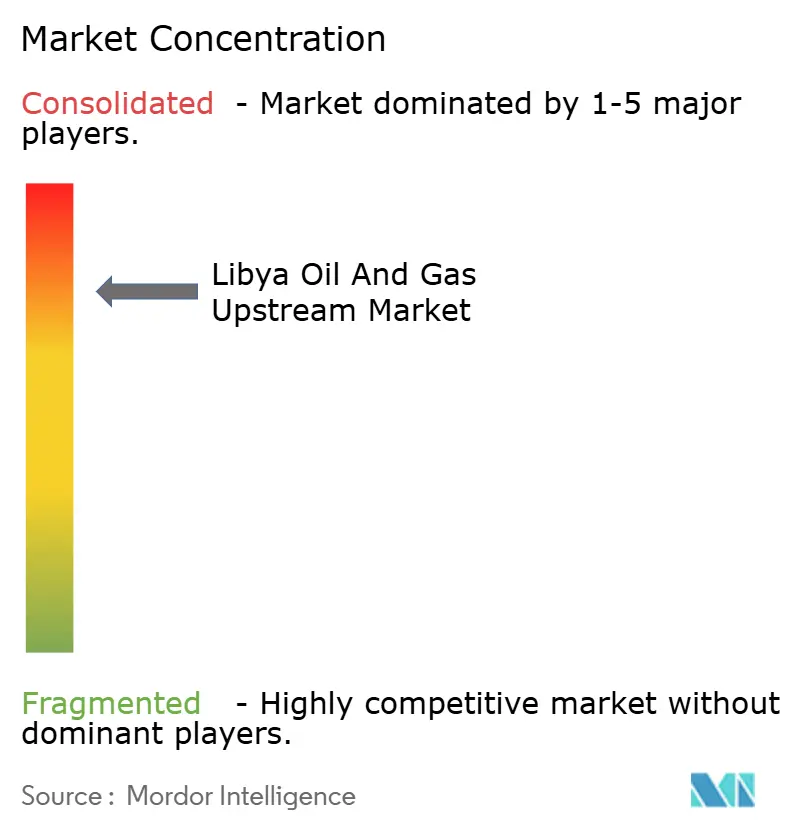
| Market Concentration | High |
Major Players *Disclaimer: Major Players sorted in no particular order Image © Mordor Intelligence. Reuse requires attribution under CC BY 4.0. | |
Libya Oil And Gas Upstream Market Analysis by Mordor Intelligence
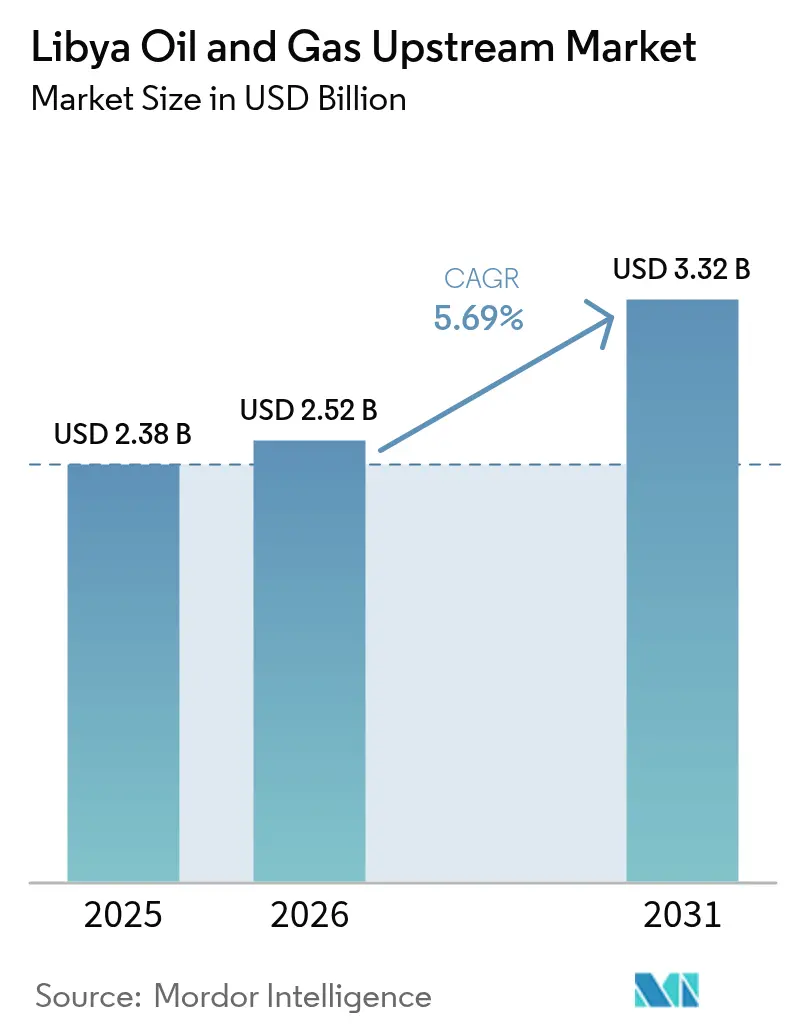
Libya Oil And Gas Upstream Market size in 2026 is estimated at USD 2.52 billion, growing from 2025 value of USD 2.38 billion with 2031 projections showing USD 3.32 billion, growing at 5.69% CAGR over 2026-2031.
Ample proven reserves of 48.4 billion barrels of crude and 1.4 trillion m³ of gas underpin long-run capacity, while the GreenStream pipeline anchors reliable flows into Southern Europe. New production sharing contracts (PSCs) that increase internal rates of return to 35.8% are reversing a decade of underinvestment and reopening capital pipelines from Western majors. Finally, targeted flared-gas recovery projects, together with incremental offshore appraisal, broaden the growth base for the Libya oil and gas upstream market.
Key Report Takeaways
- By location, onshore operations captured 64.12% of the Libyan oil and gas upstream market share in 2025, and it is also forecast to expand at a 6.22% CAGR through 2031, the fastest rate within the location segmentation.
- By resource type, crude oil commanded a 89.65% share of the Libya oil and gas upstream market size in 2025, and it is projected to rise at a quicker 5.79% CAGR between 2026 and 2031.
- By well type, the unconventional segment is advancing at a 6.66% CAGR through 2031, outpacing the mature conventional segment, which still commanded 97.32% of the Libyan oil and gas market size in 2025.
- By service, exploration is forecast to expand at a 7.05% CAGR, yet development and production services retained a 70.12% share of the Libyan oil and gas market size in 2025.
Note: Market size and forecast figures in this report are generated using Mordor Intelligence’s proprietary estimation framework, updated with the latest available data and insights as of 2026.
Libya Oil And Gas Upstream Market Trends and Insights
Drivers Impact Analysis*
| Driver | (~) % Impact on CAGR Forecast | Geographic Relevance | Impact Timeline |
|---|---|---|---|
| Accelerated restart of shut-in fields post-2023 ceasefire | +1.80% | Sirte Basin | Short term (≤ 2 years) |
| New PSC terms offering higher IRR to foreign operators | +1.50% | Nationwide | Medium term (2-4 years) |
| Flare-gas-to-power micro-LNG deployment | +0.70% | Sirte & Murzuq basins | Long term (≥ 4 years) |
| Libya as Eastern Mediterranean LNG back-fill option | +0.90% | Offshore export corridors | Long term (≥ 4 years) |
| Source: Mordor Intelligence | |||
Accelerated Restart of Shut-in Fields Post-2023 Ceasefire
The ceasefire implementation unlocked the systematic reopening of idled assets, resulting in a significant increase in national crude throughput from 450,000 barrels per day in September 2024 to 1.66 million barrels per day by February 2025. Sirte Basin flagships Sharara and El-Feel resumed within weeks of force-majeure removal, while Waha Oil Company optimized flowlines to recover plateau rates. International operators, such as BP and OMV, re-mobilized rigs after a decade of absence, illustrating renewed confidence in the Libyan oil and gas upstream market. Production continuity now hinges on sustained security coordination; yet, the episode proved the sector’s ability to rebound swiftly once political barriers are removed.
New PSC Terms Offering Higher IRR to Foreign Operators
The 2025 licensing round, covering 22 blocks, introduced PSC economics that yield a 35.8% after-tax IRR, compared to 2.5% under earlier EPSA-IV deals. The reform realigns state and investor interests by allowing companies to retain larger volumes of oil costs while preserving National Oil Corporation (NOC) equity. Pre-qualification attracted Eni, TotalEnergies, Repsol, and several independent companies, signaling a broad appetite for Libya's oil and gas upstream market opportunities, despite residual risk. Between 2026 and 2028, first-phase commitments on awarded acreage are expected to increase seismic and exploration drilling activity as operators pursue underexplored Paleozoic plays.
Deployment of Flare-Gas-to-Power Micro-LNG Skids
NOC’s pledge to curb flaring by 83% by 2030 is catalyzing the development of low-footprint micro-LNG units that capture associated gas in remote Murzuq fields.(1)National Oil Corporation, “Bouri Gas Utilisation Project Award,” noc.lyThe modular skids convert stranded gas into onsite power and truckable LNG, trimming emissions penalties and creating local fuel revenues. Early pilots awarded to Saipem under the Bouri Gas Utilization Project demonstrate commercial viability, while the eligibility for carbon credits further enhances payback. Widespread adoption could unlock up to 140 million cubic feet per day of incremental gas, reinforcing the gas diversification pillar of the Libya oil and gas upstream industry.
Emergence of Libya as Eastern Mediterranean LNG Back-fill Option
European buyers are scouring the Mediterranean for non-Russian molecules, and Libya’s 25 billion cubic meter yearly gas stream positions the country as a flexible swing supplier via the GreenStream leg to Italy.(2)International Energy Agency, “Global Gas Security Review 2024,” iea.org Prospective tie-ins to EastMed networks or floating LNG loading at Mellitah would let Libya arbitrage pipeline and spot LNG premiums. Demand pull from Italy and Spain is expected to persist beyond 2030, supporting offshore appraisal programs that seek to back-fill volumes as Egypt rebalances toward import dependence. These dynamics further widen the monetization canvas for the Libya oil and gas upstream market.
Restraints Impact Analysis*
| Restraint | (~) % Impact on CAGR Forecast | Geographic Relevance | Impact Timeline |
|---|---|---|---|
| Militia-driven pipeline blockades at Sirte hubs | -1.20% | Sirte export network | Short term (≤ 2 years) |
| Slow rig-import licensing under rival governments | -0.80% | Nationwide | Medium term (2-4 years) |
| Ageing desalters causing water-cut spikes | -0.60% | Legacy Sirte fields | Medium term (2-4 years) |
| Absence of Tier-1 service vendors due to sanctions risk | -0.50% | All producing areas | Long term (≥ 4 years) |
| Source: Mordor Intelligence | |||
Persistent Militia-Driven Pipeline Blockades at Sirte Basin Hubs
Localized armed groups periodically halt trunk lines feeding Ras Lanuf and Es Sider terminals, forcing NOC to declare force majeure and curtail cargo liftings. The September 2024 stoppage at Sharara highlighted how a single blockade can reverberate across 400,000 barrels per day of interconnected capacity. Operators incorporate higher security retainers and inventory buffers, but unplanned outages still dilute investor confidence in the Libya oil and gas upstream market.
Slow Rig-Import Licensing Under Rival Governments
Parallel approval regimes in Tripoli and Benghazi prolong customs clearance for land and jack-up rigs, adding months to spud schedules. Duplicative fees inflate logistics budgets, while scheduling conflicts make it harder to secure scarce regional rigs. The uncertainty weighs most heavily on independents pursuing exploration acreage, muddying the upside for the Libyan oil and gas upstream industry in the medium term.
*Our forecasts treat driver/restraint impacts as directional, not additive. The impact forecasts reflect baseline growth, mix effects, and variable interactions.
Segment Analysis
By Location: Onshore Dominance Drives Recovery
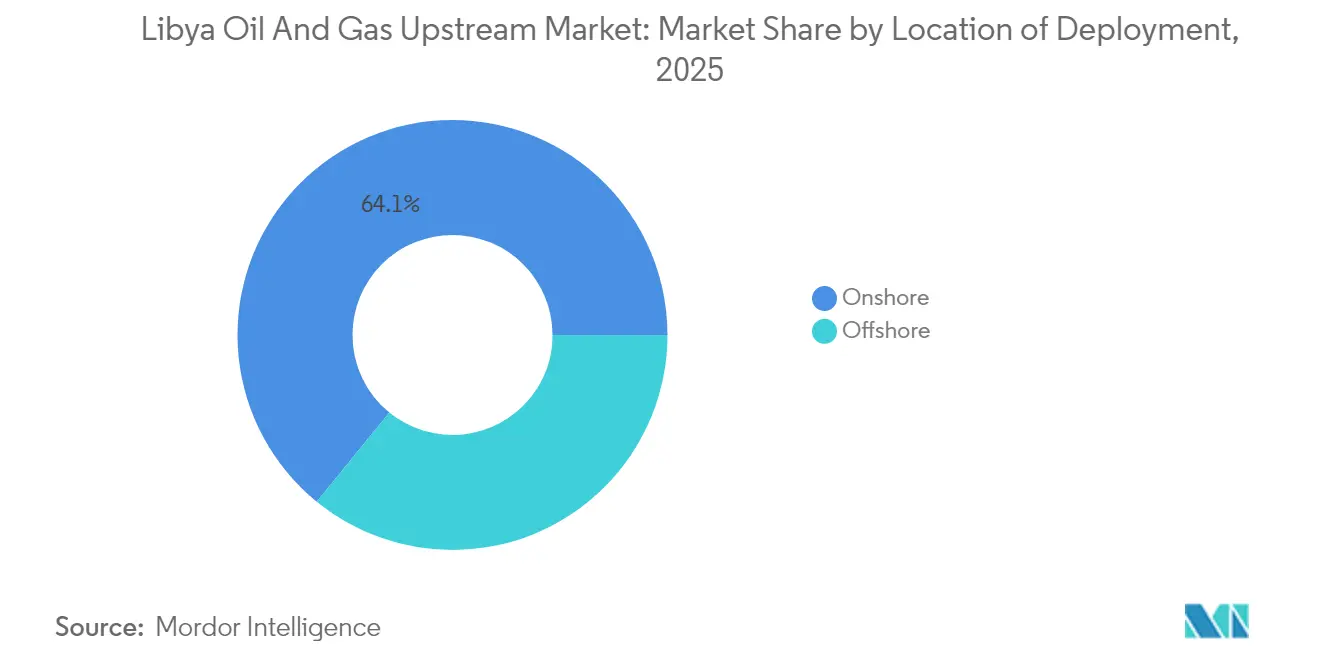
Onshore acreage accounted for 64.12% of the 2025 value of the Libyan oil and gas upstream market, anchored by the prolific Sirte Basin pipeline grid. The Waha, Gialo, and Amal clusters collectively pump almost 700,000 barrels per day, benefiting from shared processing hubs that keep lifting costs below USD 6 per barrel. Restart campaigns added 250,000 barrels per day within six months, proving onshore agility in the Libya oil and gas upstream market. A 6.22% CAGR through 2031 reflects drilling of step-out producers, sidetracks, and waterflood expansion.
Offshore remains a minority but strategic frontier. Al Jurf’s 35,000 barrels per day output validates Mediterranean met-ocean viability, while seismic over Block NC41 indicates stacked pay potential. Floating production solutions are under preliminary evaluation, and fiscal enhancements under the 2025 PSC round could tilt economics in favor of deeper water testing. Risk-adjusted forecasts still allocate 75% of 2030 capex to onshore programs, yet offshore successes could trigger upside revisions later in the decade.



By Resource Type: Crude Oil Supremacy with Gas Momentum
Crude oil accounted for 89.65% of 2025 revenue, equivalent to 1.41 million barrels per day of light sweet grades that cleared European refinery slats without requiring desulfurization discounts. High API gravity and low metal content ensure robust netbacks compared to Brent, reinforcing crude dominance in the Libyan oil and gas upstream market. A 5.79% CAGR to 2031 is assumed, based on incremental infill drilling and enhanced recovery at Waha and Sarir.
Natural gas currently supplies 25 billion cubic meters per year through GreenStream and enjoys enhanced policy support. Flare capture, micro-LNG deployment, and standalone Ghadames gas plays are expected to increase the proportion of dry gas within the Libyan oil and gas upstream industry. Condensate, though below 50,000 barrels per day, fetches premium petrochemical margins and incentives targeted at recompletions in Jurassic carbonates. By 2031, the gas share of total hydrocarbons could reach 15%, broadening the revenue base while aligning with decarbonization mandates.
By Well Type: Unconventional Potential Emerges
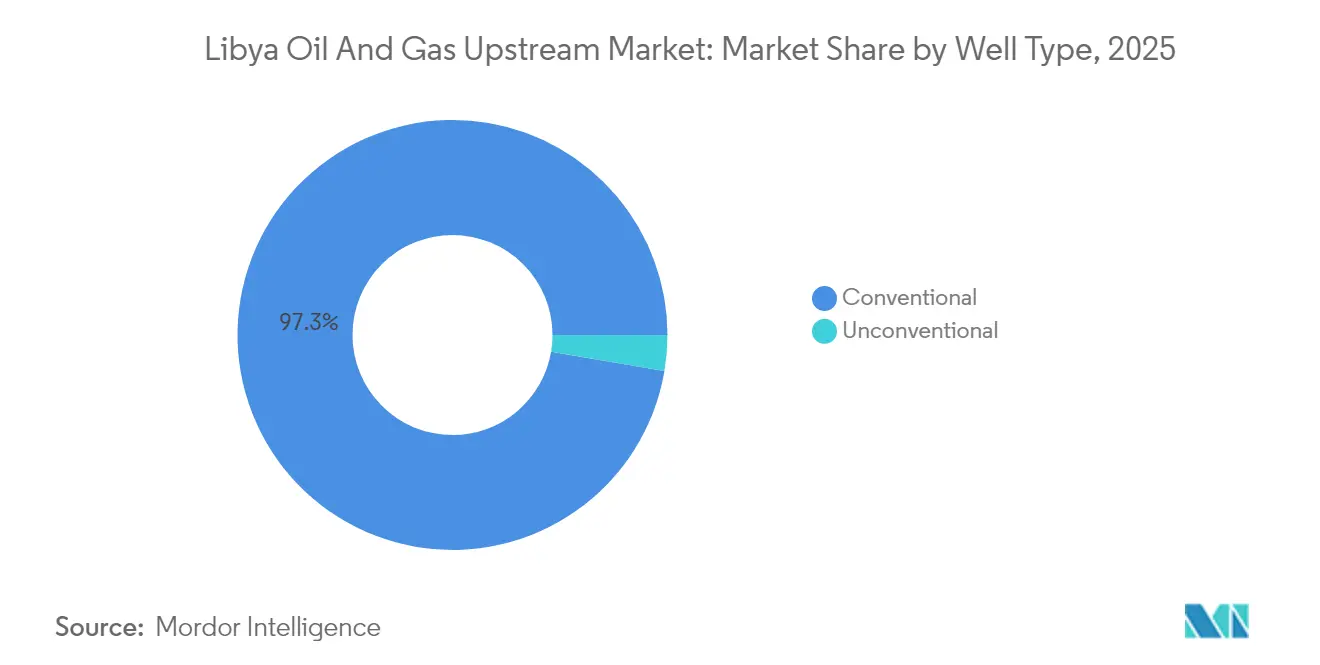
Conventional wells contributed 97.32% of the Libya oil and gas upstream market share in 2025, underscoring the depth of mature reservoirs that still generate reliable returns without intensive stimulation. Even so, unconventional drilling is poised to expand at a 6.66% CAGR to 2031, as falling reservoir pressures in flagship fields force operators to seek new barrels in shale and tight-oil horizons within the Sirte Basin. The National Oil Corporation views these resources as the next leg of growth, and its new Production Sharing Agreement, offering a 35.8% internal rate of return, makes the higher cost of horizontal drilling and hydraulic fracturing more palatable to foreign partners.
Technology adoption is already evident. Autonomous Inflow Control Devices and enhanced oil recovery packages are being tested in pilot strings to mitigate water cut and improve lift rates in complex formations. Returning majors, such as Repsol and Eni, bring directional drilling fleets and multistage fracture designs that were absent during years of conflict, thereby shortening the learning curves for local crews. Continued progress relies on effective technology transfer and the development of a domestic service base capable of delivering unconventional completions at competitive costs, a milestone that could diversify the Libyan oil and gas upstream market size beyond its historic reliance on primary recovery.
By Service: Exploration Renaissance Drives Growth
Development and production services accounted for 70.12% of the Libya oil and gas upstream market size in 2025, reflecting operators’ immediate focus on restarting legacy wells, overhauling surface facilities, and extending field life after a decade of under-investment. Yet exploration services, while smaller today, are set to rise at a 7.05% CAGR through 2031 as the first licensing round in 18 years and attractive PSC economics rekindle interest in underexplored basins.
Evidence of the shift is clear on the ground. Eni and BP spudded the A1-96/3 wildcat in the Ghadames Basin, while Repsol re-entered the Murzuq Basin, marking the return of Western rigs and state-of-the-art seismic crews. Modern imaging and directional drilling technologies, which were previously unavailable, now enable operators to target deeper, thinner pay zones with greater accuracy, thereby increasing the likelihood of discovery. At the same time, production-service providers are digitizing legacy assets with real-time monitoring and targeted chemical treatments to wring extra barrels from mature wells. This evolving mix indicates that the Libyan oil and gas upstream market is moving toward a balanced profile that pairs disciplined asset optimization with a revitalized search for new resources.
Geography Analysis
Libya ranks third in North Africa for oil output, sitting between Algeria and Egypt, and aims to reach 2-3 million barrels per day by 2028 under its current production roadmap. Mediterranean frontage provides near-term access to European refiners via Ras Lanuf, Es Sider, and Zueitina, giving Libyan light sweet barrels a freight advantage over West African grades.
Production geography is tri-polar. The Sirte Basin continues to supply approximately 70% of national volumes, relying on vintage but expandable infrastructure. The Murzuq Basin is expected to add growth through Elephant and NC-174, where Repsol’s 2024 re-entry exemplified its new capital appetite. Ghadames Basin is the gas heartland, poised to increase dry-gas and condensate feed into GreenStream once drilling at A1-96/3 completes appraisal.
External commercial linkages magnify Libya’s strategic relevance. Italy sources roughly 25% of its gas imports from GreenStream, and Southern European refiners depend on Libyan crudes for blend optimization. Talks on Egypt inter-connector pipelines and Nigeria-Libya corridor could transform the country into a regional transit and liquefaction hub, contingent upon sustained security and financing clarity. Collectively, these geographic vectors support a balanced, if politically sensitive, expansion pathway for the Libya oil and gas upstream market.
Regulatory Landscape
Libya's upstream sector is governed primarily by Petroleum Law No. 25 of 1955 (and amendments). The Ministry of Oil and Gas (MOG) provides ministerial oversight, while the National Oil Corporation (NOC) acts as the sector operator and contracting counterpart under the Exploration and Production Sharing Agreement (EPSA) framework. Decree No. 32 of 2012 formalizes the MOG organizational structure and powers, reinforcing the split between policy oversight (MOG) and operational and commercial execution (NOC) across licensing, field development, and joint venture management.
A key regulatory-commercial inflection point was the March 2025 launch of an international licensing round by MOG and NOC covering 22 onshore and offshore blocks, with EPSA terms evolving toward an EPSA V structure that incorporates updated fiscal mechanics, including an R-factor (profitability-based) framework. EPSA awards require Council of Ministers approval to become effective, adding a formal government gate to contract finalization, even as NOC remains central to administering contracts and, under the legacy EPSA IV model, handling tax payments on behalf of contractors.
Competitive Landscape
The market exhibits moderate concentration. NOC-led entities and five international majors collectively account for about 65% of 2024 liquids output, leaving room for niche independents to carve out acreage positions. Joint ventures dominate because they blend sovereign oversight with capital and technology infusion, a model unlikely to shift under present policy signals.
Competition now tilts toward technology advantage rather than cost alone. Eni and TotalEnergies deploy fiber-optic downhole sensing to manage water cut in Waha wells, while BP utilizes cloud-based analytics for real-time drilling optimization. Operators who can integrate emissions-reduction projects, such as flare-gas capture or solar-powered pump stations, gain goodwill and potentially receive faster approvals. These differentiators are decisive in winning future Libya oil and gas upstream market licenses.
Strategic white-space resides offshore and in unconventional prospects. Repsol’s 2024 A1-2/130 spud rekindled Mediterranean carbonate interest, and ongoing studies of Paleozoic shale maturity may open a new resource class later in the decade. Service-side gaps remain a hurdle; securing specialized stimulation crews or deepwater vessels often demands long-term framework agreements. Companies equipped to bundle capital with robust risk mitigation will shape competitive dynamics through 2030.
Libya Oil And Gas Upstream Industry Leaders
BP PLC
Eni S.P.A.
National Oil Corporation
PJSC Gazprom
Polskie Górnictwo Naftowe i Gazownictwo S.A.
- *Disclaimer: Major Players sorted in no particular order

Market Opportunities and Future Outlook
The near-term opportunity set is concentrated in gas-led brownfield and offshore optimization tied to existing export infrastructure, particularly GreenStream to Italy. In June 2026, Eni and NOC started up the Sabratha Compression Project by adding a 1,600-ton compression module on the Sabratha platform with around 440 MMscfd capacity, which supports both domestic power supply and export continuity through capacity debottlenecking. Separately, the May 2026 status update on the USD 1.565 billion Bouri Gas Project (reported at 69% completion, with first gas targeted for September 2026) reinforces an investable pipeline around associated-gas capture and offshore gas utilization, aligning with NOC's flaring reduction agenda and the report's gas monetization theme.
For liquids, the market still has room in marginal field development, restart efficiency programs, and re-entry into underexplored acreage opened by the recent licensing cycle. NOC's June 2026 partnership with SLB to develop marginal oil fields points to demand for integrated technical services (well interventions, production optimization, and recovery enhancement) in mature Sirte and Murzuq assets where infrastructure exists, but performance is constrained by decline and surface bottlenecks. The February 2026 award of five blocks under the first international licensing round since 2007, followed by June 2026 signing of exploration and production agreements with Eni, QatarEnergy, Repsol, MOL, and Turkish Petroleum, indicates active pathways for new entrants and returning operators, with onshore development services and exploration activity positioned to benefit as programs move from award into work execution.
Recent Industry Developments
- July 2026: National Oil Corporation (NOC) signed an Exploration and Production Sharing Agreement (EPSA) for Area 47 in the Ghadames Basin with UCC Holding. The agreement was framed around a target of 80,000 bpd and adds a new investor group into Libya's upstream project pipeline, widening participation beyond the established NOC joint-venture set.
- July 2025: BP and Libya's NOC signed a memorandum of understanding to evaluate redevelopment of the Sarir and Messla fields and to assess unconventional potential. The move re-opened a pathway for a major international operator to re-engage on large legacy assets, with technical studies and redevelopment scoping feeding into future drilling, facilities, and service demand.
- December 2024: Repsol resumed drilling operations in the Murzuq Basin with the A1-2/130 well, marking its return to Libya after a decade-long hiatus. The restart signaled improving operational access for foreign operators and helped underpin the shift from restart-only activity toward new drilling and appraisal work in key basins.


Research Methodology Framework and Report Scope
Market Definition and Coverage
For this study, the Libya oil and gas upstream market is defined as the value created from upstream activity in the country, covering exploration, field development, production operations, and end of life work linked to oil and gas producing assets.
Scope exclusions: This sizing does not include downstream refining, retail fuel marketing, or petrochemicals, since they sit outside upstream E and P activity.
Segmentation Overview
- By Location of Deployment
- Onshore
- Offshore
- By Resource Type
- Crude Oil
- Natural Gas
- By Well Type
- Conventional
- Unconventional
- By Service
- Exploration
- Development and Production
- Decommissioning
Data Sources, Market Sizing, and Validation
Desk Research
Desk research was used to build a fact base around Libya production, field and basin context, and the policy environment that shapes upstream activity. We relied on public sources such as National Oil Corporation releases, OPEC and IEA publications, EIA country analysis, and World Bank macro indicators, to anchor demand signals and operating constraints.
To avoid over-relying on one data series, we ran multiple cross-checks using items such as customs and trade statistics for crude and condensate flows, energy ministry or regulator notices where available, and peer-reviewed journal articles on recovery methods and basin geology. Company filings and investor presentations were used selectively to interpret project timelines and capex direction, and a paid subscription for company financials and news helped confirm event dates and budget announcements. These desk sources are illustrative only, and we also used many other public references for data collection, validation, and clarification.
Primary Interviews and Surveys
We interview and survey Libya-based operators, service providers, license holders, regulators, and energy specialists. Their input helps clarify production plans, field work, drilling activity, project timing, pricing assumptions, and spending levels in Libya, while also addressing gaps in public data. We compare responses with desk findings and recheck unusual assumptions before setting the final estimate.
Distribution of primary research fieldwork respondents
| Company type | Respondent position |
|---|---|
| Top tier: 31% | CXOs: 19% |
| Mid tier: 46% | Functional/Unit leaders: 32% |
| Smaller Players: 23% | Managers: 49% |
Market-Sizing & Forecasting
The main sizing logic used a top-down build that starts from Libya liquids and gas production capacity signals, then reconstructs the related upstream activity value through production and development intensity by year. After building that picture, we applied selective bottom-up approximations using sampled project checks, typical unit cost ranges, and a limited roll-up of visible operator activity to see whether totals looked reasonable.
The inputs that mattered most included average daily crude and condensate output, marketed gas volumes, the share of production coming from onshore versus offshore, the pace of field restarts after disruptions, and development and decommissioning schedules that affect spend patterns. Cost and value assumptions were adjusted using inflation and exchange-rate timing, as well as the mix between drilling and workover activity, since that changes unit economics. For forecasting, scenario analysis was used so base, conservative, and upside cases could be tested around outage risk, new licensing progress, and execution speed, and then the final path was aligned to the most consistent view from primary respondents.
Data Validation & Update Cycle
Validation was handled through repeated triangulation checks across production, project timing, and spend intensity, so one weak input did not drive the result. Large year-on-year jumps were flagged, then reviewed by checking the underlying drivers, followed by a second analyst review before sign-off.
We also compared model outputs with independent signals such as capacity targets, known restart events, and visible contracting activity. Re-contacts were triggered when variances stayed unexplained. Reports are refreshed annually, with interim updates when material events occur, and a final pre-delivery pass so clients receive the latest view.
Mordor Intelligence's Libya Oil and Gas Upstream Market Sizing Compared With Other Published Estimates
Published estimates for Libya upstream often vary because the market boundary is not always treated the same, and because some models lean more on investment intent than on realized activity. Differences also come from the chosen base year, the production path assumed through disruption periods, and how costs are translated into USD at the year level.
Key gap drivers in this market usually relate to whether the sizing counts only upstream services and field operations, or whether it also folds in broader capital programs and long-cycle offshore plans before they are executed. The other common driver is the handling of production volatility, where an aggressive restart assumption can lift the near-term market size even if project execution evidence stays limited.
Benchmark comparison
| Source | Market Size | Gaps in Research Methodology |
|---|---|---|
| Mordor Intelligence | USD 2.38 B (2025) | |
| Industry Publisher A | USD 8.70 B (2026) | This figure appears closer to an investment or broader upstream spend view, and it can overstate near-term value if planned offshore and redevelopment budgets are counted before execution is confirmed. |
| Industry Publisher B | USD 3.85 B (2034) | The long-dated projection mixes a longer horizon and different timing assumptions, and it may not reflect near-term outage and restart patterns that affect year-by-year activity and pricing in USD terms. |
Production capacity tracking and year-level activity checks are the evidence that keeps Mordor Intelligence tied to what is likely to be executed in Libya, rather than what is only announced. When scope, timing, and USD conversion are made consistent, the spread narrows and the remaining differences become easier to explain and replicate.


Key Questions Answered in the Report
How fast is crude output expected to grow in Libya between 2026 and 2031?
National production is projected to expand at a 5.69% CAGR, pushing liquids value to USD 3.32 billion by 2031.
What fiscal change is attracting new foreign investors?
The 2025 PSC round lifts after-tax IRR to 35.8%, replacing the earlier EPSA terms that delivered only 2.5%.
Which basin currently supplies most Libyan hydrocarbons?
Sirte Basin provides roughly 70% of national volumes thanks to its dense pipeline and processing grid.
Why is natural gas becoming more strategic for Libya?
European demand diversification and NOC’s 83% flaring-reduction target make gas monetization central to future revenues.
What operational risk continues to threaten export reliability?
Militia-led blockades around Sirte pipelines can trigger force-majeure and rapid output curtailments.
How are operators addressing aging field infrastructure?
They employ Autonomous Inflow Control Devices, ESP upgrades, and planned desalter replacements to sustain plateau rates.
Page last updated on:





