Kinetic Tiles Market Size and Share
Market Overview
| Study Period | 2020 - 2030 |
|---|---|
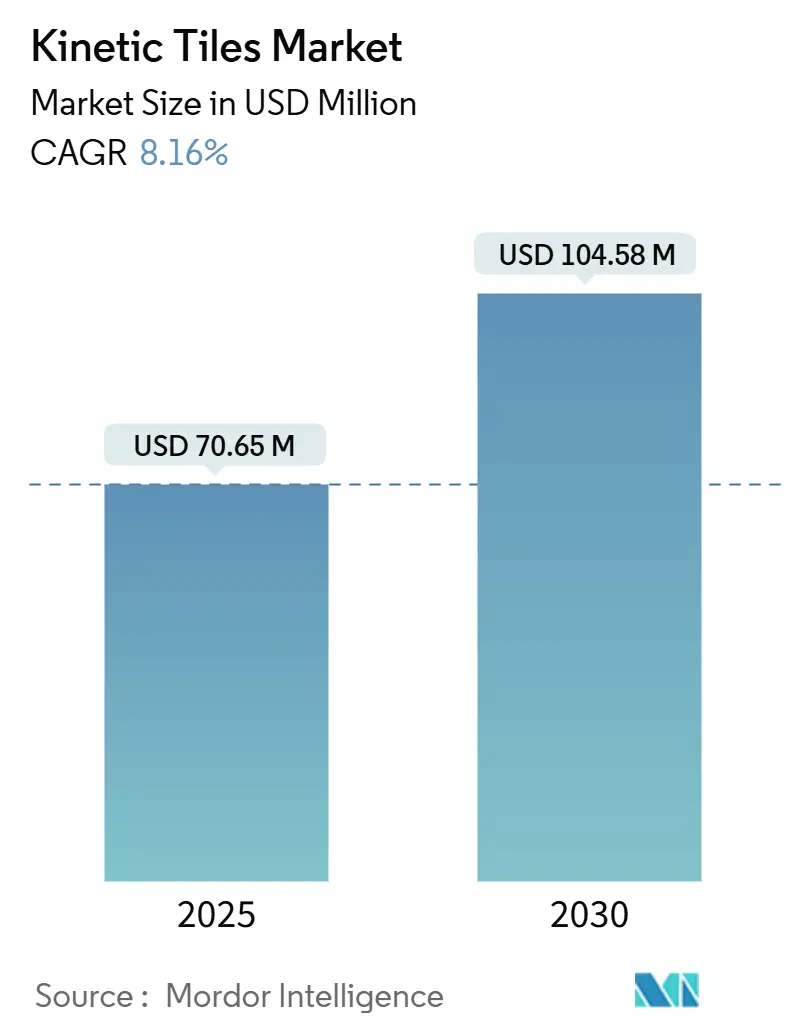
| Market Size (2025) | USD 70.65 Million |
| Market Size (2030) | USD 104.58 Million |
| Growth Rate (2025 - 2030) | 8.16% CAGR |
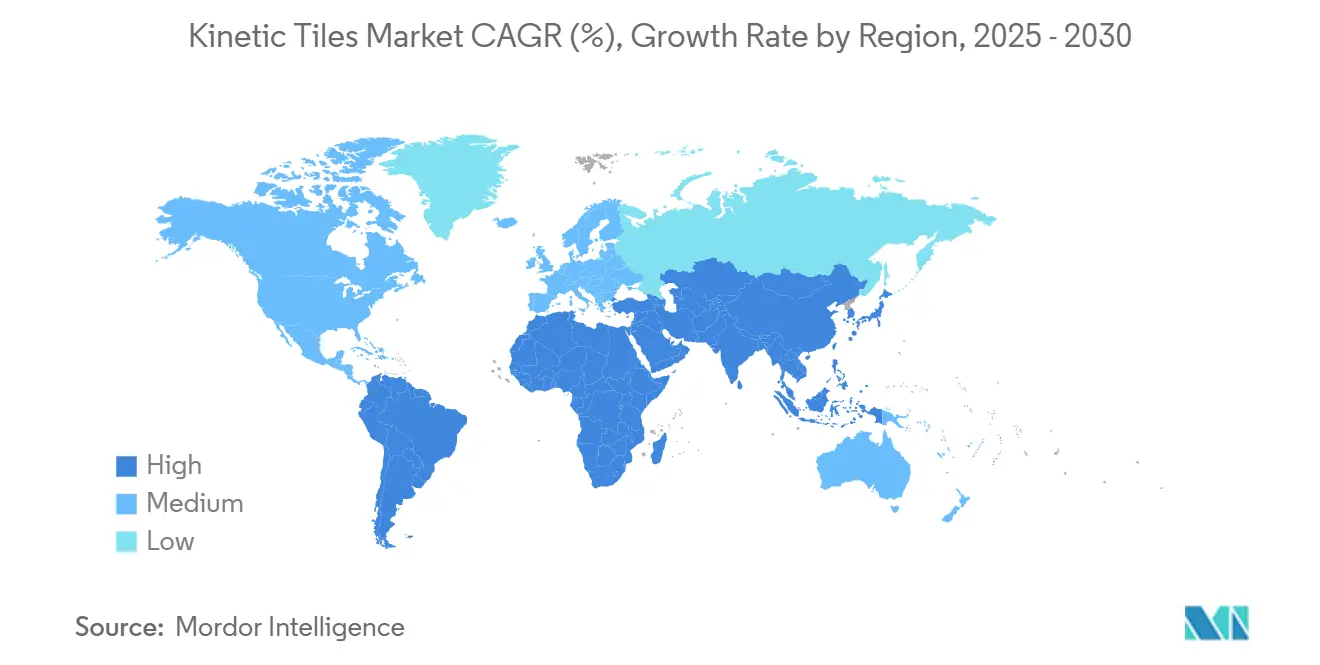
| Fastest Growing Market | Asia Pacific |
| Largest Market | Europe |
| Market Concentration | Medium |
Major Players *Disclaimer: Major Players sorted in no particular order Image © Mordor Intelligence. Reuse requires attribution under CC BY 4.0. | |
Kinetic Tiles Market Analysis by Mordor Intelligence
The Kinetic Tiles Market size is estimated at USD 70.65 million in 2025, and is expected to reach USD 104.58 million by 2030, at a CAGR of 8.16% during the forecast period (2025-2030).
This sturdy trajectory reflects the widening of smart-city budgets, the rapid rollout of IoT, and regulatory pressure to embed on-site renewables. A stable 8.48% year-on-year rise is expected between 2024 and 2025, underscoring durable, demand-led growth rather than speculative surges. Composite materials help keep adoption costs in check, recycled plastics meet circular economy targets, and hybrid piezoelectric-solar systems double the per-step wattage, all of which strengthen the kinetic tiles market's path to mainstream infrastructure budgets. Municipal pilots, from London to Tokyo, showcase repeatable business cases, and edge-powered 5G devices open up incremental revenue streams for technology providers. Rising competition from solar pavements and continuing CAPEX hurdles temper the outlook, but do not derail long-run momentum.
Key Report Takeaways
- By material, composite tiles captured 43.5% of the kinetic tiles market share in 2024, while recycled plastics are set to grow at a 9.6% CAGR to 2030.
- By technology, piezoelectric accounted for 49.8% of the kinetic tiles market size in 2024, whereas hybrid systems are expanding at a 10.4% CAGR.
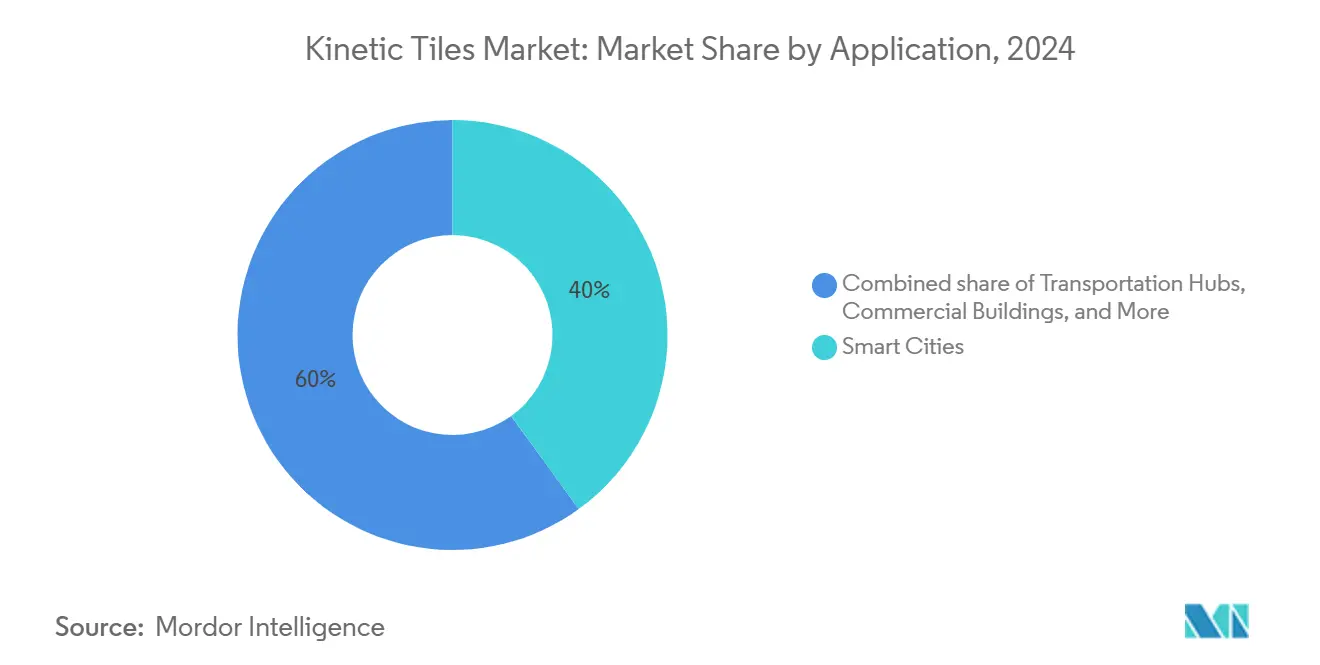
- By application, smart-city deployments accounted for 40.0% of the kinetic tiles market size in 2024 and are projected to grow at a 9.2% CAGR through 2030.
- By end-user, government and municipal entities held a 44.7% share of the kinetic tiles market in 2024; commercial installations are projected to record the highest CAGR at 9.1% through 2030.
- By geography, Europe led with a 41.4% revenue share in 2024, whereas the Asia-Pacific region is forecast to expand at a 10.7% CAGR through 2030.
Global Kinetic Tiles Market Trends and Insights
Drivers Impact Analysis*
| Driver | (~) % Impact on CAGR Forecast | Geographic Relevance | Impact Timeline |
|---|---|---|---|
| Smart-city investment surge | +2.1% | Global, concentrated in APAC and Europe | Medium term (2-4 years) |
| Net-zero mandates for public infrastructure | +1.8% | Europe and North America, expanding to APAC | Long term (≥ 4 years) |
| Advances in piezoelectric efficiency | +1.4% | Global, led by Japan and South Korea R&D | Short term (≤ 2 years) |
| Edge-powered 5G & IoT deployments | +1.2% | Urban centers globally, APAC leadership | Medium term (2-4 years) |
| Experiential retail & event demand | +0.8% | North America and Europe, premium retail segments | Short term (≤ 2 years) |
| Source: Mordor Intelligence | |||
Smart-City Investment Surge
Municipal sustainability budgets now reserve dedicated lines for energy-harvesting technology, elevating kinetic tiles from pilot status to core public works line items. Singapore’s Punggol Digital District integrates tiles with district cooling and pneumatic waste systems, illustrating seamless inclusion in large-scale smart grid planning.[1]ESG Real Estate Laboratory, “Punggol Digital District Smart Infrastructure Briefing,” National University of Singapore, nus.edu.sg Thailand’s seven-pillar Smart City program further validates a policy-driven purchasing cycle that shelters the kinetic tiles market from short-term budget fluctuations.[2]Chris Zevenbergen, “Smart City Policy in Thailand,” Frontiers in Sustainable Cities, frontiersin.org Repeatable return-on-service calculations indicate that payback periods are compressing below 10 years in busy transit hubs. Public-private partnership models reduce municipal risk and build recurring revenue for vendors.
Net-Zero Mandates for Public Infrastructure
European Green Deal building codes and parallel California standards require on-site renewables in new public structures, making kinetic flooring an obvious complement to rooftop solar when horizontal space is scarce. Tokyo Station’s 25 m² installation generating 1,400 kW-seconds daily confirms scalability under commuter densities exceeding 420,000 footfalls. Similar specifications are outlined in U.S. General Services Administration guidelines, aligning government procurement with emissions reduction goals. Predictable replacement cycles for sidewalks and concourses lock in multiyear demand and underpin stable cash-flow forecasts for suppliers.
Advances in Piezoelectric Efficiency
Hybrid piezo-thermo systems uplevel per-step output by 50%, closing the energy-density gap with many thin-film photovoltaic products. Korean cantilever substrates enhance heat dissipation, while new PZT chemistries achieve peak densities of 333 W/ft², sufficient for lighting, displays, and sensor arrays that were once relegated to battery packs. Rapid lab-to-line transfer shortens product cycles, enabling vendors to maintain price points despite raw material volatility. These material gains compress tile thickness, improving accessibility compliance in retrofits.
Edge-Powered 5G & IoT Deployments
Gartner expects more than 1 trillion battery-free sensors by 2035; many will be deployed on pavements, stations, and concourses, where kinetic harvesters excel. Real-world pilots in Seoul and Rotterdam already power air-quality beacons and smart bins, eliminating the cost of periodic battery swaps. Aligning with telecom densification, vendors now bundle tiles with edge gateways, creating vertically integrated offerings that capture both hardware and data-service revenues. Municipal CIOs view such packages as hedge strategies against grid outages, cementing kinetic tiles in capital plans.
Restraints Impact Analysis*
| Restraint | (~) % Impact on CAGR Forecast | Geographic Relevance | Impact Timeline |
|---|---|---|---|
| High CAPEX & long ROI | -1.9% | Global, particularly in developing markets | Long term (≥ 4 years) |
| Durability & maintenance gaps | -1.1% | High-traffic installations globally | Medium term (2-4 years) |
| Competition from solar pavements | -0.7% | Europe and North America, outdoor applications | Medium term (2-4 years) |
| Lack of testing protocols | -0.5% | Global, regulatory compliance markets | Short term (≤ 2 years) |
| Source: Mordor Intelligence | |||
High CAPEX & Long ROI
Turn-key costs range from USD 9,010/kW for modular walkways to USD 9 million for full-terminal retrofits, straining municipal payback thresholds when grid tariffs linger below USD 0.10/kWh.[3]Nor Azrin Norazman, “Economic Feasibility of Kinetic Floors at KLIA,” AIP Conference Proceedings, pubs.aip.org Airports in Kuala Lumpur and Jakarta have postponed deployments until financing models mature. The addition of electronics and storage subsystems can inflate installed costs by up to 25%, making grant funding or carbon credits essential in early-stage regions. Although a long asset life eventually offsets the initial outlay, immediate budget pressure hinders the growth of the kinetic tiles market.
Durability & Maintenance Gaps
Piezoelectric layers exhibit micro-cracking after 800,000 loading cycles, resulting in reduced output and increased service costs. Protective top-sheets, while effective, introduce surface glare and can conflict with slip-resistance codes. A lack of global durability standards makes warranty negotiation difficult and extends procurement cycles. Initiatives within IEC working groups aim to standardize accelerated fatigue tests by 2026; however, until they are adopted, perceived reliability concerns will erode near-term growth.
*Our forecasts treat driver/restraint impacts as directional, not additive. The impact forecasts reflect baseline growth, mix effects, and variable interactions.
Segment Analysis
By Material: Composite Innovation Drives Sustainability Transition
Composite materials accounted for 43.5% of the kinetic tiles market share in 2024, driven by carbon-fiber matrices that incorporate piezo nanoparticles, delivering energy densities of 89.61 µW/cm³ while withstanding heavy pedestrian loads. First-generation ceramic elements are being replaced because composites tolerate higher impact stresses without power loss, which keeps lifecycle costs low for municipal owners. Manufacturers now incorporate post-consumer waste streams, such as shredded PET bottles, into these composites, reducing raw-material costs and aligning with circular-economy initiatives. Rubber tiles continue to serve comfort-centric corridors in schools and hospitals, whereas bio-PVC and chitosan elastomers target temporary walkways in parks where end-of-life biodegradation is mandatory under ISO 14855 norms.
Recycled plastics form the fastest-growing material category, rising at a 9.6% CAGR through 2030 as cities bid award extra points for embodied-carbon savings. Pilot studies indicate that reclaimed silicon from discarded solar panels acquires thermoelectric properties when doped with phosphorus and germanium, thereby increasing the harvestable wattage per step. Energy Floors demonstrated brand value in this space by supplying Coldplay with custom dance-floor tiles made from recycled plastic for a four-year world tour, a high-profile proof of durability under extreme vibration cycles. Polymer research combining PVDF with thermoplastic polyurethane further enhances flexibility, opening wearable and curved-surface use cases that push the kinetic tiles market into adjacent mobility segments.


By Technology Type: Hybrid Systems Accelerate Beyond Traditional Piezoelectric
Piezoelectric tiles held 49.8% of the kinetic tiles market share in 2024 and anchor most large-scale deployments because mature PZT ceramics and PVDF polymers deliver predictable output in high-traffic corridors. Korean labs have recently increased conversion efficiency by 280× through stretchable three-dimensional structures that evenly distribute stress, signaling further yield gains for the installed base. Although electromagnetic harvesters remain the preferred option when higher peak wattage is essential, their heavier form factors limit use in pedestrian walkways. Electrostatic generators occupy a narrow niche in low-force settings such as museum floors, where piezo tiles risk underperformance.
Hybrid formats already contribute the fastest growth, advancing at a 10.4% CAGR to 2030 as suppliers fuse piezo, thermoelectric, photovoltaic, and electromagnetic modules to hedge output against crowd fluctuations and temperature swings. Pavegen’s Solar+ platform pairs SunPower Maxeon Gen 3 cells with kinetic stacks, achieving 24/7 harvesting and a 30% reduction in carbon footprint compared to single-mode arrays. The Korea Institute of Science and Technology’s cantilever design captures heat and vibration, boosting power by 50%. This benchmark pushes the kinetic tiles market size for hybrid systems toward mainstream city-infrastructure budgets. Other emerging options include triboelectric sheets and metamaterial amplifiers that magnify micro-vibrations 45×, widening the technology envelope for low-noise locations. Rapid IEC work on performance standards gives procurement officers confidence that multi-modal harvesters will meet reliability and safety codes, solidifying their role in future municipal bids.
By Application: Smart Cities Lead Infrastructure Integration
Smart-city deployments accounted for 40.0% of the kinetic tiles market size in 2024 and are projected to expand at a 9.2% CAGR through 2030, reflecting strong municipal interest in projects that integrate energy harvesting with public engagement dashboards. Transit hubs, civic plazas, and university quads dominate early rollouts because consistent foot traffic guarantees predictable watt-hour yields, which shorten payback periods to under 10 years in high-density corridors. Commercial real estate owners add kinetic floors in atriums to earn LEED points while encouraging user interaction through mobile apps that convert steps into loyalty rewards. Stadiums and festival grounds employ temporary tile arrays that harvested over 90,000 joules during a recent UEFA Champions League event, proving scalability for short-duration, high-traffic settings.
Hybrid installations that integrate rooftop solar, in-slab batteries, and IoT telemetry enhance uptime when crowds thin out, making airports and bus-rapid-transit stations prime targets for expansion. Cambridge, Massachusetts, has earmarked USD 50,000 for a sidewalk segment that delivers 7 watts per pedestrian stride, enough to keep adjacent LED streetlamps lit for 30 seconds per step. Educational districts utilize systems like STEM teaching tools, which display live power metrics that align with curriculum standards. Healthcare facilities and data centers are categorized in the “Others” bucket, where predictable path traffic supports localized microgrids that back up sensitive electronics during grid disruptions.
By End-User: Government Leadership Drives Market Maturation
Government and municipal buyers held a 44.7% share of the kinetic tiles market in 2024 and are projected to grow at an 8.9% CAGR, reflecting policy mandates that accept 10-15 year payback horizons in exchange for carbon-offset gains. City engineers value resilience; therefore, kinetic pavements are often bundled with solar, geothermal, and wind assets as part of integrated renewable master plans in cities such as Seoul, Tokyo, and Barcelona. Procurement offices also pilot power-purchase-agreement models that shift capital expenditures to energy-service companies, illustrating the convergence of the kinetic tiles industry with mainstream clean-energy finance.
Commercial landlords follow closely, adopting tiles for experiential marketing that increase dwell time and embed ESG data into annual reports. Retail chains experimenting with digital-currency rewards tied to footfall convert harvested joules into customer vouchers, adding a direct revenue dimension to installations. Residential demand remains niche because lower foot-traffic density drives longer ROI, though luxury complexes and eco-villages are testing lobby-based arrays that feed hallway lighting. As public sector specifications mature, supplier economies of scale are expected to shave installed costs, opening the door for broader community-scale and multi-family opportunities over the forecast horizon.
Geography Analysis
Europe led the kinetic tiles market with a 41.4% revenue share in 2024, driven by robust environmental regulations and extensive pedestrian infrastructure. London’s Underground corridors, Amsterdam’s Zuidas district, and multiple Nordic municipal programs provide stable multi-year procurement pipelines.[4]European Commission, “EU Smart Cities Marketplace,” commission.europa.eu Germany’s engineering cluster accelerates product iterations, while EU cohesion funds offset high upfront costs in less affluent member states. Although average annual growth is moderate at 6.2%, the region’s stringent building codes lock in base demand.
The Asia-Pacific region is expected to dominate growth, increasing at a 10.7% CAGR through 2030. Japan anchors the surge through extensive rollouts at Tokyo Station and municipal subsidies covering up to 40% of the cost of kinetic flooring. Singapore’s district-scale demonstrations validate total-cost-of-ownership arguments and feed regional replication. China’s USD 100 billion-plus smart-city outlays diversify order books, though localization hurdles demand partnerships with state-owned contractors. India’s 100-Smart-Cities program provides early-stage pilots, albeit paced by municipal financing constraints.
North America records steady mid-single-digit expansion, aided by California’s zero-emission public building codes and corporate sustainability initiatives in New York and Toronto. Cold-weather pilots in Montréal and Minneapolis confirm tile resilience under freeze-thaw cycles. Latin America and the Middle East contribute early-stage but high-visibility projects, such as Dubai’s Expo legacy sites, illustrating the adaptability of inetic technology across diverse climates and cultural contexts.

Competitive Landscape
The kinetic tiles market remains moderately fragmented. Pavegen holds the leading share through an extensive patent maze and a turnkey software-hardware stack that captures energy and data value. Partnerships with UEFA and Mercedes-Benz solidify its brand recognition and lend de-risked references for city tenders. Energy Floors competes on entertainment-centric projects, emphasizing recycled materials and modular, quick-install designs; its multi-year collaboration with Coldplay proves the durability of its products under touring conditions.
Traditional civil works firms, such as Vinci and Ferrovial, explore kinetic integration to augment bundled infrastructure bids, creating acquisition and joint venture opportunities for niche specialists. Patent analysis reveals a rise in filings for hybrid energy harvesting and integrated storage, foreshadowing the convergence of technology. IEC standardization committees aim to publish durability and power-quality benchmarks in 2026, which is likely to catalyze faster adoption once the compliance risk abates. Consolidation prospects rise as capital intensity increases and buyers favor vendors with proven mass-production capabilities.
Kinetic Tiles Industry Leaders
Pavegen
Energy Floors
POWERleap
KinergyPower
EnGoPlanet
- *Disclaimer: Major Players sorted in no particular order


Recent Industry Developments
- July 2025: Kinetics signed an MOU with Mitsui O.S.K. Lines to develop a floating data-center platform powered by combined kinetic, solar, and wave energy sources.
- January 2025: Pavegen Solar+ hybrid tile merged 24%-efficient SunPower Maxeon Gen 3 cells with electromagnetic modules, cutting embodied carbon 30% relative to earlier versions.
- June 2024: Korea Research Institute of Standards and Science unveiled a metamaterial that amplifies micro-vibrations 45× for low-frequency energy harvesters.
- May 2024: Energy Floors supplied 44 recycled-plastic dance tiles for Coldplay’s four-year Music of the Spheres World Tour.


Global Kinetic Tiles Market Report Scope
| Composite Materials |
| Rubber |
| Recycled Plastics |
| Others |
| Piezoelectric |
| Electromagnetic |
| Electromechanical |
| Hybrid Systems |
| Commercial Buildings |
| Transportation Hubs |
| Smart Cities |
| Fitness & Sports Venues |
| Industrial Warehouses |
| Others |
| Government and Municipal |
| Commercial Enterprises |
| Transport Authorities |
| Retail Chains and Malls |
| Others |
| North America | United States |
| Canada | |
| Mexico | |
| Europe | Germany |
| United Kingdom | |
| France | |
| Italy | |
| NORDIC Countries | |
| Russia | |
| Rest of Europe | |
| Asia-Pacific | China |
| India | |
| Japan | |
| South Korea | |
| ASEAN Countries | |
| Rest of Asia-Pacific | |
| South America | Brazil |
| Argentina | |
| Rest of South America | |
| Middle East and Africa | Saudi Arabia |
| United Arab Emirates | |
| South Africa | |
| Egypt | |
| Rest of Middle East and Africa |
| By Material | Composite Materials | |
| Rubber | ||
| Recycled Plastics | ||
| Others | ||
| By Technology | Piezoelectric | |
| Electromagnetic | ||
| Electromechanical | ||
| Hybrid Systems | ||
| By Application | Commercial Buildings | |
| Transportation Hubs | ||
| Smart Cities | ||
| Fitness & Sports Venues | ||
| Industrial Warehouses | ||
| Others | ||
| By End-User | Government and Municipal | |
| Commercial Enterprises | ||
| Transport Authorities | ||
| Retail Chains and Malls | ||
| Others | ||
| By Geography | North America | United States |
| Canada | ||
| Mexico | ||
| Europe | Germany | |
| United Kingdom | ||
| France | ||
| Italy | ||
| NORDIC Countries | ||
| Russia | ||
| Rest of Europe | ||
| Asia-Pacific | China | |
| India | ||
| Japan | ||
| South Korea | ||
| ASEAN Countries | ||
| Rest of Asia-Pacific | ||
| South America | Brazil | |
| Argentina | ||
| Rest of South America | ||
| Middle East and Africa | Saudi Arabia | |
| United Arab Emirates | ||
| South Africa | ||
| Egypt | ||
| Rest of Middle East and Africa | ||


Key Questions Answered in the Report
What is the current global size of the kinetic tiles market?
Global revenue reached USD 65.13 million in 2024 and is on track for USD 70.65 million in 2025, reflecting a stable 8.48% year-on-year rise.
How fast is the composite material segment expanding in kinetic tile installations?
Composites already hold 43.5% share and continue to grow steadily, supported by carbon-fiber nano-piezo blends that improve durability and output.
Which region is projected to record the fastest growth in kinetic tile adoption through 2030?
Asia-Pacific leads with a forecast 10.7% CAGR, fueled by large-scale deployments in Japan, Singapore, and China.
What are the main factors driving municipal demand for kinetic flooring solutions?
Smart-city funding, net-zero mandates, and the need to power edge IoT devices position kinetic tiles as practical on-site renewable assets.
What challenges do kinetic tile projects face regarding upfront costs?
Installed prices can top USD 9,010 per kilowatt and stretch payback periods, so grants, carbon credits, or public-private partnerships are often required.
Which company leads commercial-scale deployments of kinetic energy tiles?
Pavegen holds the largest share thanks to patented electromagnetic modules and marquee partnerships with brands such as UEFA and Mercedes-Benz.
Page last updated on:


