
Market Overview
| Study Period | 2021 - 2031 |
|---|---|
| Forecast Data Period | 2026 - 2031 |
| Base Year Market Size (2025) | USD 77.69 Billion |
| Market Size (2026) | USD 81.63 Billion |
| Market Size (2031) | USD 104.57 Billion |
| Growth Rate (2026 - 2031) | 5.08 % |
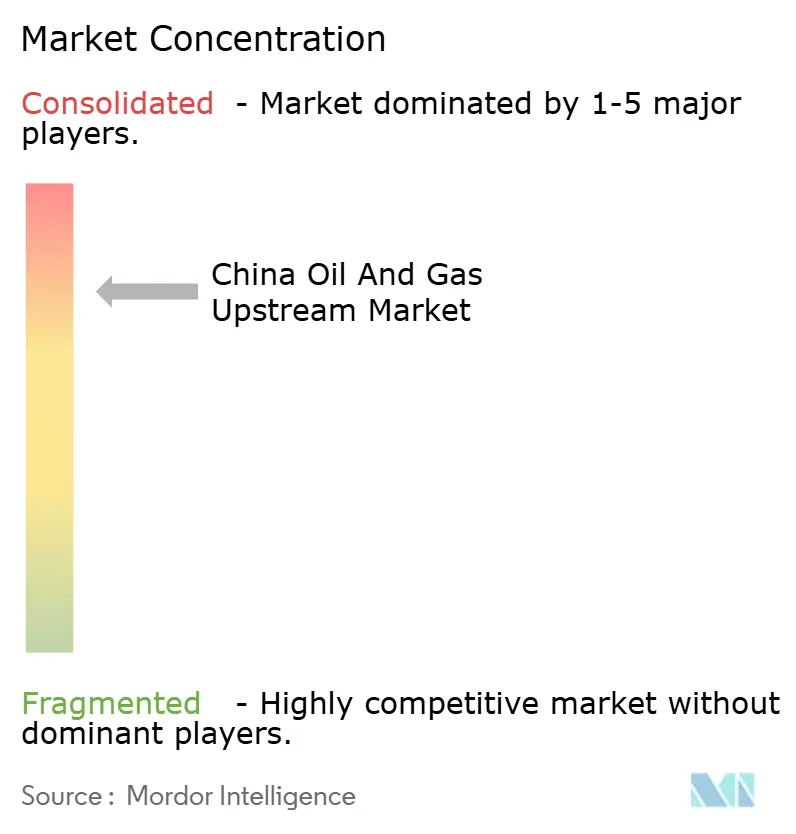
| Market Concentration | High |
Major Players *Disclaimer: Major Players sorted in no particular order Image © Mordor Intelligence. Reuse requires attribution under CC BY 4.0. | |
China Oil And Gas Upstream Market Analysis by Mordor Intelligence
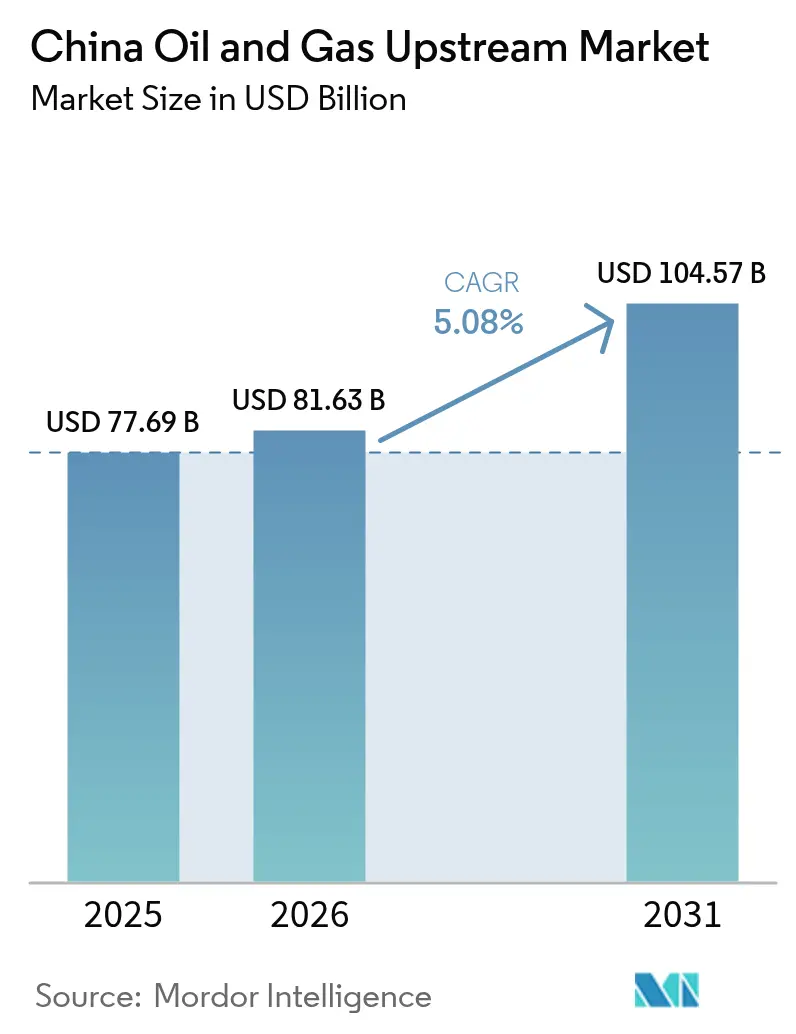
The China Oil And Gas Upstream Market size was valued at USD 77.69 billion in 2025 and estimated to grow from USD 81.63 billion in 2026 to reach USD 104.57 billion by 2031, at a CAGR of 5.08% during the forecast period (2026-2031).
Beijing’s drive for energy self-sufficiency, record upstream capital expenditure by national oil companies (NOCs), and sustained frontier discoveries give the Chinese oil and gas upstream market a strong near- to medium-term growth runway. Ultra-deep well successes in the Tarim and Sichuan basins, combined with digital-drilling rollouts that are trimming per-well costs by 15-20%, broaden the commercial reserve base and accelerate field development cycles. Government tax incentives, import-substitution mandates, and a supportive domestic pricing floor further reinforce investment appetite. Meanwhile, stricter methane-emission rules compel operators to retrofit mature assets, sparking a parallel surge in green technology spending. Together, these dynamics keep the Chinese oil and gas upstream market firmly on a positive trajectory despite global price volatility.
Key Report Takeaways
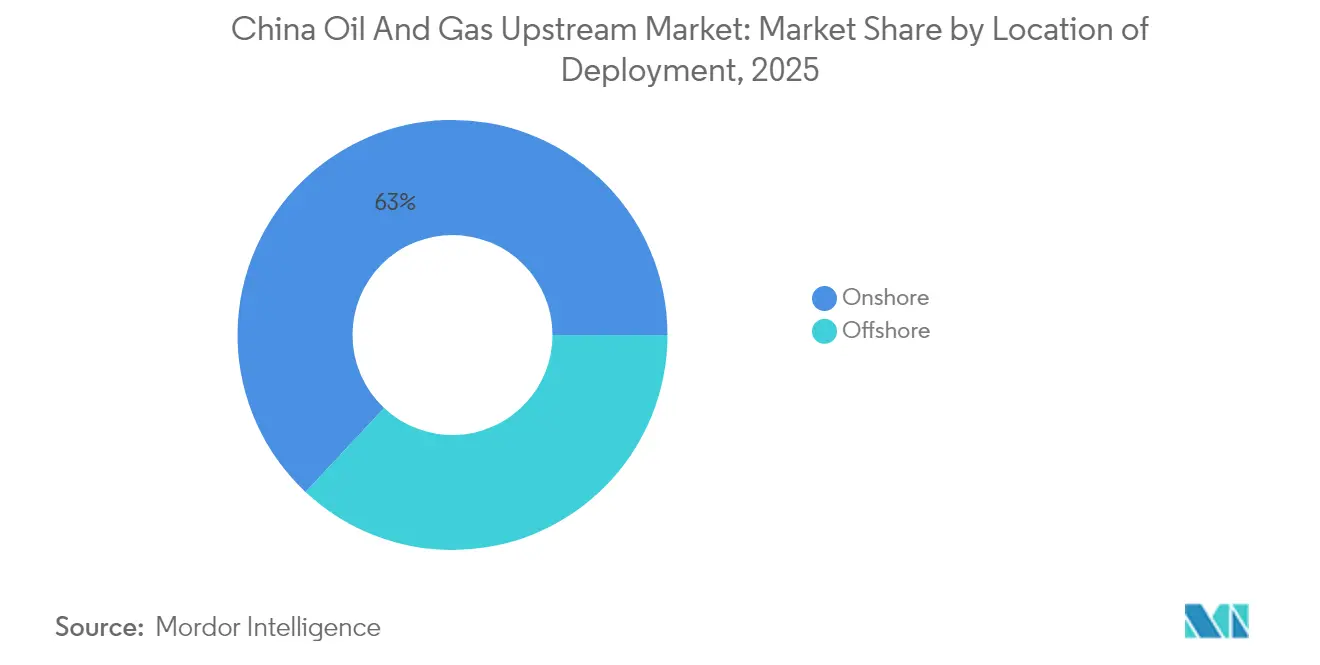
- By location of deployment, onshore operations led with 63.02% of the China oil and gas upstream market share in 2025, while offshore assets are projected to grow at a 5.92% CAGR through 2031.
- By resource type, crude oil accounted for a 56.15% share of the China oil and gas upstream market size in 2025; natural gas development is forecast to expand at a 5.74% CAGR to 2031.
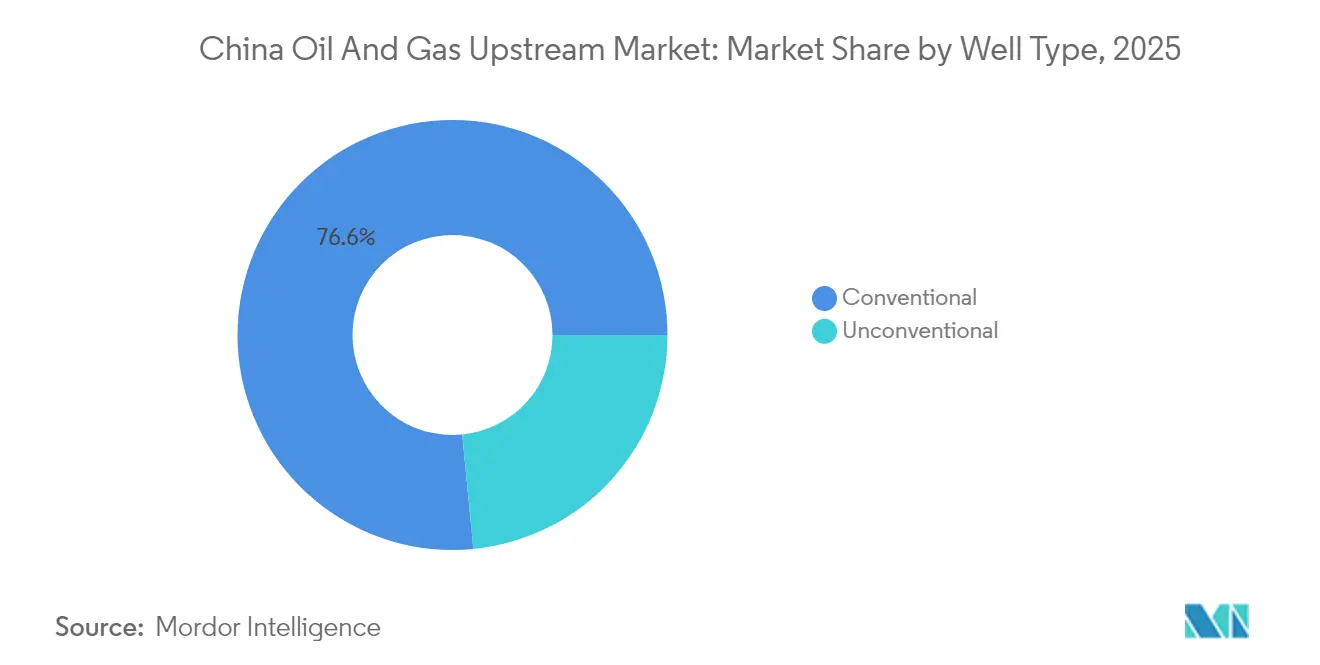
- By well type, conventional wells held 76.55% of the Chinese oil and gas upstream market share in 2025; unconventional drilling is expected to show the fastest growth at a 6.88% CAGR through 2031.
- By service, development and production dominated with 71.85% revenue share in 2025; decommissioning is advancing at a 7.46% CAGR to 2031.
- Regionally, Western provinces contributed 45% of the nation's natural-gas output in 2025 and are projected to record the highest 7.85% CAGR through 2031.
Note: Market size and forecast figures in this report are generated using Mordor Intelligence’s proprietary estimation framework, updated with the latest available data and insights as of 2026.
China Oil And Gas Upstream Market Trends and Insights
Drivers Impact Analysis*
| Discovery of new ultra-deep oil & gas fields (Tarim, Sichuan) | 1.5% | Western China, Xinjiang, Sichuan provinces | Medium term (2-4 years) |
|---|---|---|---|
| Rising upstream investment by Chinese NOCs | 1.2% | National, concentrated in major basins | Short term (≤ 2 years) |
| Government push for energy-security & import substitution | 0.8% | National policy implementation | Long term (≥ 4 years) |
| Digital-drilling & AI well-optimization programs | 0.7% | Major producing regions, technology hubs | Medium term (2-4 years) |
| CO₂-EOR & CCS integration improving field economics | 0.4% | Mature fields in Northeast and North China | Medium term (2-4 years) |
| Source: Mordor Intelligence | |||
Discovery of New Ultra-Deep Oil & Gas Fields
Large-scale discoveries in formations deeper than 6,000 meters have recalibrated the China oil and gas upstream market outlook. CNPC’s Fuman field achieved 2,000 barrels per day from 8,400-meter wells in the Tarim Basin, validating commercial recovery in extreme-depth reservoirs. Sichuan’s Anyue gas field added 500 billion m³ proven reserves in 2024, becoming the country’s single-largest unconventional gas asset. Together, these findings could reduce import dependence by nearly one-tenth by 2030, while exporting high-pressure drilling expertise to overseas markets. Regulatory momentum is visible: 15 exploration blocks were opened in Western China in 2024, signaling deeper resource monetization over the forecast horizon.[1] Equipment suppliers benefit from higher-spec rig demand, and regional governments anticipate new royalties that bolster local economies.
Rising Upstream Investment by Chinese NOCs
Capital outlays surged in 2024 as NOCs shield supply chains against geopolitical shocks. Sinopec lifted upstream spending 15% to USD 38 billion, channeling funds into enhanced-recovery pilots and digital infrastructure. CNOOC committed USD 22 billion to deepwater South China Sea and Bohai Bay projects, underscoring offshore growth ambitions.[2] National project approvals worth USD 95 billion in 2024 further underscore policy support for domestic production expansion. Cost discipline is improving: standardized drilling platforms and modular surface facilities are lowering per-barrel development costs by up to 18%. The cash-flow uplift accelerates reinvestment cycles, reinforcing the growth pattern of the Chinese oil and gas upstream market.
Government Push for Energy Security & Import Substitution
Central planners aim to achieve 200 million tons of annual crude oil output by 2025 and 400 billion cubic meters of gas by 2030 under the 14th Five-Year Plan.[3] The policy mix includes 15% depletion allowances, accelerated depreciation, and a 90-day strategic petroleum reserve requirement that favors domestic barrels. These measures cement long-term demand for local drilling and field-service capacity. Producers respond by increasing their resource-conversion ratios, while provincial agencies expedite permits for marginal fields and brownfield infill wells. Over the forecast window, import-substitution rules tighten the alignment between profitability and national energy objectives, underpinning the resilience of the Chinese oil and gas upstream market against external supply shocks.
Digital-Drilling & AI Well-Optimization Programs
Artificial-intelligence deployment is cutting non-productive time and narrowing well-cost curves. In 2024, PetroChina implemented machine-learning analytics across 2,500 wells, reducing downtime by 20% and increasing drilling speed by 15%. Sinopec operates a real-time digital twin network covering 180 fields, driving recovery factor gains of up to 12%. Automated directional drillers now place boreholes within 2-meter targets, slash human intervention by 60% and enhance worker safety. The Ministry of Industry and Information Technology’s USD 2.8 billion budget for oil and gas digitalization accelerates domestic software and sensor innovation. As these efficiencies mature, they widen the cost-advantage of leading NOCs, preserve margins during price swings, and solidify long-term competitiveness within the Chinese oil and gas upstream market.
Restraints Impact Analysis*
| Price volatility & OPEC+ supply actions | -0.9% | Global market exposure, export-dependent regions | Short term (≤ 2 years) |
|---|---|---|---|
| Stricter national methane-emission regulations | -0.6% | National implementation, heavy emitting basins | Medium term (2-4 years) |
| Water scarcity for fracturing in arid Northwest China | -0.4% | Xinjiang, Inner Mongolia, Northwest provinces | Long term (≥ 4 years) |
| Seismic-safety curbs in earthquake-prone basins | -0.3% | Sichuan, Yunnan, seismically active regions | Medium term (2-4 years) |
| Source: Mordor Intelligence | |||
Price Volatility & OPEC+ Supply Actions
Oil-price swings create budgeting uncertainty, delay final-investment decisions, and pressure free cash flow. OPEC+ cuts in late-2024 lifted Brent toward USD 95 per barrel, boosting revenues but tightening domestic refining margins. Deepwater project hurdles remain: 12 developments await price stability above USD 70 per-barrel breakevens. Chinese NOCs hedge 40-60% of their production, yet shallow derivative markets limit their effectiveness. To soften shocks, regulators enforce a USD 60 per-barrel floor for domestic barrels, cushioning high-cost assets. Even so, cyclical uncertainty restrains spending on frontier plays and shapes a measured capital-allocation approach within the China oil and gas upstream market.
Stricter National Methane-Emission Regulations
New rules cap methane emissions at 0.2% of output and mandate leak-detection retrofits on 15,000 well sites, lifting compliance spend to roughly USD 150,000 per mature well. Operators must install zero-flaring designs in all new drilling, which adds up to 12% to initial capital expenditures. Bonded decommissioning funds, introduced in 2024, compel project owners to ring-fence closure costs, elevating working-capital requirements. Yet, a USD 3.2 billion green-finance program offsets some of these burdens through low-interest loans. Over time, tighter standards build operational resilience and environmental stewardship, but they also moderate returns, thereby trimming the medium-term growth rate of the China oil and gas upstream market.
*Our forecasts treat driver/restraint impacts as directional, not additive. The impact forecasts reflect baseline growth, mix effects, and variable interactions.
Segment Analysis
By Location of Deployment: Onshore Footprint, Offshore Momentum
Onshore assets held 63.02% of the China oil and gas upstream market share in 2025, backed by entrenched infrastructure and lower lifting costs averaging USD 35-45 per barrel. Enhanced-recovery pilots in Daqing and Liaohe prolong plateau output, while revamped gathering systems shrink loss rates. In tandem, the offshore segment is projected to post a robust 5.92% CAGR to 2031 as deepwater technologies mature and policymakers encourage energy diversification. CNOOC's Bozhong 19-6 condensate field proved economically viable at a 1,500-meter water depth and led to follow-up exploration programs across Bohai Bay. Digital monitoring and unmanned platforms are cutting offshore operating costs by 25%, closing the historic cost gap with onshore fields and bolstering project sanction rates.
The Chinese oil and gas upstream market now views offshore acreage as the core frontier for large-scale oil and gas discoveries. Eight new blocks awarded in 2024 span 25,000 km² of prospective South China Sea acreage. Wider use of floating production storage and offloading (FPSO) units avoids long subsea tie-backs and accelerates first-oil timelines. Meanwhile, onshore operations bank on brownfield digitalization and chemical flooding to arrest decline. Over the forecast period, a balanced capital allocation emerges, with mature land assets providing low-risk cash flow and offshore projects delivering volume growth, thereby sustaining the broader China oil and gas upstream market's expansion.

By Resource Type: Liquids Lead, Gas Ascends
Crude oil accounted for 56.15% of the Chinese oil and gas upstream market size in 2025, as refiners relied on domestic sweet blends to optimize their run rates. CO2 injection in Daqing and Shengli lifted recovery by 12-15% and extended field life cycles. Gas is the clear growth pillar, registering a 5.74% CAGR through 2031, mirroring government mandates to increase the fuel’s share in the national primary energy mix. The West-East Pipeline added 15 billion m³ capacity in 2024, enabling Xinjiang’s Tarim output to displace coastal LNG imports. Shale and tight-gas additions in Sichuan and Ordos underpin 40% of the incremental supply, feeding rising city-gas and petrochemical demand.
Environmental regulation prioritizes gas burnout over coal, driving higher pricing transparency that incentivizes upstream investments. Operators also benefit from cross-border pipeline opportunities in Central Asia, which allow for back-hauling surplus volumes. Over the long term, a diversified resource mix underpins security targets and keeps the Chinese oil and gas upstream market less exposed to crude market shocks. Nonetheless, liquids remain indispensable to domestic refineries and petrochemical complexes, ensuring balanced capital allocations between oil and gas portfolios.
By Well Type: Conventional Backbone, Unconventional Upswing
Conventional completions held 76.55% of the Chinese oil and gas upstream market share in 2025, thanks to decades of established infrastructure, a well-developed service ecosystem, and a proven understanding of reservoir behavior. Digital downhole sensors and electrical submersible pumps increased average flow rates by 8% year-over-year, thereby tightening decline curves. Unconventional drilling is expected to rise sharply at a 6.88% CAGR through 2031, spearheaded by the Changning shale gas field, which achieved an annual output of 6 billion m³ in 2024. Horizontal wells now expose 3-5× more pay-zone length than vertical counterparts, while multi-stage fracturing unlocks low-permeability zones.
Water-recycling loops and micro-seismic monitoring address environmental concerns and enhance fracture placement accuracy. Regulators granted 450 unconventional water permits in 2024, underscoring policy support for the segment. Looking ahead, knowledge transfer from U.S. shale plays and local ceramic-proppant capacity expansions reduces import reliance and unit-well costs. Combined, these improvements solidify unconventional resources as a critical growth lever, sustaining the China oil and gas upstream market's trajectory to 2030.
By Service: Production Core, Decommissioning Wave Builds
Development and production services captured a 71.85% revenue share in 2025, reflecting an active rig fleet, a large work-over backlog, and comprehensive lifecycle requirements for thousands of producing wells. High-efficiency rigs and rotary-steerable systems are shortening average spud-to-completion times by 10 days. Meanwhile, decommissioning is outpacing all other service lines, with a 7.46% CAGR, as fields commissioned in the 1980s approach the end of their life. New regulations require cement-plug verification, groundwater protection, and surface restoration within 24 months, which will increase per-well budgets to USD 800,000-1.2 million.
National Energy Administration rules introduced mandatory bonding in 2024, creating a predictable funding pool for closure work and attracting specialized contractors. Exploration services remain steady, supported by 180,000 km² of 3D seismic shot in Western China during 2024. Moving forward, integrated service models that combine drilling, production optimization, and end-of-life solutions will gain share and foster recurring revenue streams, embedding service-sector resilience within the China oil and gas upstream market.
Geography Analysis
The Northeast, anchored by Daqing and Liaohe, remains the heritage hub, accounting for 35% of the nation's crude despite reservoir maturity. Enhanced-recovery pilots, corrosion-resistant tubulars, and real-time steam-flood control stabilize production and create incremental reserve bookings. Western provinces stand out as the strategic centerpiece, with the Tarim and Ordos basins accounting for 45% of national gas output in 2025 and growing at the fastest rate of 7.85% annually through ultra-deep and unconventional completions [CNPC]. Regional infrastructure build-out, including the USD 15 billion transmission package approved in 2024, ties these remote wells to the eastern demand center.
The Sichuan Basin emerges as the flagship unconventional gas cluster, yielding 25 billion cubic meters per year and accounting for 40% of incremental national gas growth. Investors favor the basin’s over-pressured geology and year-round weather advantages. Offshore domains add geographic diversification: South China Sea and Bohai Bay together contributed 14.62% of total hydrocarbons in 2025, but accounted for 60% of discoveries post-2024 as deepwater geophysical imaging improved. CNOOC lifted offshore output to 550 million boe in 2024 and lines up 1,200-meter targets for near-term sanction.
Regulation is region-specific: Eastern provinces impose stricter emissions thresholds due to their dense populations, which is accelerating the adoption of closed-loop gas capture and vapor recovery. Western basins, while less restrictive, face water scarcity constraints that prompt operators to adopt recycling systems. Collectively, these regional nuances shape capital allocation and service demand, weaving a multi-speed growth tapestry across the Chinese oil and gas upstream market.
Regulatory Landscape
China's upstream activity is shaped by central targets and licensing administration led by the National Energy Administration (NEA) and the Ministry of Natural Resources (MNR). In March 2026, policy messaging for the 2026-2030 planning window reiterated maintaining crude output around 4 million bpd (about 200 million tonnes per year) while mandating continued natural gas output growth, keeping domestic exploration and development approvals anchored to energy-security priorities. Permit and tenure clarity is reinforced through the Implementation Regulations of the Mineral Resources Law, effective June 15, 2026, which standardize exploration terms (five-year periods with renewals) and provide for mining rights up to 30 years, supporting long-cycle onshore, ultra-deep, and offshore developments.
Compliance and cost structures are also being adjusted through infrastructure and environmental rules plus tax administration. New management measures for oil and natural gas infrastructure planning, construction, and operation took effect on January 1, 2026, tightening requirements across project planning and operations for pipelines and associated facilities that connect remote basins to demand centers. On the fiscal side, Cai Guan Shui No. 16 set import tax preferences and related VAT arrangements for critical exploration equipment (and certain natural gas import categories) for 2026-2030, which can lower the landed cost of high-spec drilling and subsea packages needed in ultra-deep and offshore programs.
Competitive Landscape
China’s upstream arena exhibits moderate concentration, with three state-owned producers accounting for roughly 75% of domestic volumes. However, internal competition over acreage, technology, and capital efficiency has intensified. CNPC achieved USD 12 per barrel reserves-addition cost in 2024 by standardizing drilling protocols and leveraging a local supplier base. Sinopec and CNOOC prioritize deepwater expansion and digital asset management to differentiate themselves. Proprietary AI algorithms reduce operating costs by 15-20% and enhance production forecasts, reinforcing scale advantages.
International majors participate through technical-service contracts and joint ventures, but tightened local content rules compress margins. Specialized domestic firms, such as Anton and Jereh, capture niches in well stimulation, integrated project management, and decommissioning. The Ministry of Natural Resources’ competitive bidding on exploration blocks widens entry, yet NOCs retain preferred access to strategic acreage. Technology alliances are forming around deepwater drilling packages, advanced subsea systems, and carbon management solutions, creating a layered competitive landscape that supports the ongoing expansion of the Chinese oil and gas upstream market.
China Oil And Gas Upstream Industry Leaders
-
China National Petroleum Corporation (CNPC)
-
China Petroleum & Chemical Corporation (Sinopec)
-
China National Offshore Oil Corporation (CNOOC)
-
PetroChina Co. Ltd.
-
Shell plc (via CNOOC JVs)
- *Disclaimer: Major Players sorted in no particular order
Market Opportunities and Future Outlook
Opportunity is increasingly concentrated at the intersection of stabilization-focused oil output policy and the rising technical difficulty of new barrels. That mix shifts demand toward productivity, recovery, and complex-reservoir execution rather than simple volume growth. In early 2026, NEA leadership publicly emphasized three operational priorities: adding reserves and production, accelerating low-carbon transition, and deepening digital-intelligent transformation, aligning operator spend with digital drilling, emissions controls, and brownfield recovery upgrades. This aligns with operator programs in the market context, including large-scale AI well optimization deployments and field-level digital twin initiatives, which creates room for domestic service firms and technology suppliers in sensors, automation, and integrated production optimization.
Gas-focused upstream and ultra-deep unconventional plays also remain an opportunity lane, supported by policy targets for sustained gas growth and by continued resource upgrades. MNR-approved proven reserve additions in ultra-deep shale (for example, Sinopec's May 2026 approval at the Ziyang Dongfeng shale gas field) point to ongoing drilling, stimulation, and gathering investments in Sichuan-type settings. The 2026-2030 planning focus on gas stockpiling and higher domestic supply raises the value of resilient, connected production. Separately, the shift toward integrated energy development in upstream areas, including oil and gas combined with renewables and carbon management initiatives referenced in 2026 sector priorities, expands contracting and partnership space around CCUS-ready developments, electrified operations, and methane-reduction retrofits across mature fields and newbuild projects.
Recent Industry Developments
- May 2026: CNOOC started full production at the Kenli 10-2 oilfield Phase I in the Bohai Sea, with reported daily output exceeding 20,440 barrels of oil. The project reinforces Bohai's role as a near-shore growth engine and supports upstream service demand for development drilling, facilities operations, and production optimization in shallow-water China.
- May 2026: Sinopec received Ministry of Natural Resources approval for 235.687 billion cubic meters of proven geological reserves at the Ziyang Dongfeng shale gas field. The approval underscores ultra-deep shale as a commercial focus area and increases demand for high-horsepower drilling, completion services, and sour/complex gas handling capabilities across Sichuan-related programs.
- January 2025: CNPC announced a USD 8.5 billion Tarim Basin ultra-deep exploration program targeting 15 wells beyond 8,000 meters. The program reinforces Western China as a core upstream investment corridor and raises demand for specialized rigs, high-pressure drilling tools, and advanced well-control and logging services tailored to extreme-depth reservoirs.
Research Methodology Framework and Report Scope
Market Definition and Coverage
For this study, the market covers spending and revenue linked to upstream oil and gas activity in China, starting from exploration work and drilling through field development and production operations that bring crude oil and raw natural gas to the surface.
Scope exclusions: Midstream and downstream activities (such as transmission pipelines, LNG regasification, refining, petrochemicals, and retail fuels) are not counted in this market size.
Segmentation Overview
- By Location of Deployment
- Onshore
- Offshore
- By Resource Type
- Crude Oil
- Natural Gas
- By Well Type
- Conventional
- Unconventional
- By Service
- Exploration
- Development and Production
- Decommissioning
Data Sources, Market Sizing, and Validation
Desk Research
We start by building a clear fact base on China upstream activity levels and policy direction, because these set the demand pool for exploration and production work. Public sources such as the National Bureau of Statistics of China, the National Energy Administration, China Customs trade statistics, and the Energy Institute Statistical Review help anchor production, imports, and consumption signals that influence upstream plans.
To convert activity signals into value, we also review company annual reports and investor presentations, project and licensing releases, and reporting from industry associations and technical journals that track drilling, offshore developments, and unconventional resource progress. Where needed, paid subscriptions that provide company financials, news and filings, patent datasets, and shipment-level import and export records are used to cross-check timelines and pricing assumptions. This desk research list is not exhaustive, and other public sources were also referred to for data collection, validation, and clarification.
Primary Interviews and Surveys
Primary interviews and surveys were used to test what the desk signals imply on the ground, especially around drilling intensity, offshore activity cycles, and service pricing movements in China. We spoke with a mix of upstream operators, oilfield services participants, and domain experts who track exploration, development, production, and late life asset work, and then we rechecked key assumptions across major producing basins and offshore areas to reduce one-sided views.
Distribution of primary research fieldwork respondents
| Company type | Respondent position |
|---|---|
| Top tier: 29% | CXOs: 16% |
| Mid tier: 53% | Functional/Unit leaders: 26% |
| Smaller Players: 18% | Managers: 58% |
Market-Sizing & Forecasting
Sizing is built using a top-down approach where upstream activity and spending are reconstructed from China-specific supply signals and development plans, and then converted into market value using realistic price and mix assumptions. Inputs that matter here include crude oil and natural gas output trends, drilling and well activity direction (including unconventional wells), offshore project timing, field development intensity, and typical service and operating cost progression that respondents see in contracts.
After the first pass, results are corroborated with selective bottom-up approximations, such as sampling spend per well and per project type, and then scaling those patterns using known activity levels, before totals are adjusted for gaps in public reporting. When data is thin for a niche area, we fill the gap through proxy indicators like announced work programs and equipment utilization comments, and then validate the implied spend with interview feedback.
Forecasting is run using scenario analysis supported by a lighter regression check, so the outlook stays practical when policy, commodity pricing, and offshore project timing shift. Assumptions on price, development pace, and offshore cycle timing are stress-tested with experts, and the forecast is then rolled into annual market values that remain traceable to the activity drivers.
Data Validation & Update Cycle
Before numbers are finalized, outputs are compared with independent signals such as production trajectories, drilling direction, and reported upstream spending cues, and then any unusual jumps are reviewed line by line. If a variance cannot be explained by a clear driver, we revisit assumptions, recheck source statements, and re-contact selected respondents to confirm what changed.
A second analyst review is completed to check arithmetic integrity, unit consistency, and currency timing, followed by a final sign-off pass that focuses on whether the story matches the quantified model. Reports are refreshed annually, and interim updates are made when material events occur, such as major policy shifts, offshore project delays, or sharp cost inflation. Right before delivery, an updated review is performed so clients receive the latest view that fits the defined scope.
Mordor Intelligence's China Oil and Gas Upstream Market Size Versus Other Published Estimates
Published market size numbers can vary a lot, even when the topic name looks the same, because the boundaries and conversion steps are not identical. Differences usually come from what is counted as upstream, which year is treated as the base, and how activity signals are translated into value.
The table shows a visible spread between sources, and in Mordor Intelligence's model the number is built strictly around upstream exploration and production activities in China, without pulling in midstream transport or downstream processing revenue, which keeps the value tied to drilling and field operations rather than the wider oil and gas chain.
Benchmark comparison
| Source | Market Size | Gaps in Research Methodology |
|---|---|---|
| Mordor Intelligence | USD 77.69 B (2025) | |
| Regional Consultancy A | USD 52.87 B (2024) | Uses a different base year and a narrower conversion of activity into revenue, and it can also treat only selected E&P stages as in-scope, which reduces the captured value versus a full upstream activity view. |
| Trade Journal B | USD 54.40 B (2025) | Often reports a conservative case with tighter assumptions on offshore project timing and service price progression, and it may exclude decommissioning and late life field work, which pulls down the total for the same year. |
Overall, the comparison points to scope and assumption choices as the main drivers, more than simple math differences. When upstream is defined carefully, activity indicators are mapped transparently into value, and pricing and timing are rechecked with experts, the final market size becomes easier to replicate and use for planning.
Key Questions Answered in the Report
How large is the China oil and gas upstream market in 2026?
The China oil and gas upstream market size is estimated at about USD 81.63 billion in 2026, following steady growth from 2024’s baseline.
Which segment leads deployment in China’s upstream sector?
Onshore assets hold the largest 63.02% share, benefiting from existing pipelines and lower lifting costs.
What growth rate is projected for offshore developments?
Offshore projects are forecast to expand at a 5.92% CAGR through 2031 as deepwater technologies mature.
How fast are unconventional wells growing?
Unconventional drilling is advancing at a 6.88% CAGR, driven by shale-gas gains in Sichuan and tight-gas successes in Ordos.
What is driving natural-gas expansion in China?
Gas output is rising on the back of policy mandates, pipeline build-out and large new reserves in Western and Southwestern basins.
Why is decommissioning a high-growth service line?
Hundreds of 1980s-era wells face end-of-life closures, and new bonding rules fund systematic decommissioning at a 7.46% CAGR.