Market Overview
| Study Period | 2018 - 2031 |
|---|---|
| Forecast Data Period | 2026 - 2031 |
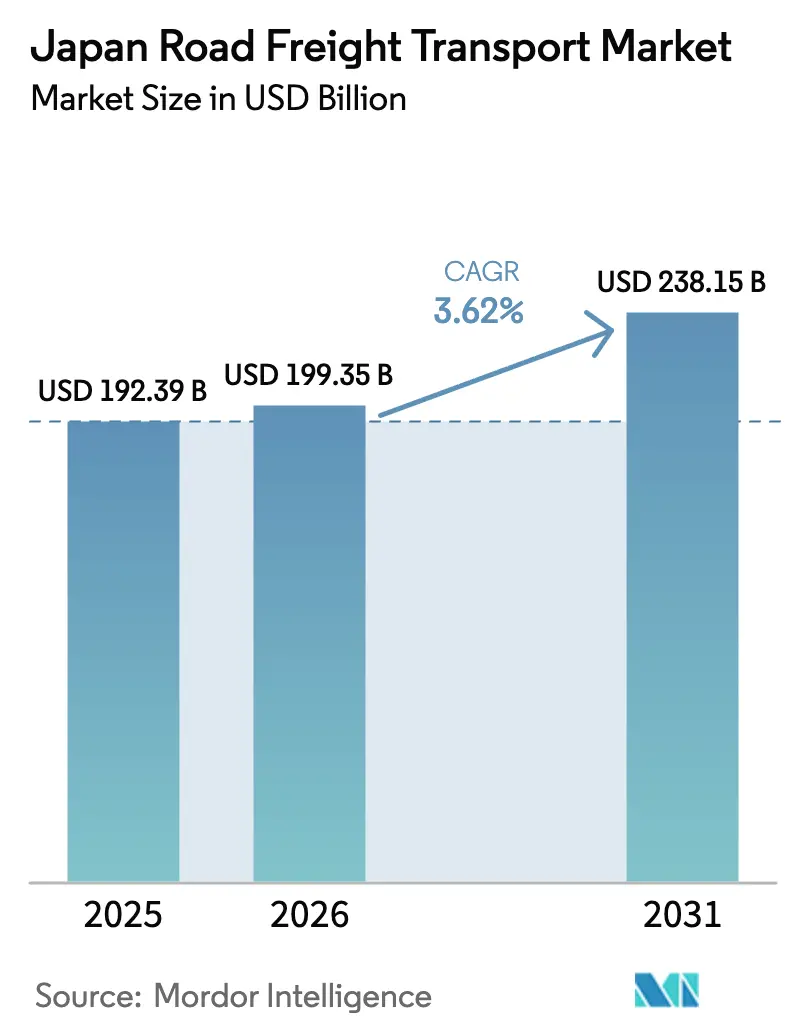
| Base Year Market Size (2025) | USD 192.39 Billion |
| Market Size (2026) | USD 199.35 Billion |
| Market Size (2031) | USD 238.15 Billion |
| Growth Rate (2026 - 2031) | 3.62% CAGR |
| Market Concentration | Low |
Major Players
*Disclaimer: Major Players sorted in no particular order Image © Mordor Intelligence. Reuse requires attribution under CC BY 4.0. |
|
Japan Road Freight Transport Market Analysis by Mordor Intelligence
Japan road freight transport market size in 2026 is estimated at USD 199.35 billion, growing from 2025 value of USD 192.39 billion with 2031 projections showing USD 238.15 billion, growing at 3.62% CAGR over 2026-2031. Demand momentum stems from e-commerce volume expansion, renewed wholesale and retail trade activity, and expressway upgrades that shorten transit times. At the same time, the April 2024 cap limiting each truck driver to 960 overtime hours a year reshapes fleet deployment and cost structures, compelling operators to adopt relay transport, double-trailer rigs, and automated route planning. Major carriers with diversified fleets and technology budgets convert these constraints into margin opportunities, whereas smaller firms confront higher unit costs and shrinking bargaining power. Growing cold-chain needs in pharmaceuticals and fresh food, coupled with government programs to shift bulk cargo to rail, further influence competitive strategy.
Key Report Takeaways
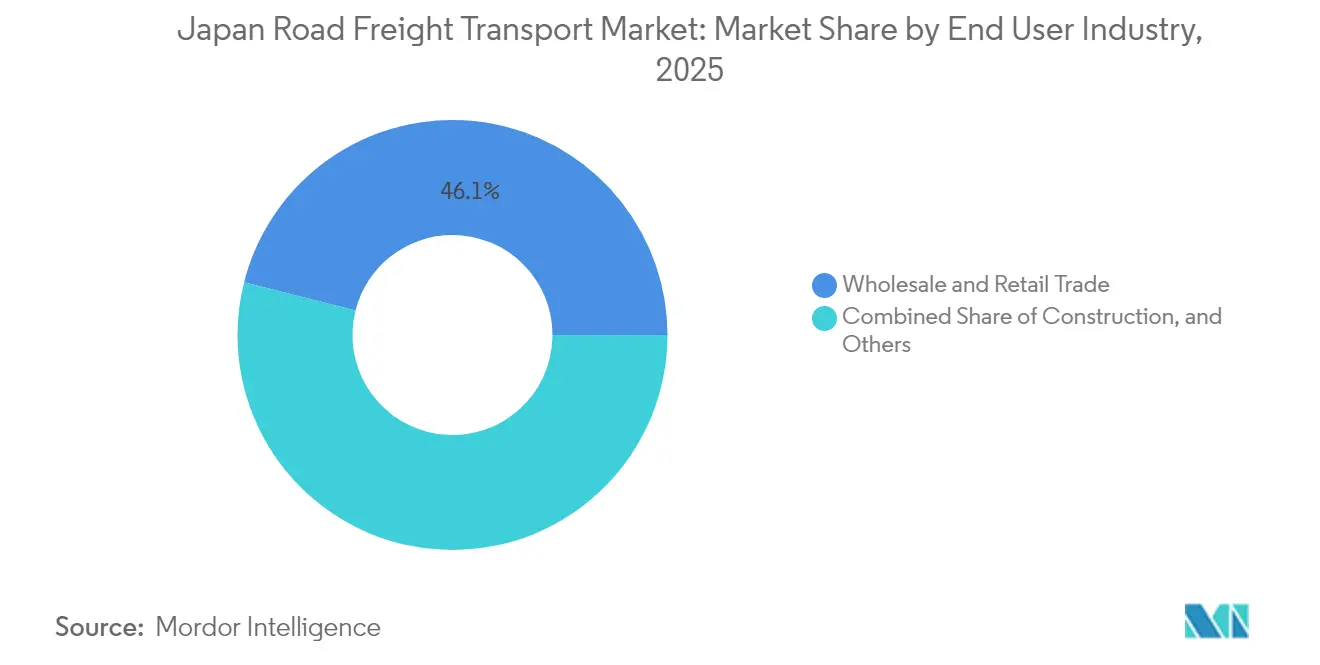
- By end user industry, wholesale and retail trade captured 46.05% of the Japan road freight transport market share in 2025 and is also the fastest-growing segment at a 4.05% CAGR between 2026-2031.
- By truckload specification, full-truck-load services retained 82.35% of the Japan road freight transport market size in 2025, while less-than-truck-load is expanding the quickest at a 4.02% CAGR between 2026-2031.
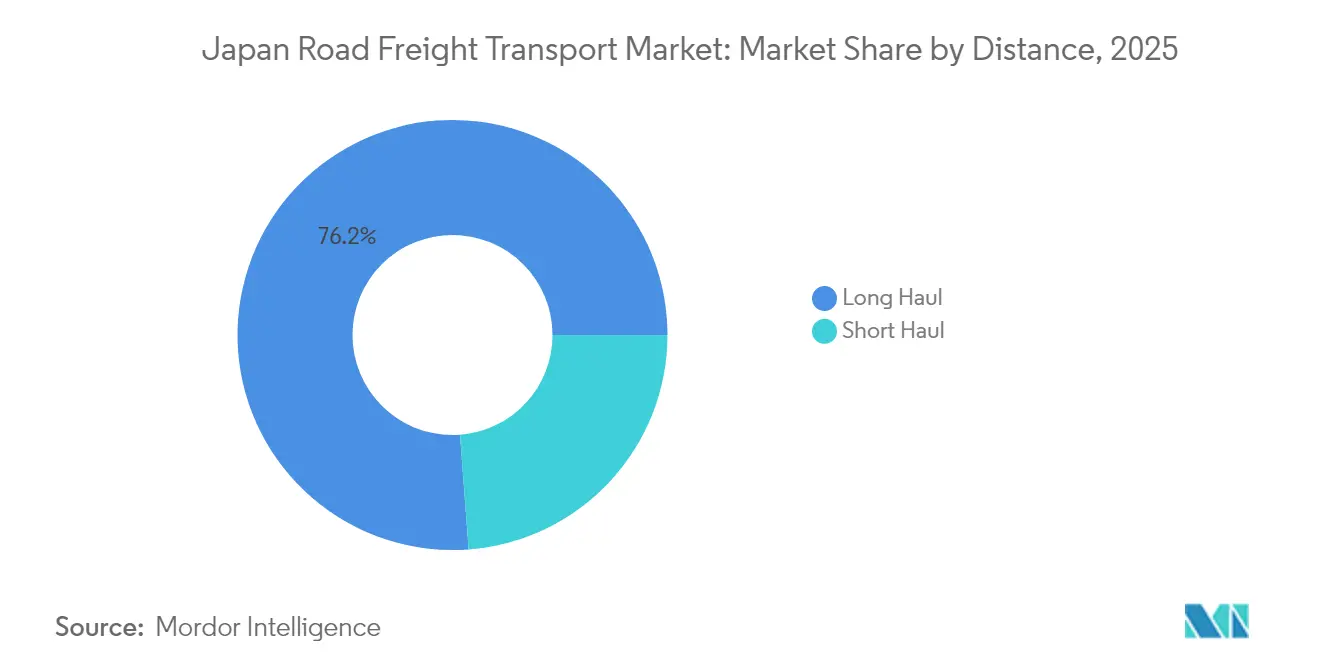
- By distance, long-haul routes held 76.20% share in 2025 and remain the fastest-advancing category at a 3.80% CAGR between 2026-2031.
- By goods configuration, solid cargo led with 60.40% share in 2025, whereas fluid cargo is projected to grow the fastest at a 3.78% CAGR between 2026-2031.
- By containerization, non-containerized freight dominated with 89.40% share in 2025, yet containerized services are rising the fastest at a 3.69% CAGR between 2026-2031.
- By temperature control, non-temperature-controlled freight commanded 94.20% share in 2025, while temperature-controlled shipments are on track for the fastest 3.95% CAGR between 2026-2031.
- By destination, domestic operations accounted for 100.00% share of the market in 2025 and mirror the overall industry growth at a 3.62% CAGR between 2026-2031.
Note: Market size and forecast figures in this report are generated using Mordor Intelligence’s proprietary estimation framework, updated with the latest available data and insights as of 2026.
Japan Road Freight Transport Market Trends and Insights
Drivers Impact Analysis*
| Driver | (~) % Impact on CAGR Forecast | Geographic Relevance | Impact Timeline |
|---|---|---|---|
| E-commerce boom and parcel proliferation | +0.8% | National, Tokyo–Osaka corridor | Short term (≤ 2 years) |
| 2024 logistics-reform price transparency | +0.6% | National, SME operators | Medium term (2-4 years) |
| Expressway expansion and 25 m double trailers | +0.4% | Kanto–Kansai–Kyushu trunk routes | Long term (≥ 4 years) |
| Same-day delivery and cold-chain growth | +0.7% | Urban centers, pharma corridors | Short term (≤ 2 years) |
| Dedicated autonomous truck lanes | +0.3% | Designated expressway sections | Long term (≥ 4 years) |
| “Autoflow-Road” conveyor-belt corridor plan | +0.2% | Tokyo–Osaka industrial belt | Long term (≥ 4 years) |
| Source: Mordor Intelligence | |||


E-Commerce Boom and Parcel Proliferation
Parcel volumes climbed from 3.9 billion in fiscal 2016 to 4.8 billion in fiscal 2021, compressing delivery windows and pushing carriers to adopt automated sortation and micro-fulfillment hubs. Smaller, more frequent shipments replace bulk orders, raising stop density and reshaping vehicle-utilization models. Major platforms invest in regional distribution centers to meet one-day commitments, while last-mile fleets integrate routing software to offset labor constraints. Capacity strain is most evident along the Tokyo-Osaka corridor where consumer demand concentrates. Fast fulfillment promises sustain the Japan road freight transport market as parcel volumes continue their upward trend[1]“A Complete Explanation of the Logistics Industry’s ‘2024 Problem,’” Sumitomo Electric Systems Solutions, traffic-probe.jp.
2024 Logistics-Reform Price Transparency
The 960-hour overtime ceiling exposes true trucking costs, giving carriers leverage to renegotiate rates. Large providers swiftly passed higher labor costs to shippers, while SME operators experienced sticker-shock from shrinking overtime flexibility. Transparent pricing forces retailers and manufacturers to redesign supply chains with realistic freight budgets. Negotiation dynamics now favor carriers, allowing long-overdue margin recovery, especially for rural routes where capacity is tight[2]“The Logistics Problem of 2024: Labor Shortages Due to Tighter Regulations,” Tokyo Shimbun, tokyo-np.co.jp.
Expressway Expansion and 25 M Double-Trailer Permits
Long-distance corridors benefit from new expressway lanes and regulatory approval for 25-meter detachable trailers that double payload per trip PRTIMES.JP. Relay hubs enable driver swaps without unloading, keeping runs within legal work-hour limits. Operators able to fund trailer fleets gain a productivity edge, accelerating market consolidation as smaller firms struggle with up-front investment costs.
Same-Day Delivery and Cold-Chain Growth
Pharmaceutical, fresh food, and meal-kit shippers pay premiums for tightly controlled temperatures and rapid service. As metro residents adopt same-day grocery apps, demand for multi-temperature vehicles rises. Firms with GDP-compliant monitoring systems secure higher yields and long-term contracts, underpinning the Japan road freight transport industry revenue outlook.
Restraints Impact Analysis*
| Restraint | (~) % Impact on CAGR Forecast | Geographic Relevance | Impact Timeline |
|---|---|---|---|
| Acute driver shortage under 960 h cap | −0.9% | National, rural routes | Short term (≤ 2 years) |
| Rising diesel and toll costs for SMEs | −0.5% | National, long-haul routes | Medium term (2-4 years) |
| <35% load factor and 12% pallet standardization | −0.4% | National, manufacturing corridors | Medium term (2-4 years) |
| Passenger traffic-induced congestion | −0.3% | Tokyo–Osaka corridor, weekends | Short term (≤ 2 years) |
| Source: Mordor Intelligence | |||
Acute Driver Shortage Under 960 H Cap
Surveys show 81.4% of carriers cannot recruit enough drivers, with long-haul operators worst hit. Excess overtime once masked labor scarcity; legal limits now expose a deficit that may ground one-third of fleets by 2026 if unaddressed. Young workers reject trucking due to lifestyle concerns, while retirements accelerate. Regional freight could face service gaps unless collaborative delivery or autonomous solutions scale quickly[3]“Japan aims to double marine, rail shipments,” Nikkei Asia, asia.nikkei.com.
Rising Diesel and Toll Costs for SMEs
Diesel averaged USD 0.99 per liter in February 2025, while tolls climbed as expressway maintenance costs rose. Large carriers hedge fuel purchases and negotiate toll rebates, but SMEs absorb cost spikes directly, eroding margins. Persistent fuel inflation accelerates the Japan road freight transport market shakeout as distressed operators accept takeovers[4]“Bulk Cargo Transportation Service for Businesses by Shinkansen,” JR West, prtimes.jp.
*Our forecasts treat driver/restraint impacts as directional, not additive. The impact forecasts reflect baseline growth, mix effects, and variable interactions.
Segment Analysis
By End User Industry: Wholesale and Retail Logistics Synchronize with E-Commerce
Wholesale and retail trade generated 46.05% of the Japan road freight transport market size in 2025 and is forecast to have a 4.05% CAGR between 2026-2031. Integrated omnichannel models merge store restocking with direct-to-consumer parcels, allowing carriers to pool volumes across fast-moving consumables and durable goods. High shipment frequency raises demand for cross-docking hubs near urban centers where real estate is scarce and expensive. Warehouses deploy robotic sorters to manage parcel surges during flash-sale events. Manufacturing traffic remains sizeable, but lean production curbs truck-kilometers per unit. Construction logistics hinges on public works spending cycles and mega-projects related to coastal protection upgrades.
Aging populations shape rural consumption trends, prompting medical supply deliveries and grocery replenishment programs run by municipal governments. Cold-chain complexity grows in fresh food and pharmaceutical wholesale, strengthening margins for specialized fleets. Meanwhile, the oil and mining sectors retain stable but low-growth demand as the energy transition moderates fossil-fuel transport volumes. The segment’s scale ensures its continued dominance within the Japan road freight transport market.


By Destination: Domestic Network Dominance
The market remains 100% domestic, reflecting Japan’s island geography and intricate internal trade flows. Imports and exports rely on road transport only for first and last mile moves between ports or airports and inland facilities.
Continued expressway expansion, updated tolling systems, and smart-gate technology at distribution centers sharpen domestic route efficiency and sustain the Japan road freight transport market’s growth trajectory.
By Truckload Specification: LTL Digital Platforms Gain Traction
Full-truck-load kept 82.35% share in 2025 as it remains indispensable for bulk shipments between factories and distribution centers. Still, less-than-truck-load recorded the top growth rate at 4.02% CAGR between 2026-2031 on the back of e-commerce order fragmentation. Digital marketplaces match smaller consignments with truck space, lifting load factors and lowering cost per unit. Relay operations help FTL fleets comply with driver work-hour rules while maintaining line-haul schedules. LTL’s agility meets inventory-light retail strategies, supporting continuous replenishment of micro-fulfillment sites.
Growth in LTL nudges carriers to invest in dynamic routing algorithms that cut empty mileage. Consolidation depots positioned at expressway interchanges combine different shippers’ parcels into single runs, improving network density. The progress of LTL confirms a structural pivot toward flexible distribution within the Japan road freight transport industry.
By Containerization: Gradual Standard Shift toward Intermodal
Non-containerized freight still represents 89.40% of revenue in 2025, yet containerized shipments are on a 3.69% CAGR between 2026-2031 trajectory, thanks to government goals of doubling rail and sea share by 2030. Investments in inland container depots and twin-lift cranes at regional logistics parks attract shippers seeking predictable handovers between truck, rail, and coastal feeder vessels. Standardized units improve cargo security and trim handling labor, critical under overtime limits.
Specialized freight such as auto parts still favors direct loading, keeping non-containerized services relevant. Yet state subsidies for container chassis acquisition and terminal fees encourage smaller carriers to join the intermodal ecosystem, gradually changing the Japan road freight transport industry’s operating mix.
By Distance: Long-Haul Resilience amid New Operating Models
Long-haul services contributed 76.20% of revenue in 2025 and will expand at a 3.80% CAGR between 2026-2031, despite driver time limits. Relay hubs positioned every 400 km allow inbound drivers to exchange loaded trailers with outbound crews, keeping each driver within daily hour ceilings while preserving total route length. Autonomous pilot projects on Kyushu–Kanto corridors test electronic tow-bar platoons that lower fuel consumption and extend duty life for scarce drivers. Short-haul and urban delivery segments complement trunk routes, linking ports, airports, and rail yards with final recipients.
Infrastructure enhancements such as wider expressway corridors and dedicated rest-stops with electric-truck charging stations boost long-haul productivity. The government’s modal-shift subsidies encourage rail usage for heavy cargo, yet the high frequency of consumer parcels secures a durable role for road services in the Japan road freight transport market.
By Goods Configuration: Solid Cargo Leverages Standardization
Solid cargo accounted for 60.40% shipment value in 2025, benefiting from pallet and packaging standardization that streamlines loading and unloading. Fluid cargo, while only 39.60% of turnover, is growing faster at 3.78% CAGR between 2026-2031 as chemical, beverage, and liquid food producers scale specialized tanker fleet demand. Safety regulation compliance costs are higher for fluid carriers, yielding better yields for certified operators. Solid-cargo haulers exploit modular containers to improve intermodal flexibility, especially when rail links can absorb trunk haul portions.
An uptick in battery-grade chemical transport linked to electric-vehicle supply chains enlarges the fluid segment. Conversely, automotive parts, electronics, and consumer goods preserve solid cargo’s share within the Japan road freight transport market.
By Temperature Control: Cold-Chain Builds Premium Niche
Temperature-controlled shipments occupied 5.80% share in 2025 but will outpace the broader market at 3.95% CAGR between 2026-2031. Vaccination drives, biologic drug launches, and home-delivered meal kits anchor double-digit growth in urban cold-chain corridors. Operators deploy telematics sensors that transmit real-time temperature, humidity, and shock data, ensuring GDP compliance and insurer confidence. Expansion of suburban dark stores for same-day grocery drives short-haul refrigerated van demand.
Non-temperature-controlled freight will dominate volume for the foreseeable future, yet the cold-chain niche commands superior margins, making it a strategic priority for diversified carriers eager to offset rate pressure elsewhere in the Japan road freight transport market.
Geography Analysis
Kanto, anchored by Tokyo, generates the bulk of freight because it houses one-third of the population and the nation’s largest consumer base. Daily truck departures from nearby Chiba, Saitama, and Kanagawa distribution clusters replenish store shelves, e-commerce lockers, and factory lines. Kansai, led by Osaka and Kobe, forms the primary western hub; it integrates electronics assembly in Kyoto and Hyogo with container traffic through Kobe port. Relay transport pilots on the Shin-Meishin Expressway enable crossover between Kanto and Kansai fleets while respecting overtime caps.
Expressway congestion peaks on weekend leisure surges, forcing carriers to adjust schedules or pay higher tolls for off-hour access slots. The Ministry of Land, Infrastructure, Transport and Tourism experiments with dynamic tolls and freight-only lanes to alleviate traffic, though nationwide rollout is years away. High-speed rail freight pilots using repurposed Shinkansen cars connect Osaka, Hiroshima, and Fukuoka, offering same-day alternatives for urgent shipments. Despite early promise, capacity is limited, so road remains irreplaceable for bulk and oversized loads in the Japan road freight transport market.
Rural prefectures confront shrinking trucking supply as aging drivers retire and fleet owners close shop. Municipal authorities subsidize cooperative pooling centers where multiple SMEs share drivers and equipment on rotating schedules. Autonomous shuttle experiments on farmer co-op routes in Hokkaido hint at future mitigation, but regulatory clearance is pending. Geographic disparities therefore persist and influence carrier network planning, with forwarders charging rural surcharges to maintain profitability.
Competitive Landscape
Over 60,000 licensed operators make the market structurally fragmented, yet the three largest—Yamato Transport, Sagawa Express, and Nippon Express—command meaningful pricing power through nationwide networks and IT investment capacity. Combined, they hold a significant share, enabling multi-modal service bundles that attract enterprise customers. Yamato’s “Cool TA-Q-BIN” expansion added 400 multitemperature trucks in 2025, while Sagawa upgraded AI route planners that cut empty kilometers by 12%. Nippon Express launched a hybrid rail-road service to court customers worried about driver shortages.
M&A gathered pace as regulatory limits and cost inflation pressured margins. Asahi Logistics purchased Rainbow Logistics in May 2025 to strengthen Kansai reach. Trasaburou absorbed Side Express in June 2025 to consolidate light-cargo capacity. Mitsui & Co. moved upstream by acquiring a U.S. truck auction firm, signaling interest in asset-light value chains.
Technology differentiation widens the gap between leaders and laggards. Autonomous truck trials by T2 Inc. on beverage routes cut carbon emissions by 6% and halved driver requirements per convoy. Smaller firms adopt off-the-shelf telematics and digital freight platforms like Hakobel Dispatch to stay competitive, but scale constraints limit proprietary R&D budgets. The investment gulf accelerates a two-tier structure within the Japan road freight transport industry.
Japan Road Freight Transport Industry Leaders
-
Hitachi Transport System
-
Nippon Express Holdings
-
Yamato Transport Co., Ltd.
-
SG Holdings (Sagawa Express)
-
Seino Holdings Co., Ltd.
- *Disclaimer: Major Players sorted in no particular order

Recent Industry Developments
- August 2025: DHL Group launched a Japan pilot program using hydrogen fuel cell trucks in 2025 to advance zero-emission logistics.
- August 2025: All Nippon Airways finalized the takeover of Nippon Cargo Airlines, expanding integrated air-road offerings.
- August 2025: Japan Post Co., Ltd. announced investment of JPY 370 billion (USD 2.62 billion) for new logistics hubs in Nagoya (2025), Osaka (2026), and Tokyo (planned), doubling parcel processing capacity with automation and unmanned vehicles.
- February 2025: SG Holdings acquired Morrison Express to complement and expand the global supply chain and logistics services.


Japan Road Freight Transport Market Report Scope
Agriculture, Fishing, and Forestry, Construction, Manufacturing, Oil and Gas, Mining and Quarrying, Wholesale and Retail Trade, Others are covered as segments by End User Industry. Domestic are covered as segments by Destination. Full-Truck-Load (FTL), Less than-Truck-Load (LTL) are covered as segments by Truckload Specification. Containerized, Non-Containerized are covered as segments by Containerization. Long Haul, Short Haul are covered as segments by Distance. Fluid Goods, Solid Goods are covered as segments by Goods Configuration. Non-Temperature Controlled, Temperature Controlled are covered as segments by Temperature Control.
End User Industry
| Agriculture, Fishing, and Forestry |
| Construction |
| Manufacturing |
| Oil and Gas, Mining and Quarrying |
| Wholesale and Retail Trade |
| Others |
Destination
| Domestic |
| International |
Truckload Specification
| Full-Truck-Load (FTL) |
| Less than-Truck-Load (LTL) |
Containerization
| Containerized |
| Non-Containerized |
Distance
| Long Haul |
| Short Haul |
Goods Configuration
| Fluid Goods |
| Solid Goods |
Temperature Control
| Non-Temperature Controlled |
| Temperature Controlled |
| End User Industry | Agriculture, Fishing, and Forestry |
| Construction | |
| Manufacturing | |
| Oil and Gas, Mining and Quarrying | |
| Wholesale and Retail Trade | |
| Others | |
| Destination | Domestic |
| International | |
| Truckload Specification | Full-Truck-Load (FTL) |
| Less than-Truck-Load (LTL) | |
| Containerization | Containerized |
| Non-Containerized | |
| Distance | Long Haul |
| Short Haul | |
| Goods Configuration | Fluid Goods |
| Solid Goods | |
| Temperature Control | Non-Temperature Controlled |
| Temperature Controlled |


Market Definition
- Agriculture, Fishing, and Forestry (AFF) - This end user industry segment captures the external (outsourced) logistics expenditure incurred by the AFF industry players on road freight transport service. The end user players considered are the establishments primarily engaged in growing crops, raising animals, harvesting timber, harvesting fish & other animals from their natural habitats and providing related support activities. Herein, across the value chain, Logistics Service Providers (LSPs) play a crucial role in acquisition, storage, handling, transportation, and distribution activities for the optimal & continuous flow of inputs (seeds, pesticides, fertilizers, equipment, and water) from manufacturers or suppliers to the producers and smooth flow of output (produce, agro-goods) to distributors/ consumers. This includes both termperature controlled and non-temperature controlled logistics, as and when required according to the shelf life of goods being transported or stored.
- Construction - This end user industry segment captures the external (outsourced) logistics expenditure incurred by the construction industry players, on road freight transport service. The end user players considered are the establishments primarily engaged in constructing, repairing and renovating residential & commercial buildings, infrastructure, engineering works, subdividing and developing land. Logistics Service Providers (LSPs) play a crucial role in increasing profitability of construction projects by maintaing the inventory of raw materials & equipment, time-critical supplies and by providing other value added services for effective project management.
- Containerized Road Freight Transport - The segment captures the external (outsourced) logistics expenditure incurred by the road freight transport service end users on Full-Truck-Load (FTL) services. FTL road freight transport is characterized as a full single load not combined with other shipments. It comprises of shipments (i) devoted to the goods of a single shipper (ii) taken directly from a point of origin to one or more destination points (iii) comprising of bulk mail truck transportation (iv) comprising of both Container (Full Container Load, FCL)/Non-Container trucking services (v)comprsing of goods requiring temperature controlled or non-temperature controlled transportation services (vi) comprising of bulk liquid tankering (vii) invoving trucking of waste (viii) hazardous material trucking. Related value added services (VAS) of sorting, consolidation, deconslidation are included in the other services segment of freight and logistics market.
- Export Trends and Import Trends - Overall logistics performance of an economy is positively and significantly (statistically) correlated to its trade performance (exports and imports). Hence, in this industry trend, total value of trade, major commodities/ commodity groups and the major trade partners, for the studied geography (country or region as per the scope of report) have been analysed alongside the impact of major trade/logistics infrastructure investments & regulatory environment.
- Fluid Goods - The segment captures the external (outsourced) logistics expenditure incurred by the road freight transport service end users for the transport of bulk liquids, that are often used in extraction, manufacturing, food processing, agriculture industries among others. It includes transportation of liquids like (i) Chemicals/ hazardous goods (for instance acids) (ii) Water (potable as well as waste) (iii) Oil and gas (upstream as well as downstream like gasoline, fuel, crude oil, or propane), (iv) Food grade bulk liquids (like milk, or juice), (v) Rubber, (vi) Agrichemical products, among others. These goods are generally transported through tanker trucking.
- Fuel Price - Fuel price spikes can cause delays and diruption for logistics service providers (LSPs), while drops in the same can result in higher short-term profitability and increased market rivalry to offer consumers with the best deals. Hence, the fuel price variations have been studied over the review period and presented along with the causes as well as market impacts.
- Full-Truck-Load (FTL) Road Freight Transport - The segment captures the external (outsourced) logistics expenditure incurred by the road freight transport service end users on Full-Truck-Load (FTL) services. FTL road freight transport is characterized as a full single load not combined with other shipments. It comprises of shipments (i) devoted to the goods of a single shipper (ii) taken directly from a point of origin to one or more destination points (iii) comprising of bulk mail truck transportation (iv) comprising of both Container (Full Container Load, FCL)/Non-Container trucking services (v)comprsing of goods requiring temperature controlled or non-temperature controlled transportation services (vi) comprising of bulk liquid tankering (vii) invoving trucking of waste (viii) hazardous material trucking. Related value added services (VAS) of sorting, consolidation, deconslidation are included in the other services segment of freight and logistics market.
- GDP Distribution by Economic Activity - Nominal Gross Domestic Product and distribution of the same, across major economic sectors in the geography studied (country or region as per scope of the report) have been studied and presented in this industry trend. As GDP is positively related to the profitability and growth of logistics industry, this data has been used in adjunction to the input-output tables/ supply-use tables for analyzing the potential major contributing sectors towards the logistics demand.
- GDP Growth by Economic Activity - Growth of Nominal Gross Domestic Product across major economic sectors, for the geography studied (country or region as per scope of the report) have been presented in this industry trend. This data has been utilized for assessing the growth of logistics demand from all the market end users (economic sectors considered here).
- Inflation - Variations in both Wholesale Price Inflation (YoY change in producer price index) and Consumer Price Inflation have been presented in this industry trend. This data has been used to assess the inflationary environment as it plays a vital role in smooth functioning of the supply chain, directly impacting the logistics operational cost components e.g., pricing of tyres, driver wages & benefits, energy/fuel prices, maintenace costs, toll charges, warehousing rents, custom brokerage, forwarding rates, courier rates etc. hence impacting the overall freight and logistics market.
- Key Industry Trends - The report section named "Key Industry Trends" include all the key variables/parameters studied to better analyze the market size estimates and forecasts. All the trends have been presented in the form of data points (time series or latest available data points) along with analysis of the paramter in the form of concise market relevant commentary, for the geography studied (country or region as per the scope of report).
- Key Strategic Moves - The action taken by a company to differentiate from its competitor or used as a general strategy is referred to as a key strategic move (KSM). This includes (1) Agreements (2) Expansions (3) Financial Restructuring (4) Mergers and Acquisitions (5) Partnerships, and (6) Product Innovations. Key players (Logistics Service Providers, LSPs) in the market have been shortlisted, their KSM have been studied and presented in this section.
- Less than-Truck-Load (LTL) Road Freight Transport - The segment captures the external (outsourced) logistics expenditure incurred by the road freight transport service end users on Less than-Truck-Load (LTL) services. LTL road freight transport is characterized as multiple shipments combined onto a single truck for multiple deliveries within a network. It comprises of establishments (i) primarily engaged in general and specialized freight trucking of less than complete truck-loads, (ii) characterized by the use of terminals to consolidate shipments, generally from several shippers, into a single truck for haulage between a load assembly terminal and a disassembly terminal, where the load is sorted and shipments are re-routed for delivery (iv) Less than-Container-Load (LCL) shipping/ Groupage Shipping in case of trucking services. The activities in scope include (i) local pick-up, (ii) line-haul, and (iii) local delivery. Related value added services (VAS) of sorting, consolidation, deconslidation are included in the other services segment of freight and logistics market.
- Logistics Performance - Logistics Performance and Logistics Costs are the backbone of trade, and influences trade costs, making countries compete globally. Logistics performance is influenced by market wide adopted supply chain management strategies, government services, investments & policies, fuel/ energy costs, inflationary environment etc. Hence, in this industry trend, the logistics performance of the geography studied (country/ region as per the scope of report) has been analysed and presented over the review period.
- Major Truck Suppliers - Market share of truck brands is influenced by factors like geographical preferences, portfolio of truck types, truck prices, local production, truck repair & maintenance service peneteration, customer support, technological innovations (like electric vehicles, digitalization, autonomous trucks), fuel efficiency, financing options, annual maintenance costs, availability of substitutes, marketing startegies etc. Hence, the distribution (share % for base year of the study) of truck sales volume for leading truck brands and commentary on current market scenario & market anticipation over the forecast period have been presented in this industry trend.
- Manufacturing - This end user industry segment captures the external (outsourced) logistics expenditure incurred by the Manufacturing industry players, on road freight transport service. The end user players considered are the establishments primarily engaged in the chemical, mechanical or physical transformation of materials or substances into new products. Logistics Service Providers (LSPs) play a crucial role in maintaining a smooth flow of raw materials across the supply chain, enabling timely delivery of finished goods to distributors or end customers and storing & supplying the raw materials to clients for just-in-time manufacturing.
- Modal Share - Freight Modal Share is influenced by factors like modal productivity, government regulations, containerization, distance of shipment, temperature control requirements, type of goods, international trade, terrain, speed of delivery, shipment weight, bulk shipments, etc. Also, modal share by tonnage (tons) and modal share by freight turnover (ton-km) differ as per average distance of shipments, weight of major commodity groups transported in the economy and number of trips. This industry trend represents the distribution of freight transported by mode of transport (tons as well as ton-km), for the study base year.
- Oil and Gas, Mining and Quarrying - This end user industry segment captures the external (outsourced) logistics expenditure incurred by the extraction industry players, on road freight transport service. The end user players considered are the establishments that extract naturally occurring mineral solids, such as coal and ores; liquid minerals, such as crude petroleum; and gases, such as natural gas. Logistics Service Providers (LSPs) covers entire phases from upstream to downstream and plays a crucial role in the transportation of machinery, drilling equipments, extracted minerals, crude oil & natural gas and refined/ processed products from one place to another.
- Other End Users - Other end user segment captures the external (outsourced) logistics expenditure incurred by the financial services (BFSI), real estate, educational services, healthcare, and professional services (administrative, waste management, legal, architectural, engineering, design, consulting, scientific R&D), on road freight transport service. Logistics Service Providers (LSPs) plays a crucial role in the reliable movement of supplies and documents to/from these industries such as transporting any equipment or resources required, shipping confidential documents and files, movement of medical goods & supplies (surgical supplies and instruments, including gloves, masks, syringes, equipment) to name a few.
- Producer Price Inflation - It indicates inflation from viewpoint of the producers viz. the average selling price received for their output over a period of time. Annual change (YoY) of producer price index is reported as wholesale price inflation in the "Inflation" industry trend. As WPI captures dynamic price movements in most comprehensive way, it is widely used by governments, banks, industry, business circles and is deemed important in formulation of trade, fiscal and other economic policies. The data has been used in adjunction to consumer price inflation for better understanding the inflationary environment.
- Road Freight Pricing Trends - Freight pricing by mode of transport (USD/tonkm), over the review period, has been presented in this industry trend. The data has been used in assessing the inflationary environment, impact on trade, freight turnover (tonkm), road freight transport market demand and hence the road freight transport market size.
- Road Freight Tonnage Trends - Freight tonnage (weight of goods in tons) handled by mode of transport, over the review period, has been presented in this industry trend. The data has been used as one of the parameters apart from average distance per shipment (km), freight volume (tonkm), and freight pricing (USD/tonkm) to assess the freight transport market size.
- Road Freight Transport - Hiring a road freight transport logistics service provider (LSP) or haulier (outsourced logistics), for the transport of commodities constitutes road freight transport market. The scope of study includes (i) road transport of goods reported by hauliers registered in the reporting countries (ii) transport of raw materials or manufactured goods (solids as well as fluids) (iii) transport using commerical motor vehicles (rigid trucks or tractor-trailers, (iv) Full-Truck-Load (FTL) or Less than-Truck-Load (LTL) transport (v) containerized or non-containerized transport (vi) temperature controlled or non-temperature controlled trasnport, (vii) short haul or long haul (Over-the-road, OTR) transport, (viii) used office or household goods transport (movers and packers), (ix) other specialized cargo transport (dangerous goods, oversized cargo) and (x) outsourced first mile/ middle mile/last mile delivery shipments undertaken by road freight transport players. The scope does not include (i) transport undertaken by hauliers registered in other countries (ii) last mile meal delivery market (iii) grocery delivery market (iv) transportation via road network undertaken/ reported by Courier, Express, and Parcel (CEP) players.
- Road Length - As infrastructure plays a vital role in an economy's logistics performance, variables like length of roads, distribution of road length by surface category (paved v/s unpaved), distribution of road length by road classification (expressways v/s highways v/s other roads), have been analysed and presented in this industry trend.
- Segmental Revenue - Segmental Revenue has been triangulated or computed and presented for all the major players in the market. It refers to the road freight transport market specific revenue earned by the company, over the base year of study, in the geography studied (country or region as per the scope of report). It is computed through the study and analysis of major parameters like financials, service portfolio, employee strength, fleet size, investments, number of countries present in, major economies of concern, etc. that have been reported by the company in its annual reports, webpage. For companies having scarce financial disclosures, paid databases like D&B Hoovers, Dow Jones Factiva have been resorted to and verified through industry/expert interactions.
- Short Haul Road Freight Transport - The segment captures the external (outsourced) logistics expenditure incurred by the road freight transport service end users on local trucking (less than 100 miles). It includes the road transport of goods (i) within a single administrative area and its hinterland, (ii) by smaller trucks and pickup trucks (iii) via containerized as well as dry bulk services (iv) intermodal from ports, container terminals or airports, and (v) outsourced first mile/ last mile delivery shipments undertaken by road freight transport players.
- Transport and Storage Sector GDP - Value and growth of Transport and Storage Sector GDP has a direct relation to the freight and logistics market size, and hence road freight transport market size. Therefore, this variable has been studied and presented over the review period, in value terms (USD) and as share % of total GDP, in this industry trend. The data has been supported by concise and relevant commentary around the investments, developments, and current market scenario.
- Trends in E-Commerce Industry - Enhanced internet connectivity and boom in smartphone penetration, coupled with increasing disposable incomes, has led to a phenomenal growth in the e-commerce market globally. Online shoppers require fast and efficient delivery of their orders leading to an increase in the demand for logistics services especially e-commerce fulfilment services. Hence, the Gross Merchandise Value (GMV), historial and projected growth, breakup of major commodity groups in e-commerce industry for the studied geography (country or region as per scope of the report) have been analysed and presented in this industry trend.
- Trends in Manufacturing Industry - Manufacturing industry involves the transformation of raw materials into finished products, while logistics industry ensures the efficient flow of raw materials to the factory, and the transport of manufactured products to the distributors & consumers. Demand-Supply of both industries are highly cross-linked and critical for a seamless supply chain. Hence, the Gross Value Added (GVA), breakup of GVA into major manufacturing sectors, and growth of manufacturing industry over the review period have been analysed and presented, in this industry trend.
- Trucking Fleet Size By Type - Market share of truck types is influenced by factors like geographical preferences, major end user industries, truck prices, local production, truck repair & maintenance service peneteration, customer support, technological disruptions (like electric vehicles, digitalization, autonomous trucks) etc. Hence, the distribution (share % for base year of study) of truck parc volume by type of truck, market disruptors, truck manufacturing investments, truck specifications, truck use & import regulations, and market anticipation over the forecast period have been presented in this industry trend.
- Trucking Operational Costs - The prime reasons for measuring/ benchmarking logistics performance of any trucking company are to reduce operational costs and increase profitability. On the other hand, measuring operational costs helps to identify whether and where to make operational changes to control expenses and identify areas for improved performance. Hence, in this industry trend, trucking operational costs and the variables involved viz. driver wages & benefits, fuel prices, repairs & maintenance costs, tyre costs etc. have been studied over the base year of study, and presented for the geography studied (country or region as per the scope of report).
- Wholesale and Retail Trade - This end user industry segment captures the external (outsourced) logistics expenditure incurred by the wholesalers and retailers, on road freight transport service. The end user players considered are the establishments primarily engaged in wholesaling or retailing merchandise, generally without transformation, and rendering services incidental to the sale of merchandise. Logistics Service Providers (LSPs) plays a crucial role in the reliable movement of supplies to and finished products from production houses to the distributors and finally to the end customer covering activites like material sourcing, transportation, order fulfillment, warehousing & storage, demand forecasting, inventory management etc.
| Keyword | Definition |
|---|---|
| Cabotage | Road transport by a motor vehicle registered in a country performed on the national territory of another country. |
| Cross Docking | Cross docking is a logistics procedure where products from a supplier or manufacturing plant are distributed directly to a customer or retail chain with marginal to no handling or storage time. Cross docking takes place in a distribution docking terminal; usually consisting of trucks and dock doors on two (inbound and outbound) sides with minimal storage space. The name ‘cross docking’ explains the process of receiving products through an inbound dock and then transferring them across the dock to the outbound transportation dock. |
| Cross Trade | International road transport between two different countries performed by a road motor vehicle registered in a third country. A third country is a country other than the country of loading/embarkation and than the country of unloading/disembarkation. |
| Dangerous Goods | The classes of dangerous goods carried by Road are those defined by the fifteenth revised edition of the UN Recommendations on the Transport of Dangerous Goods, United Nations, Geneva 2007. They include Class 1: Explosives; Class 2: Gases; Class 3: Flammable Liquids; Class 4: Flammable solids- substances liable to spontaneous combustion; substances which, on contact with water, emit flammable gases; Class 5: Oxidizing substances and organic peroxides; Class 6: Toxic and infectious substances; Class 7: Radioactive material and Class 8: Corrosive substances, Class 9: Miscellaneous dangerous substances and articles. |
| Direct Shipment | Direct shipment is a method of delivering goods from the supplier or the product owner to the customer directly. In most cases, the customer orders the goods from the product owner. This delivery scheme reduces transportation and storage costs, but requires additional planning and administration. |
| Drayage | A drayage is a form of trucking service that connects the different modes of shipping (intermodal), such as ocean freight or air freight. It’s a short-haul trip that transports goods from one place to another, usually before or after its long-haul shipping process. Drayage trucks move cargo to and from various destinations, such as container ships, storage lots, order fulfillment warehouses, and rail yards. Typically, drayage only transports goods in short distances and operates only in one metropolitan area. It also requires only one trucker in a single shift. But despite this, but it plays an important role in long-haul shipping because it gets the goods to the cargo and vice versa. It makes intermodal transport much more efficient and enables the seamless transfer of goods to the end customer. |
| Dry van | A dry van is a type of semi-trailer that's fully enclosed to protect shipments from outside elements. Designed to carry palletized, boxed or loose freight, dry vans aren't temperature-controlled (unlike refrigerated “reefer” units) and can't carry oversized shipments (unlike flatbed trailers). |
| Final Demand | Final demand includes all types of commodities (goods as well as services) consumed as final use and might include personal consumption, or consumption by government, by businesses as capital investment, and as exports. includes all types of commodities (goods as well as services) consumed as final use and might include personal consumption, or consumption by government, by businesses as capital investment, and as exports. |
| Flatbed Truck | A flatbed truck is a type of truck with rigid design. It has a back body that is flatly shaped for easy loading and unloading of goods. The flatbed truck is mostly used to transport heavy, oversized, wide and indelicate goods such as machinery, building supplies or equipment. Due to the truck open body, the goods transported with it must not be vulnerable to rain. By functionality, the flatbed truck is comparable to a flatbed trailer. |
| Inbound Logistics | Inbound logistics is the way materials and other goods are brought into a company. This process includes the steps to order, receive, store, transport and manage incoming supplies. Inbound logistics focuses on the supply part of the supply-demand equation. |
| Intermediate Demand | Intermediate demand includes goods, services, and maintenance and repair construction sold to businesses, excluding capital investment. |
| International Loaded | Place of loading of goods in reporting country (i.e., country in which the vehicle performing the transport is registered) and place of unloading in a different country. |
| International Unloaded | Place of unloading of goods in reporting country (i.e., country in which the vehicle performing the transport is registered) and place of loading in a different country. |
| OOG cargo | Out of Gauge (OOG) cargo is any cargo that can not be loaded into six-sided shipping containers simply because it is too large. The term is a very loose classification of all cargo with dimensions beyond the maximum 40HC container dimensions. That is a length beyond 12.05 meters – a width beyond 2.33 meters – or a height beyond 2.59 meters. |
| Pallets | Raised platform, intended to facilitate the lifting and stacking of goods. |
| Part load | A part load describes goods which only fills a truck partially. In essence, the quantity of the shipment is bigger than the Less Than Truckload (LTL) shipment. Also, the shipment cannot fully occupy a truck i.e. its capacity is much lower than a Full Truckload (FTL) shipment. |
| Paved Road | Road surfaced with crushed stone (macadam) with hydrocarbon binder or bituminized agents, with concrete or with cobblestone. |
| Reverse Logistics | Reverse logistics comprises of the sector of supply chains that process anything returning inwards through the supply chain or traveling ‘backward’ through the supply chain. |
| Road Freight Transport Service | Hiring a trucking agency for transport of commodities (raw materials or manufactured goods including both solids and liquids) form the origin to a destination within the country (domestic) or cross-border (international) constitutes road freight transport market. The service might be Full-Truck-Load or Less than-Truck-Load, containerized or non-containerized, temperature controlled or non temperature controlled, short haul or long haul. |
| Tautliner vehicle | Tautliner and curtainsider are used as generic names for curtain sided trucks/trailers. The curtains are permanently fixed to a runner at the top and detachable rails/poles at front and rear, allowing the curtains to be drawn open and forklifts used all along the sides for easy and efficient loading and unloading. When closed for travel, vertical load restraint straps are attached to a rope rail beneath the truck bed, connecting the truck bed and curtain along both sides. Winches at either end of the curtain tension it, hence the 'Tautliner' name. This stops the curtain from flapping or drumming in the wind and can also help retain light loads from slipping sideways. |
| Transport for hire or reward | The carriage for remuneration of goods. |
| Unpaved Road | Road with a stabilized base not surfaced with crushed stone, hydrocarbon binder or bituminized agents, concrete or cobblestone. |


Research Methodology
Mordor Intelligence follows a four-step methodology in all our reports.
- Step-1: Identify Key Variables: In order to build a robust forecasting methodology, the variables and factors identified in Step-1 are tested against available historical market numbers. Through an iterative process, the variables required for market forecast are set and the model is built on the basis of these variables.
- Step-2: Build a Market Model: Market-size estimations for the forecast years are in nominal terms. Inflation is considered to be a part of the pricing, and the average selling price (ASP) is varying throughout the forecast period for each country
- Step-3: Validate and Finalize: In this important step, all market numbers, variables and analyst calls are validated through an extensive network of primary research experts from the market studied. The respondents are selected across levels and functions to generate a holistic picture of the market studied.
- Step-4: Research Outputs: Syndicated Reports, Custom Consulting Assignments, Databases & Subscription Platforms


