
Market Overview
| Study Period | 2020 - 2031 |
|---|---|
| Forecast Data Period | 2026 - 2031 |
| Base Year Market Size (2025) | USD 17.10 Billion |
| Market Size (2026) | USD 17.96 Billion |
| Market Size (2031) | USD 22.98 Billion |
| Growth Rate (2026 - 2031) | 5.05 % |
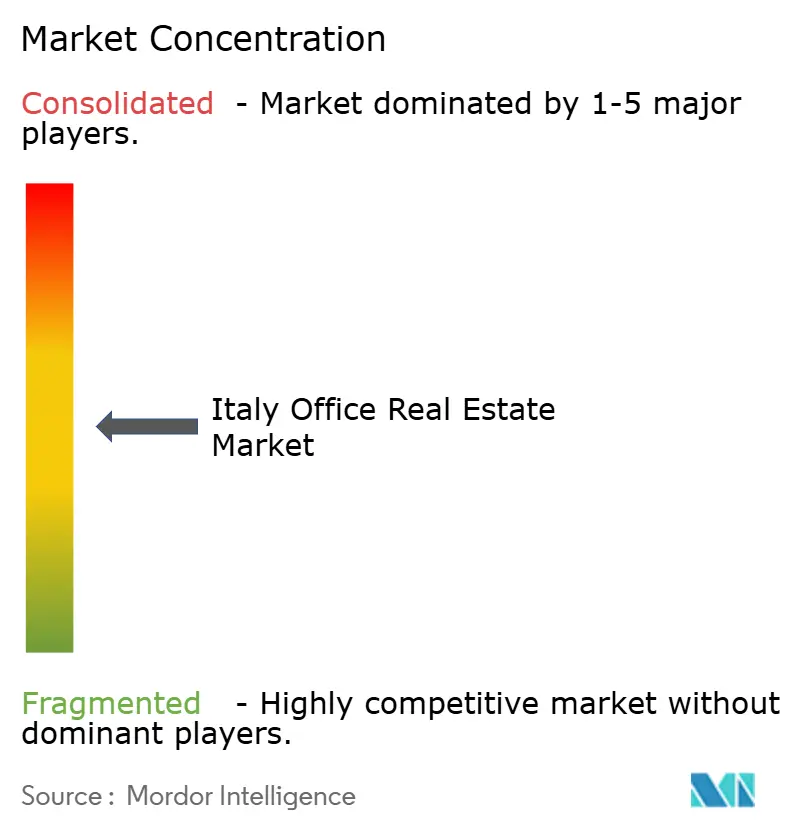
| Market Concentration | Medium |
Major Players *Disclaimer: Major Players sorted in no particular order Image © Mordor Intelligence. Reuse requires attribution under CC BY 4.0. | |
Italy Office Real Estate Market Analysis by Mordor Intelligence
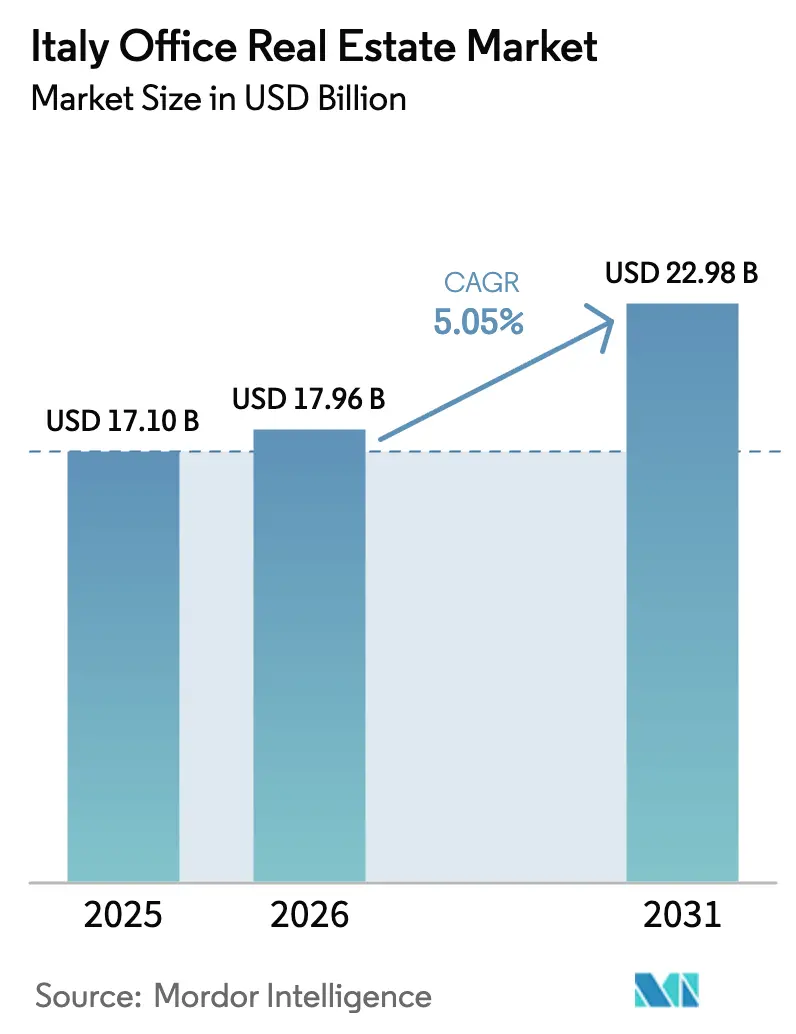
The Italy office real estate market size is expected to grow from USD 17.10 billion in 2025 to USD 17.96 billion in 2026 and is forecast to reach USD 22.98 billion by 2031 at 5.05% CAGR over 2026-2031. Urban migration, a steady stream of foreign capital and rising demand for ESG-qualified space all underpin this expansion. Segment data show a clear flight to quality: Grade A assets hold the largest share at 45% and are also the fastest mover, advancing at a 5.81% CAGR. Rentals still dominate at 74%, yet investment sales are accelerating with a 6.10% CAGR. On the occupier side, BFSI tenants account for 35% of demand, while IT & ITES is growing quickest at 6.43%. Milan remains the country’s commercial anchor with a 43% share, but Rome is set to outpace it, logging a projected 6.21% CAGR. Rome’s edge lies in lower occupational costs and the connectivity upgrades that form part of the National Recovery and Resilience Plan (NRRP). The European Central Bank (ECB) notes that Italian lenders hold sizeable office exposure; enhanced regulatory oversight is keeping loan-loss provisions on a tight leash. The Bank of Italy adds that construction activity tied to the NRRP is offsetting softness in residential building and is helping sustain the office pipeline.
Key Report Takeaways
- By building grade, Grade A captured 44.30% of Italy office real estate market share in 2025; the same segment is projected to expand at a 5.62% CAGR through 2031.
- By transaction type, rentals led with 73.45% of revenue in 2025, while sales are forecast to post the fastest 5.93% CAGR between 2026-2031.
- By end use, BFSI accounted for 34.55% of the Italy office real estate market size in 2025, whereas IT & ITES is expected to grow at a 6.22% CAGR through 2031.
- By city, Milan held 42.60% of national revenue in 2025, but Rome is on track for the strongest 6.05% CAGR to 2031.
Note: Market size and forecast figures in this report are generated using Mordor Intelligence’s proprietary estimation framework, updated with the latest available data and insights as of 2026.
Italy Office Real Estate Market Trends and Insights
Drivers Impact Analysis*
| Driver | (~) % Impact on CAGR Forecast | Geographic Relevance | Impact Timeline |
|---|---|---|---|
| Urbanisation & Transit-Oriented Development | +1.2% | Milan, Rome, Turin metropolitan areas | Medium term (2-4 years) |
| ESG & Green Building Compliance | +1.1% | Nationwide, early uptake in Milan & Rome | Long term (≥ 4 years) |
| Foreign Institutional Capital Inflow | +0.9% | Milan CBD, Rome EUR district | Short term (≤ 2 years) |
| Coworking & Flex Office Expansion | +0.7% | Milan, Rome city centres | Medium term (2-4 years) |
| Shift to Hybrid Work Models | +0.6% | Milan, Rome, Turin | Short term (≤ 2 years) |
| Source: Mordor Intelligence | |||
Urbanisation & Transit-Oriented Development
Government spending is tilting decisively toward transport. Of the USD 15.0 billion raised by 2023 BTP Green bonds, 41.5% went to rail and metro projects[1]Maria Teresa Cannata, “BTP Green Allocation Report 2023,” Ministero dell’Economia e delle Finanze, mef.gov.it. Politecnico di Torino finds that mixed-use nodes such as Naples’ Municipio outperform single-use clusters on transit uptake. NRRP upgrades are also smoothing city-to-city links; the Bank of Italy reports that these works are shoring up construction even as the wider economy cools
Foreign Institutional Capital Inflow
The euro area posted a USD 464.3 billion current-account surplus in 2024, providing deep capital pools for real-asset allocations. ECB research shows rapid growth in pan-European real-estate funds, many targeting Italian offices. In Piemonte alone, 27 FDI projects announced in 2024 carry a USD 4.36 billion price tag, 18% of which is real estate. Borrowing costs are also supportive: the average rate on new corporate loans slipped to 3.79% in April 2025
Coworking & Flex Office Expansion
ECB outreach to non-financial firms highlights a sharper focus on variable costs, prompting wider adoption of subscription-based space. Although the Bank of Italy notes subdued capex on plant and equipment, service-sector resilience is pushing demand for turnkey offices. Across EMEA, flex inventory grew by 161,303 m² in 2023, and Milan operators report strong pre-leasing from names such as Microsoft and HSBC.
ESG & Green Building Compliance
The Energy Performance of Buildings Directive requires a 16% energy-use cut by 2030 and zero-emission standards for new private buildings from January 2030. ECB modelling suggests the EU must invest USD 677.8 billion a year through 2030 to stay on track. Italy is leaning on BTP Green proceeds and tax credits (now a 5% deduction, rising to 7.5% in 2025) to help owners fund upgrades. Early adopters already see the benefit: Generali’s green offices command 5%-7% rent premiums, and Stoneweg has 85% of its Italian assets pre-labelled “green” with an 83 GRESB score.
Restraints Impact Analysis*
| Restraint | (~) % Impact on CAGR Forecast | Geographic Relevance | Impact Timeline |
|---|---|---|---|
| Aging Office Stock and Retrofit Costs | −0.8% | Milan periphery, Rome secondary districts | Long term (≥ 4 years) |
| Rising Construction and Fit-Out Costs | −0.6% | National, with acute pressure in Milan & Rome | Medium term (2-4 years) |
| Low Availability of Suitable Redevelopment Land | −0.4% | Core CBD plots in Milan, Rome and other tier-1 submarkets | Long term (≥ 4 years) |
| Source: Mordor Intelligence | |||
Aging Office Stock and Retrofit Costs
Italy’s office landscape is grappling with the legacy of outdated infrastructure. Over 65% of the country’s commercial buildings were constructed before 1980, yet the annual renovation rate remains just 0.81%, falling far short of EU climate targets.[2]Roberto Cingolani, “National Climate & Energy Plan Update,” Ministry for Ecological Transition, mase.gov.it Although refurbishments can lift asset value by approximately 13.5%, many owners—especially in fringe submarkets—struggle to fund deep retrofits, as prevailing rents often fail to justify the return on cost. This mismatch fuels rising vacancy risk for obsolete stock, pushing tenants to prioritise Grade A space. As a result, Italy’s office market continues to experience a structural split, where the flight-to-quality trend accelerates, but net absorption in older districts remains constrained.
Rising Construction and Fit-Out Costs
Cost pressures are reshaping Italy’s office development pipeline. In 2022, total construction spending hit USD 177.56 billion, but inflation in materials and labour sharply compressed developer margins, extending into the realm of premium office fit-outs[3]Emily Sanchez, “Italy – Construction Market Overview 2024,” U.S. Department of Commerce, trade.gov. The Superbonus 110% tax incentive, though aimed at stimulating renovations, tightened contractor availability and exacerbated price escalations, causing project delays and downsizing across multiple office pipelines. In this environment, developers have become cautious with speculative starts, leading to prolonged supply gaps in high-demand urban zones. Until costs stabilise, this situation is likely to restrict future take-up and delay much-needed inventory in core office corridors.
*Our forecasts treat driver/restraint impacts as directional, not additive. The impact forecasts reflect baseline growth, mix effects, and variable interactions.
Segment Analysis
By Building Grade: Premium Quality Commands Market Leadership
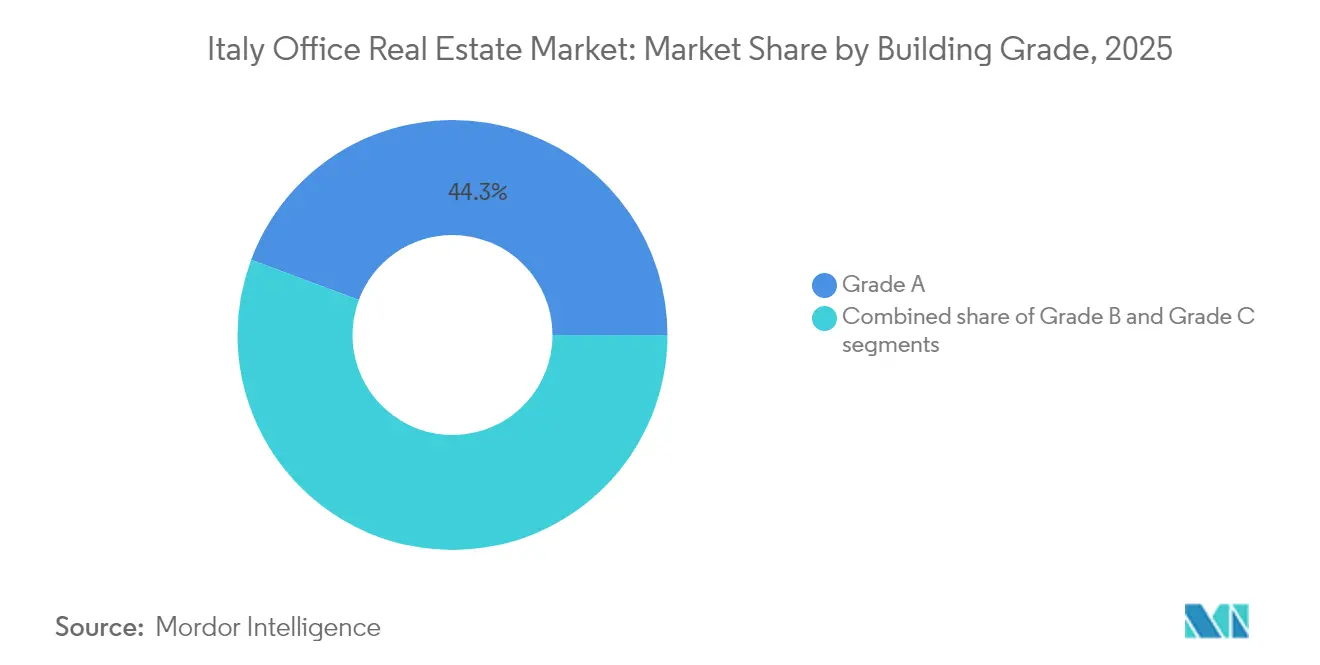
Grade A stock commands 44.30% of the market in 2025 and is projected to grow at a 5.62% CAGR through 2031. ECB valuation guidance underlines lenders’ preference for energy-efficient assets. Semi-annual data from Agenzia delle Entrate confirm that top locations fetch a 20% premium over suburban equivalents. With only 515,000 m² of Grade A space due by 2027, rents appear set for further upside.
Flight-to-quality also manifests beyond Milan. In Rome, prime EUR district schemes obtain USD 654 per m² rents and capture greater international occupier interest on the back of new metro extensions. Meanwhile, Grade B stock remains the cost-efficient alternative, particularly for companies pivoting to suburban hubs amid hybrid work. Yet retrofitting costs and looming EU efficiency rules weigh on Grade C assets, accelerating disposals, conversions, or demolitions. Overall, the Grade A segment is set to post the fastest 5.62% CAGR through 2031, ensuring it continues to anchor future demand and pricing trends across the Italy office real estate market.



By Transaction Type: Rental Dominance with Sales Acceleration
Rental agreements accounted for 73.45% of total activity in 2025, reflecting Italy’s custom of long-term leasing and flexible renewal clauses, but sales are catching up, forecasting a 5.93% CAGR. The ECB’s lending survey shows only a small tightening in corporate credit, while looser housing standards free up bank balance sheets for commercial deals. Corporate sale-and-leasebacks are gaining traction as firms unlock capital without surrendering operational control.
Domestic investors dominated 77% of Q1 2025 sales volume, underscoring local conviction in core assets, but cross-border parties remain active at the upper end of the market. Corporates are turning to sale-and-leaseback structures to free cash for core operations, especially in capital-intensive sectors such as manufacturing and utilities. For landlords, these hybrid models lock in long leases from credit-strong tenants, improving financing terms and portfolio valuations. Such dynamics support a gradual convergence between leasing and owning behaviour in the Italy office real estate market, even as rentals remain the principal mode.
By End Use: BFSI (Banking, Financial Services and Insurance) Leadership with Technology Sector Momentum
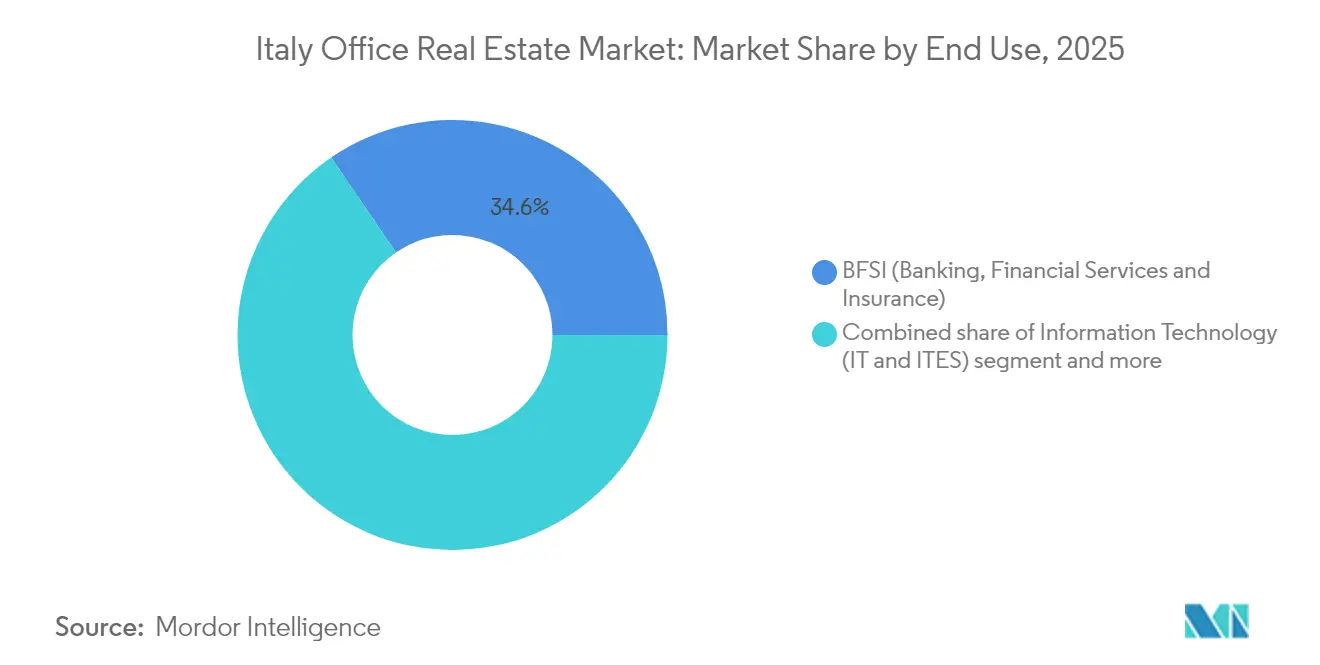
BFSI (Banking, Financial Services and Insurance) occupiers commanded 34.55% of Italy office real estate market size in 2025, anchored by Milan’s Porta Nuova and Rome’s banking quarters. Although branch optimisation is trimming space needs, headquarters demand stays resilient, often requiring advanced security and ESG features. The IT & ITES cohort is accelerating fastest at a 6.22% CAGR, fed by digital-transformation budgets and the draw of Italy’s large domestic consumer base. These firms frequently adopt agile workplace layouts and shorter lease horizons, fuelling the rise of managed-flex platforms.
Professional services firms, notably auditors and legal advisors, maintain steady absorption, driven by rising regulatory complexity around sustainability and data privacy. Life sciences, energy, and creative industries round out demand but increasingly stipulate net-zero pathways when negotiating new tenancies. Collectively, this end-user mosaic fosters nuanced demand profiles that landlords must accommodate to maximise occupancy and yield within the Italy office real estate market.
Geography Analysis
Italy’s office landscape pivots on two hubs: Milan retains a 42.60% grip thanks to its deep financial ecosystem, premier universities, and four-line metro grid that underpins commuter flows. Scarce Grade A supply and consistent cross-border capital inflows keep yields firm and rents at historic peaks, though development land in prime zones is nearly exhausted. Rome trails in share yet outpaces in growth, fuelled by a 6.05% CAGR outlook as metro extensions and rail upgrades lift the appeal of once-peripheral EUR and Tiburtina districts to multinationals seeking cost savings without compromising connectivity.
Regional diversification is gaining momentum. The Piemonte region’s 2024 haul of 27 foreign direct investment projects, worth USD 4.36 billion, underscores the draw of cost-advantaged northern cities such as Turin and Novara where office conversions can ride on established manufacturing clusters. Further south, Bologna and Florence benefit from large university populations that feed tenant pipelines in research, IT, and life science spin-offs; government grants for digitalisation are particularly appealing to these knowledge hubs. Naples and Bari illustrate a different narrative, leveraging expanded high-speed rail and port capacities to attract back-office shared-service centres seeking affordable labour but international reach. Transit-oriented investment via the NRRP is knitting these nodes into a more integrated network, letting occupiers deploy hub-and-spoke strategies that reduce occupancy cost per employee while preserving access to Italy’s flagship cities. As the Italy office real estate market matures, such multi-city location strategies help mitigate risk, ease recruitment, and meet employee preference for shorter commutes and affordable housing.
Regulatory Landscape
Italy's office real estate regulatory framework is anchored in national building and planning rules under the Consolidated Building Code (D.P.R. 380/2001), administered through municipal permitting (permesso di costruire), with the Ministry of Infrastructure and Transport (MIT) shaping national policy on housing, urban regeneration, and infrastructure. Permit certainty and legal-risk windows have been tightened through the Simplification Act (Law No. 182 of 2 December 2025), which reduced the time limit for ex officio annulment of unlawful administrative acts from 12 to 6 months.
Sustainability-related compliance is both a market constraint and an upgrade driver. Minimum energy performance and APE certification requirements under Legislative Decree 192/2005 sit alongside EU-derived tightening on building energy performance, with fiscal levers referenced in the market context (a 5% deduction, rising to 7.5% in 2025) that support retrofit economics. Alongside these adjustments, the policy agenda broadened in 2026 with Decree-Law No. 66 of 7 May 2026 (Piano Casa), which streamlines urban regeneration and public asset use, and with Draft law AS 1894 presented on 3 June 2026 proposing reform of the real estate brokerage profession (Law 39/1989), including continuous training and updated rules aimed at raising transparency expectations for intermediaries in leasing and investment transactions.
Value Chain Analysis
Italy's office real estate value chain runs from land and asset sourcing, often tied to urban-regeneration and brownfield opportunities, to planning and permitting under municipal authorities (permesso di costruire pursuant to D.P.R. 380/2001). It then moves through design and engineering, contracting and fit-out, and ends with commercialization via leasing and sales. The downstream operating layer includes asset and property management, facilities management, and tenant services, supported by specialist providers for valuation, legal due diligence, tax structuring, and ESG and energy performance assessments, including APE certification under Legislative Decree 192/2005.
Capital and intermediation form the other backbone of the chain. Institutional investors and managed vehicles (funds and other structures) provide acquisition and development capital, while international advisors such as CBRE, JLL, Cushman & Wakefield, Savills, and Colliers broker leasing and capital-markets execution, particularly for large-ticket Grade A assets in Milan and Rome. Industry representation and consultation are channeled through Confindustria Assoimmobiliare, and the intermediation layer is being pushed toward higher qualification standards through the proposed AS 1894 reform of the brokerage profession. If enacted, it would increase compliance obligations for brokers and property managers and could influence transaction workflows and documentation standards.
Competitive Landscape
The Italy office real estate market displays moderate concentration. International advisory firms CBRE, Jones Lang LaSalle IP, and Cushman & Wakefield continue to intermediate the lion’s share of large-ticket leasing and investment deals thanks to pan-European client relationships and end-to-end data platforms. Their service breadth—ranging from capital markets to ESG consultancy—creates stickiness with multinationals that prefer one-stop solutions. Domestic stalwarts such as Gabetti Property Solutions wield strong local knowledge, municipal contacts, and asset-management capabilities that help them compete effectively for mid-sized disposals and occupier mandates.
REITs and long-hold institutional investors remain essential demand drivers: Covivio lifted occupancy to 95.5% on its USD 16.79 billion Italy-focused portfolio by concentrating on city-centre properties with high sustainability ratings. COIMA RES and Generali Real Estate are likewise doubling down on value-add refurbishments that align with EU climate rules, a strategy rewarded by rental outperformance and lower obsolescence risk. Foreign capital—ranging from Korean pension funds to Canadian REITs—targets stand-alone trophy assets or joint ventures that accelerate ESG upgrades, injecting fresh competition for limited core product.
PropTech adoption is where the next wave of differentiation is forming. Leading managers deploy occupancy analytics, touchless access, and carbon-tracking dashboards that boost tenant satisfaction and command premium rents. Local specialists with deep micro-market intelligence often partner with these technology providers to integrate smart-building solutions quickly. The result is a multilayered playing field in which scale, sustainability credentials, and digital capability jointly determine competitive edge within the Italy office real estate market.
Italy Office Real Estate Industry Leaders
CBRE
Jones Lang LaSalle IP
Cushman & Wakefield
Savills
Colliers
- *Disclaimer: Major Players sorted in no particular order

Market Opportunities and Future Outlook
The clearest opportunity sits where capital is returning to offices and where structural flight-to-quality is being reinforced by energy-performance rules and obsolescence risk in older stock. Market activity reflects this. Colliers reported Q1 2026 office investments of about EUR 410 million, with Rome and Milan as the primary targets, and broader commercial real estate investment in Italy increased in H1 2026 versus H1 2025. With only 515,000 sq m of Grade A space due by 2027 (per report context), owners and developers that can deliver certified, energy-efficient refurbishments or repositioned Grade A assets in core submarkets are positioned to capture demand from BFSI and faster-growing IT and ITES occupiers seeking turnkey, ESG-qualified space.
A second opportunity is embedded in policy-led urban regeneration and conversion pipelines. Decree-Law No. 66 of 7 May 2026 (Piano Casa) supports urban regeneration and the use of underutilized public assets through public-private partnership mechanisms, expanding the addressable set of redevelopment sites and encouraging mixed-use outcomes that can incorporate office. At the same time, market evidence points to conversion capital as an active theme, with JLL noting that a material share of office investment volume is directed to conversions, reinforcing strategies that upgrade or repurpose secondary stock in Milan, Rome, and other cities connected by NRRP infrastructure upgrades. On the services side, proposed reforms to the brokerage profession (AS 1894, presented 3 June 2026) elevate professional standards and can accelerate adoption of more transparent, data-driven agency and property management models, aligning with occupier demand for measurable ESG and operational performance.
Recent Industry Developments
- July 2026: BNP Paribas acquired a 51% stake in the Torre Diamante property fund (Porta Nuova Diamond Fund) including its Milan headquarters, valuation over €400 million. The investment strengthens Milan core asset supply and ESG-aligned portfolio and accelerates co-investment models with Coima SGR.
- June 2026: UniCredit/Pimco Prime Real Estate club deal to acquire majority stake in Palazzo Esedra, Rome (over €200 million). The acquisition strengthens Rome's office market momentum and demonstrates value-add consortium investments in prime assets.
- April 2026: Cushman Wakefield/JLL sell-side advisory for sale of RAI headquarters at Via Alessandro Severo 246, Rome to CORUM Origin SCPI (France). Signals continued appetite for prime assets and cross-border capital deployment into Italy's office market.


Research Methodology Framework and Report Scope
Market Definition and Coverage
For this methodology, the market captures the annual value linked to office real estate activity in Italy, centered on leasing and sales across key office locations and asset quality levels, and expressed in current USD for consistent comparison.
Scope exclusions: We exclude non-office property types (such as retail, industrial, logistics, and residential) and do not treat broader corporate services as part of office real estate value.
Segmentation Overview
- By Building Grade
- Grade A
- Grade B
- Grade C
- By Transaction Type
- Rental
- Sales
- By End Use
- Information Technology (IT and ITES)
- BFSI (Banking, Financial Services and Insurance)
- Business Consulting & Professional Services
- Other Services (Retail, Lifesciences, Energy, Legal Services)
- By City
- Milan
- Rome
- Turin
- Rest of Italy
Data Sources, Market Sizing, and Validation
Desk Research
Desk research was used to set the ground rules for the model, especially on how office stock, demand, and pricing are typically reported in Italy. We reviewed public statistical releases and market indicators that help explain occupier activity and capital flows, followed by cross-checks against widely cited national and city-level dashboards.
Sources included official statistics and datasets such as ISTAT publications, Eurostat series, Bank of Italy releases, and the Italian Revenue Agency (Agenzia delle Entrate) market notes, along with city planning and building energy performance guidance where available. To connect those signals to investable office markets, we also used company filings, investor presentations, and reputable press coverage, and we selectively referenced paid subscriptions for company financials, news and financials, patent databases, and an import-export shipment-level database when a supporting input was needed. This list is not exhaustive, and many other sources were reviewed for data collection, validation, and clarifying unclear points.
Primary Interviews and Surveys
Primary work was used to pressure-test demand and pricing logic that cannot be fully concluded from public series alone, particularly across Milan, Rome, and other active office hubs. We spoke with a mix of landlords, brokers, developers, occupiers, and local advisors, and we used surveys to confirm typical deal sizes, leasing terms, and how refurbishment and sustainability upgrades are changing achievable rent and absorption. When the answers did not line up, we followed up to re-check assumptions so the final model stayed realistic for Italy.
Distribution of primary research fieldwork respondents
| Company type | Respondent position |
|---|---|
| Top tier: 33% | CXOs: 13% |
| Mid tier: 47% | Functional/Unit leaders: 40% |
| Smaller Players: 20% | Managers: 47% |
Market-Sizing & Forecasting
Sizing starts with a top-down rebuild of the Italy office value pool using city level office stock and activity signals, which are then translated into value using observed rent and yield ranges and typical transaction timing. To keep the estimate grounded, results are then checked with selective bottom-up approximations such as sampled rent times leased area for prime and non-prime submarkets, plus channel checks on large deals that can shift annual totals.
Key inputs used in the model include net absorption and take-up trends, vacancy movement by prime clusters, prime and average rent levels, cap rate and yield direction, and the pipeline of refurbishments and conversions that change usable office supply. For forecasting, we relied on scenario analysis supported by simple trend smoothing on the stable variables, and then stress-tested the output against expected shifts in hybrid work adoption, financing conditions, and ESG driven repositioning of older stock. When a bottom-up check could not cover a smaller city consistently, we used calibrated ratios linked to observed activity in comparable locations, and we documented the gap so it could be revalidated during updates.
Data Validation & Update Cycle
Validation is done through several passes so the numbers do not rely on one data stream or one interview set. We compare model outputs against independent market signals such as investment volumes, published rent ranges, and vacancy direction, and then we re-check any large variance that shows up at city level or by transaction type.
Before sign-off, assumptions are reviewed by another analyst and any outliers are traced back to the input that caused them, followed by a quick re-contact with sources if the explanation is not clear. Reports are refreshed annually, with interim updates when material events affect leasing or investment behavior, and a final pre-delivery pass is completed so clients receive the most current view.
Mordor Intelligence's Italy Office Real Estate Market Size Versus Other Published Estimates
Published market numbers for Italy office real estate can look far apart because the underlying counting rules are not always the same, and the year label can hide a different base period or currency timing. In our review, the largest differences usually come from what gets counted as office value and how leasing versus sales activity is treated.
Investment volume snapshots, city level take-up, and prime rent and yield benchmarks are the checks that keep Mordor Intelligence tied to an office-only demand pool, instead of blending in broader commercial real estate turnover or mixed-use conversions. Gaps also come from whether studies value the standing office stock versus the annual transaction activity, how they smooth rent growth in volatile years, and whether FX is converted using annual averages or a point-in-time rate.
Benchmark comparison
| Source | Market Size | Gaps in Research Methodology |
|---|---|---|
| Mordor Intelligence | USD 17.10 B (2025) | |
| Global Consultancy A | USD 18.86 B (2026) | Uses a different base year and longer forecast window, and it appears to lean more on a premium Grade A narrative, which can lift the implied value when city mix and non-prime stock are not equally weighted. |
| Industry Portal B | USD 17.10 B (2026) | Repeats a similar value but assigns it to a later year, which can happen when figures are copied forward without reworking rent, yield, and absorption inputs for the stated base period. |
Across the three figures, the spread is mainly explained by year alignment and what is implicitly emphasized in the stock and pricing mix, rather than a single demand driver. By keeping the value logic traceable to take-up, vacancy, rents, and yields, and then re-checking those against deal flow signals, our estimate stays repeatable and easier to audit when assumptions change.


Key Questions Answered in the Report
What is the current value of the Italy office real estate market?
It stands at USD 17.96 billion in 2026 and is projected to reach USD 22.98 billion by 2031.
Which city holds the largest share of Italy’s office market?
Milan leads with 42.60% market share in 2025, underpinned by its financial sector concentration and limited Grade A supply.
Why is Rome expected to grow faster than Milan?
Ongoing NRRP infrastructure upgrades and lower occupancy costs are forecast to drive a 6.05% CAGR for Rome through 2031.
What segment is expanding the quickest by end-user category?
The IT & ITES segment is predicted to grow at a 6.22% CAGR, fuelled by digital-transformation investments.
How important is ESG compliance for Italian office assets?
Highly important: 32% of older stock risks obsolescence by 2030, and certified green buildings command rent premiums of 5%-7%.
Are flexible offices gaining ground in Italy?
Yes, EMEA flex inventory grew by over 161,000 m² in 2023, and corporate tenants increasingly secure flexible space in Milan and Rome.
Page last updated on:


 Your data is secure and never sold or shared.


