
Technology, Media and Telecom
5th MayPricing Strategy for Semiconductor Components
3 Min Read
The Israel Data Center Rack Market is Segmented by Rack Size (Quartely Rack, Half Rack, and Full Rack), Rack Height (42U, 45U and More), Rack Type (Cabinet (Closed) Racks, Open-Frame Racks, and Wall-Mount Racks), Data Center Type (Colocation Facilities, Hyperscale and Cloud Service Provider DCs, Enterprise and Edge), Material (Steel, Aluminum, Other Alloys and Composites). The Market Forecasts are Provided in Terms of Value (USD).
Market Overview
| Study Period | 2020 - 2031 |
|---|---|
| Base Year For Estimation | 2025 |
| Forecast Data Period | 2026 - 2031 |
| Market Size (2026) | USD 0.41 Million |
| Market Size (2031) | USD 0.64 Million |
| Growth Rate (2026 - 2031) | 9.49 % CAGR |
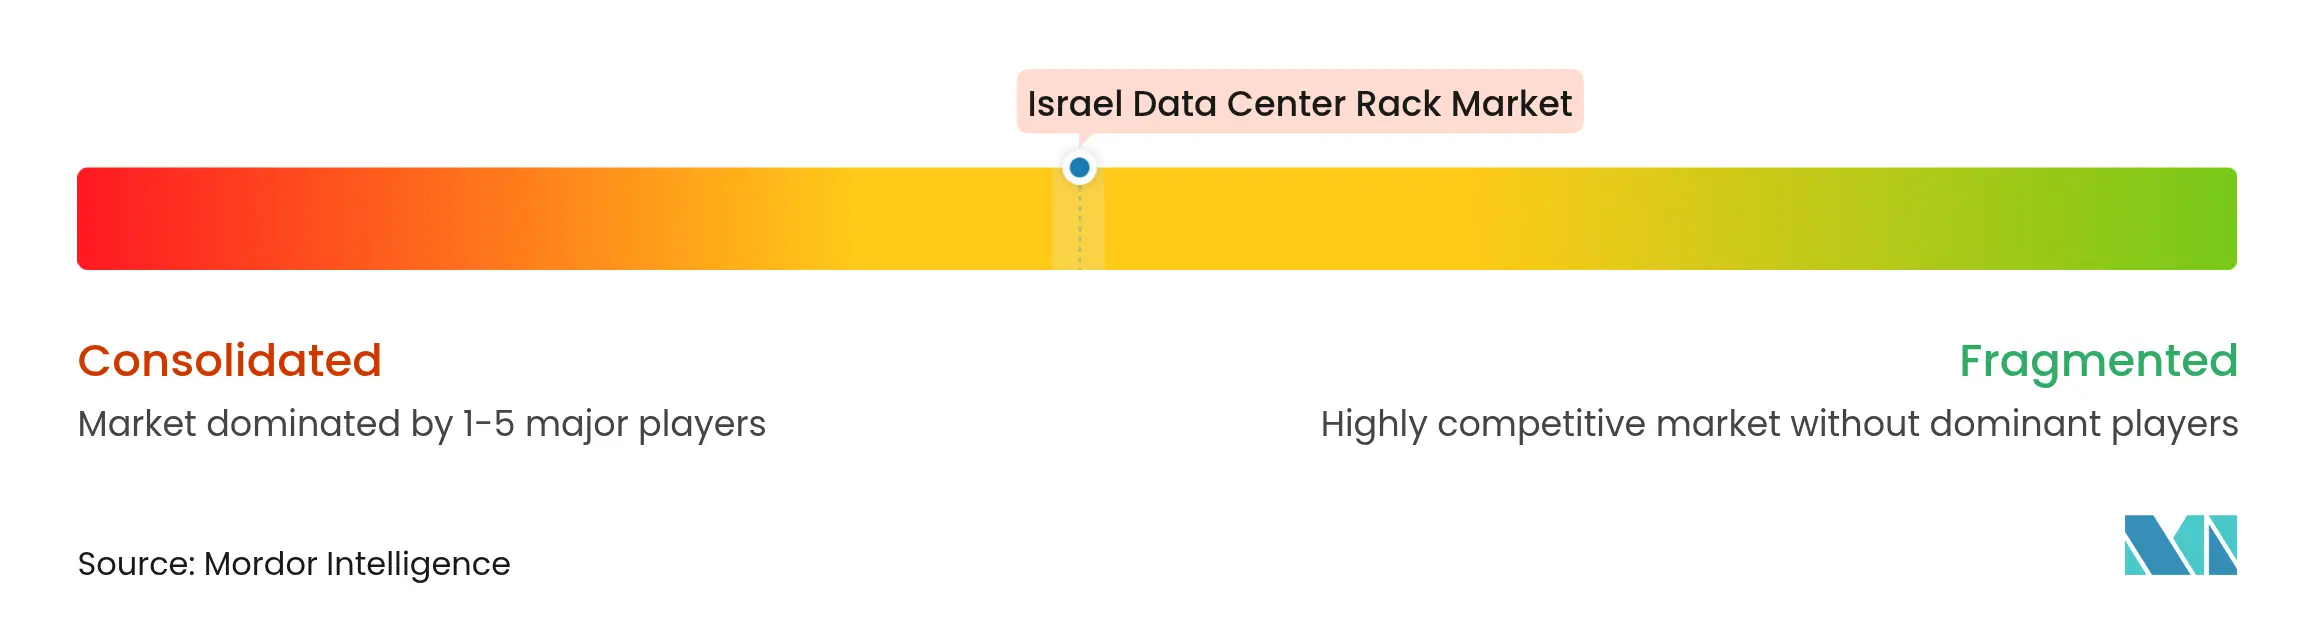
| Market Concentration | Medium |
Major Players *Disclaimer: Major Players sorted in no particular order. Image © Mordor Intelligence. Reuse requires attribution under CC BY 4.0. |
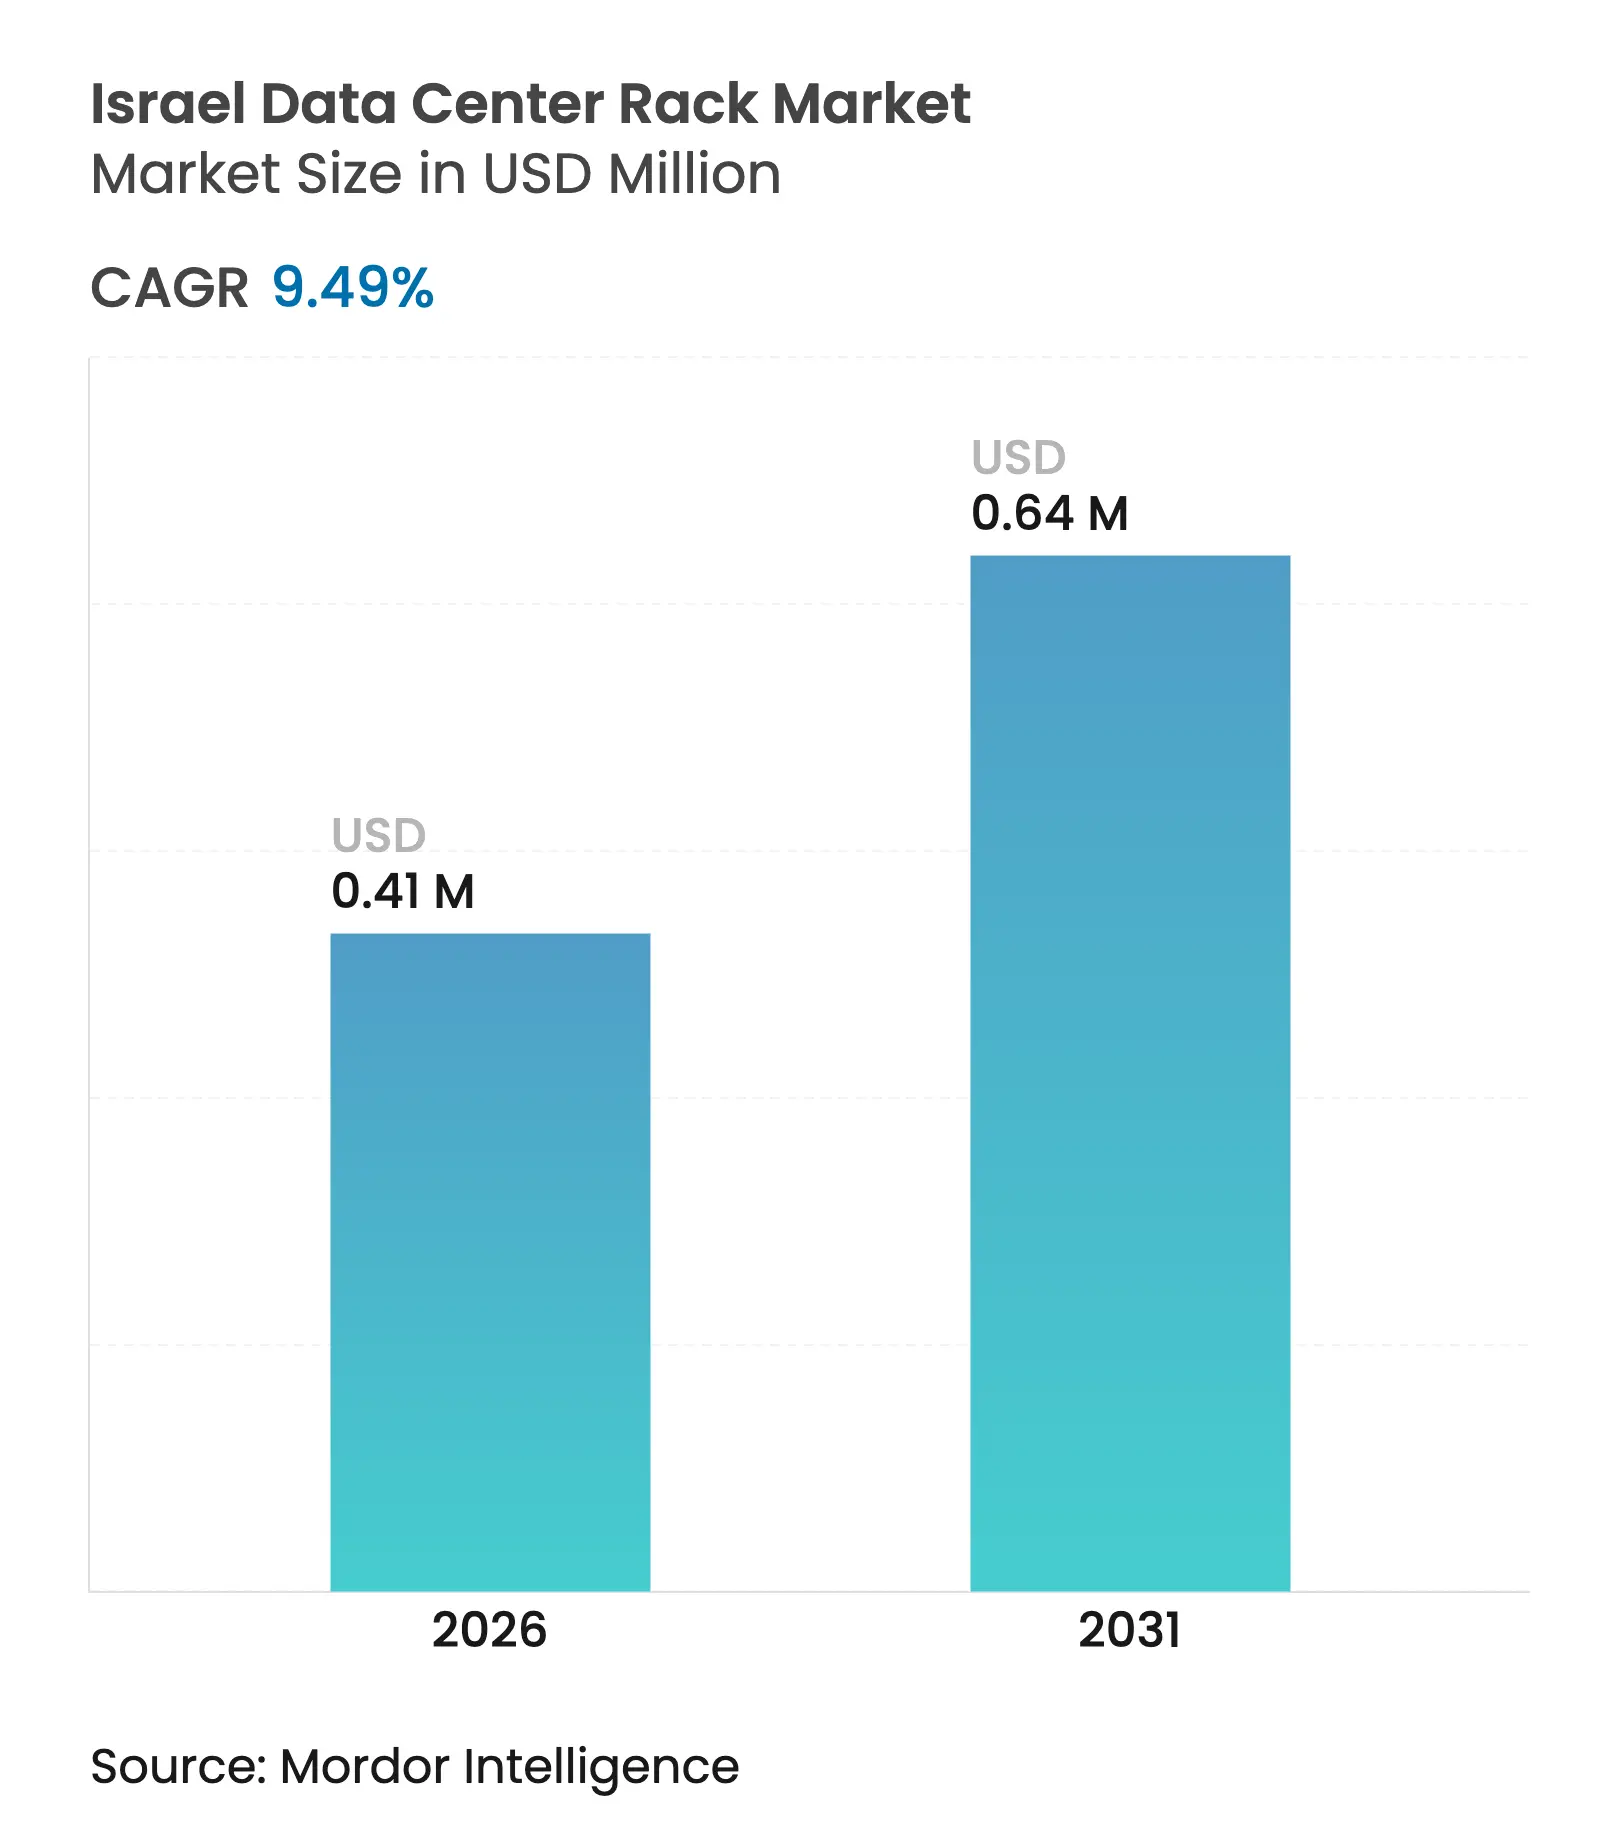
The Israel data center rack market size is expected to grow from USD 0.37 million in 2025 to USD 0.41 million in 2026 and is forecast to reach USD 0.64 million by 2031 at 9.49% CAGR over 2026-2031. Expanding hyperscale footprints, fast-growing AI workloads and new submarine cable routes consolidate Israel’s position as a regional interconnection hub. Venture capital inflows into AI/ML start-ups, sovereign cloud mandates, and underground facility construction underpin resilient rack demand, while seismic design codes and power-efficiency targets steer material and configuration choices. Vendors that can deliver liquid-cool-ready, high-density enclosures with verified seismic ratings command a clear competitive edge.
Key Report Takeaways
Note: Market size and forecast figures in this report are generated using Mordor Intelligence's proprietary estimation framework, updated with the latest available data and insights as of 2026.
Drivers Impact Analysis
| Driver | (~) % Impact on CAGR Forecast | Geographic Relevance | Impact Timeline | |||
|---|---|---|---|---|---|---|
Growing deployment of hyperscale and colocation
facilities Growing deployment of hyperscale and colocation
facilities | +2.1% | National, Tel Aviv metro and Negev | Medium term (2-4 years) | (~) % Impact on CAGR Forecast:
+2.1%
|
Geographic Relevance
:
National, Tel Aviv metro and Negev
|
Impact Timeline
:
Medium term (2-4 years)
|
Cloud-first public-sector digitalization programs
Cloud-first public-sector digitalization programs
| +1.8% | Government and defense nationwide | Long term (≥ 4 years) | |||
Strong venture funding for Israeli AI/ML start-ups
Strong venture funding for Israeli AI/ML start-ups
| +1.7% | Tel Aviv–Jerusalem corridor, Haifa | Short term (≤ 2 years) | |||
Rising rack power densities (>20 kW) in military
R&D labs
Rising rack power densities (>20 kW) in military
R&D labs
| +1.4% | Defense sites, central Israel | Medium term (2-4 years) | |||
Edge-data-center roll-outs along 5G corridors
Edge-data-center roll-outs along 5G corridors
| +1.2% | Urban and transit nodes | Medium term (2-4 years) | |||
Surging European low-latency demand via new subsea cables
Surging European low-latency demand via new subsea cables
| +1.0% | Coastal landing stations | Long term (≥ 4 years) | |||
| Source: Mordor Intelligence | ||||||
Growing deployment of hyperscale and colocation facilities
Cloud majors are scaling aggressively as Oracle is erecting a nine-floor subterranean site designed for 500–1,000 racks per phase. Microsoft’s Azure region and AWS’s upcoming zone follow a similar trajectory, each triggering bulk orders for standardized enclosures that meet stringent seismic and security requirements. Local operator MedOne invested USD 270 million in two new underground halls, specifying seismic-rated cabinets for loads exceeding 20 kW. Large, repetitive purchase cycles foster predictable volume for suppliers who can certify racks for liquid cooling and blast resilience.
Cloud-first public-sector digitalization programs
Project Nimbus compels hyperscalers to host sensitive workloads on Israeli soil, driving sustained procurement of secure, cabinet-grade racks with electromagnetic shielding. The Ministry of Defense’s quantum-research agenda dictates bespoke enclosures that manage vibration and RF interference.[1]Ministry of Defense,"Unit for Research & Technological Infrastructure,"mod.gov Quantum Machines’ three-system quantum hub uses custom frames integrating cryogenic lines while meeting classified-site access controls.
Strong venture funding for Israeli AI/ML start-ups
Cyera’s USD 540 million Series E and Speedata’s USD 44 million Series B illustrate the capital depth permitting start-ups to reserve multi-rack footprints early in their scale-up journey. Rapid headcount and model-training growth mean these firms often double rack counts within 12 months, favoring modular cabinet designs that accept incremental power-bus kits.
Surging European low-latency demand via new subsea cables
The Blue-Raman route reduces Asia-to-Europe latency and channels new traffic through Israeli landing points.[2]Submarine Networks, “Blue-Raman Cable System Overview,” submarinenetworks.com Operators amplify coastal footprints and pre-order corrosion-resistant aluminum racks to shorten build cycles.
Restraints Impact Analysis
| Restraint | (~)% Impact on CAGR Forecast | Geographic Relevance | Impact Timeline | |||
|---|---|---|---|---|---|---|
Rapid shift toward high-density blade and converged
systems Rapid shift toward high-density blade and converged
systems | -1.9% | Tech centers, Tel Aviv and Haifa | Short term (≤ 2 years) | (~)% Impact on CAGR Forecast:
-1.9%
|
Geographic Relevance
:Tech centers, Tel Aviv and Haifa |
Impact Timeline
:
Short term (≤ 2 years)
|
Limited availability of land and power around Tel Aviv
metro Limited availability of land and power around Tel Aviv
metro | -1.6% | Greater Tel Aviv | Long term (≥ 4 years) | |||
Stringent seismic-resilience specifications raise costs
Stringent seismic-resilience specifications raise costs
| -1.3% | Nationwide, high-risk zones | Medium term (2-4 years) | |||
Lengthy customs lead-times for imported steel and
fittings Lengthy customs lead-times for imported steel and
fittings | -1.0% | National | Short term (≤ 2 years) | |||
| Source: Mordor Intelligence | ||||||
Rapid shift toward high-density blade and converged systems
Adoption of 1 MW water-cooled rack strings by hyperscalers condenses compute into fewer frames, trimming raw unit demand even as power budgets climb. Start-ups like CogniFiber push photonic accelerators that need fewer U-positions, reinforcing the densification trend.
Limited availability of land and power around Tel-Aviv metro
Real-estate tightness and grid bottlenecks slow greenfield builds, nudging operators toward peripheral sites such as the Timna mine project near Eilat.[3]Avi Bar-Eli, “Timna Mine Data Center Project Gains Approval,” globes.co.ilDistance from demand clusters inflates latency, complicating capacity planning for rack suppliers.
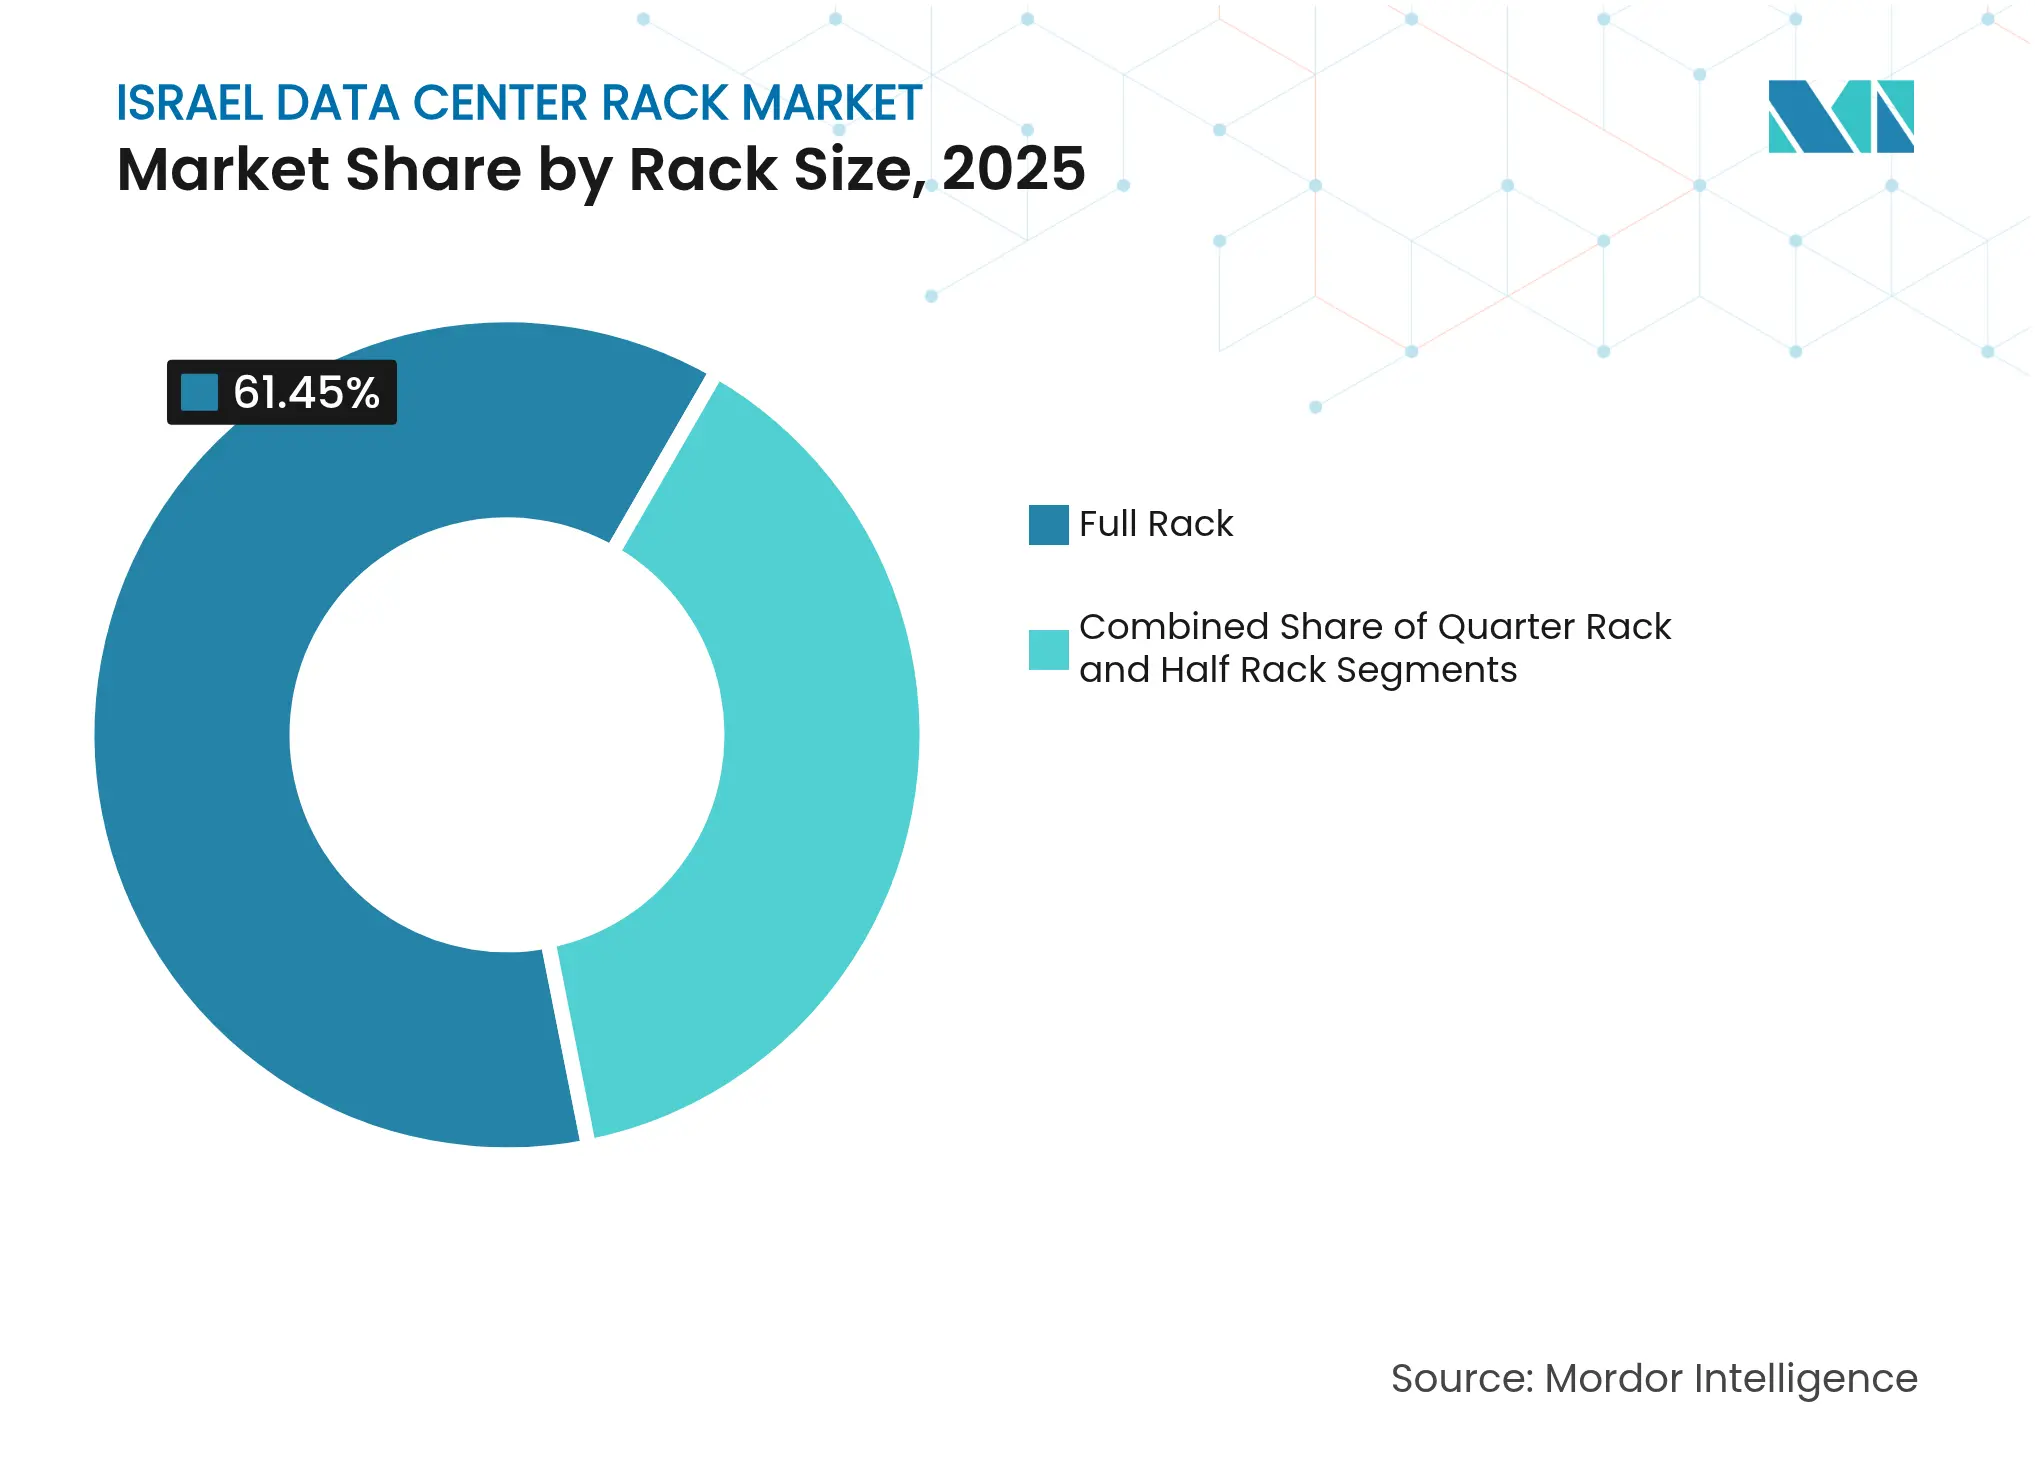
By Rack Size: Full Rack adoption scales with AI intensity
Full Rack units held 61.45% of Israel data center rack market share in 2025 and headline a 10.25% CAGR, making them the backbone of the Israel data center rack market. The Israel data center rack market size for Full Rack deployments accounted for USD 0.23 million in 2025, rising with hyperscale phases that specify 42–52U cabinets loaded to 25 kW. Defense labs and GPU farms choose these frames for cabling headroom and liquid manifolds. Quarter and Half Rack formats serve edge shelters and SME labs but seldom meet 20 kW thermal envelopes. Suppliers differentiate through tool-less rail systems and factory-integrated containment that shorten on-site labor. Constraints emerge around elevator clearances in underground sites, where knock-down frames or welded-split designs gain favor.
Second-wave demand will hinge on AI inference clusters in retail, transport and healthcare. Integrators expect Full Rack shipments to reach 5,800 units by 2030, reflecting Israel’s role as a testbed for generative-AI services. Vendors that preload breaker panels and DC busways ship faster than competitors relying on field assembly. Aluminum Full Racks gain traction where seismic-mass limits apply, shaving 25% weight while retaining torsional rigidity.
Note: Segment shares of all individual segments available upon report purchase
By Rack Height: 42U standard remains dominant while 48U gains ground
The 42U specification controlled 52.10% revenue in 2025, underpinning multivendor interoperability that corporate IT teams value. It embodies decades of rail accessory stock and proven cooling profiles, anchoring procurement in the Israel data center rack market. Taller 48U frames expand at 9.64% CAGR as land-scarce operators compress capacity.
Operators retrofitting car-park basements embrace 48U frames coupled with rear-door heat exchangers to reclaim floor tiles without new chillers. Yet, cable-management challenges arise once populate-to-top strategies elevate bundle densities. Suppliers respond with vertical troughs and rotating finger ducts. Heights ≥52U surface in telecom exchange modernizations; however, elevator and gantry limits plateau adoption.
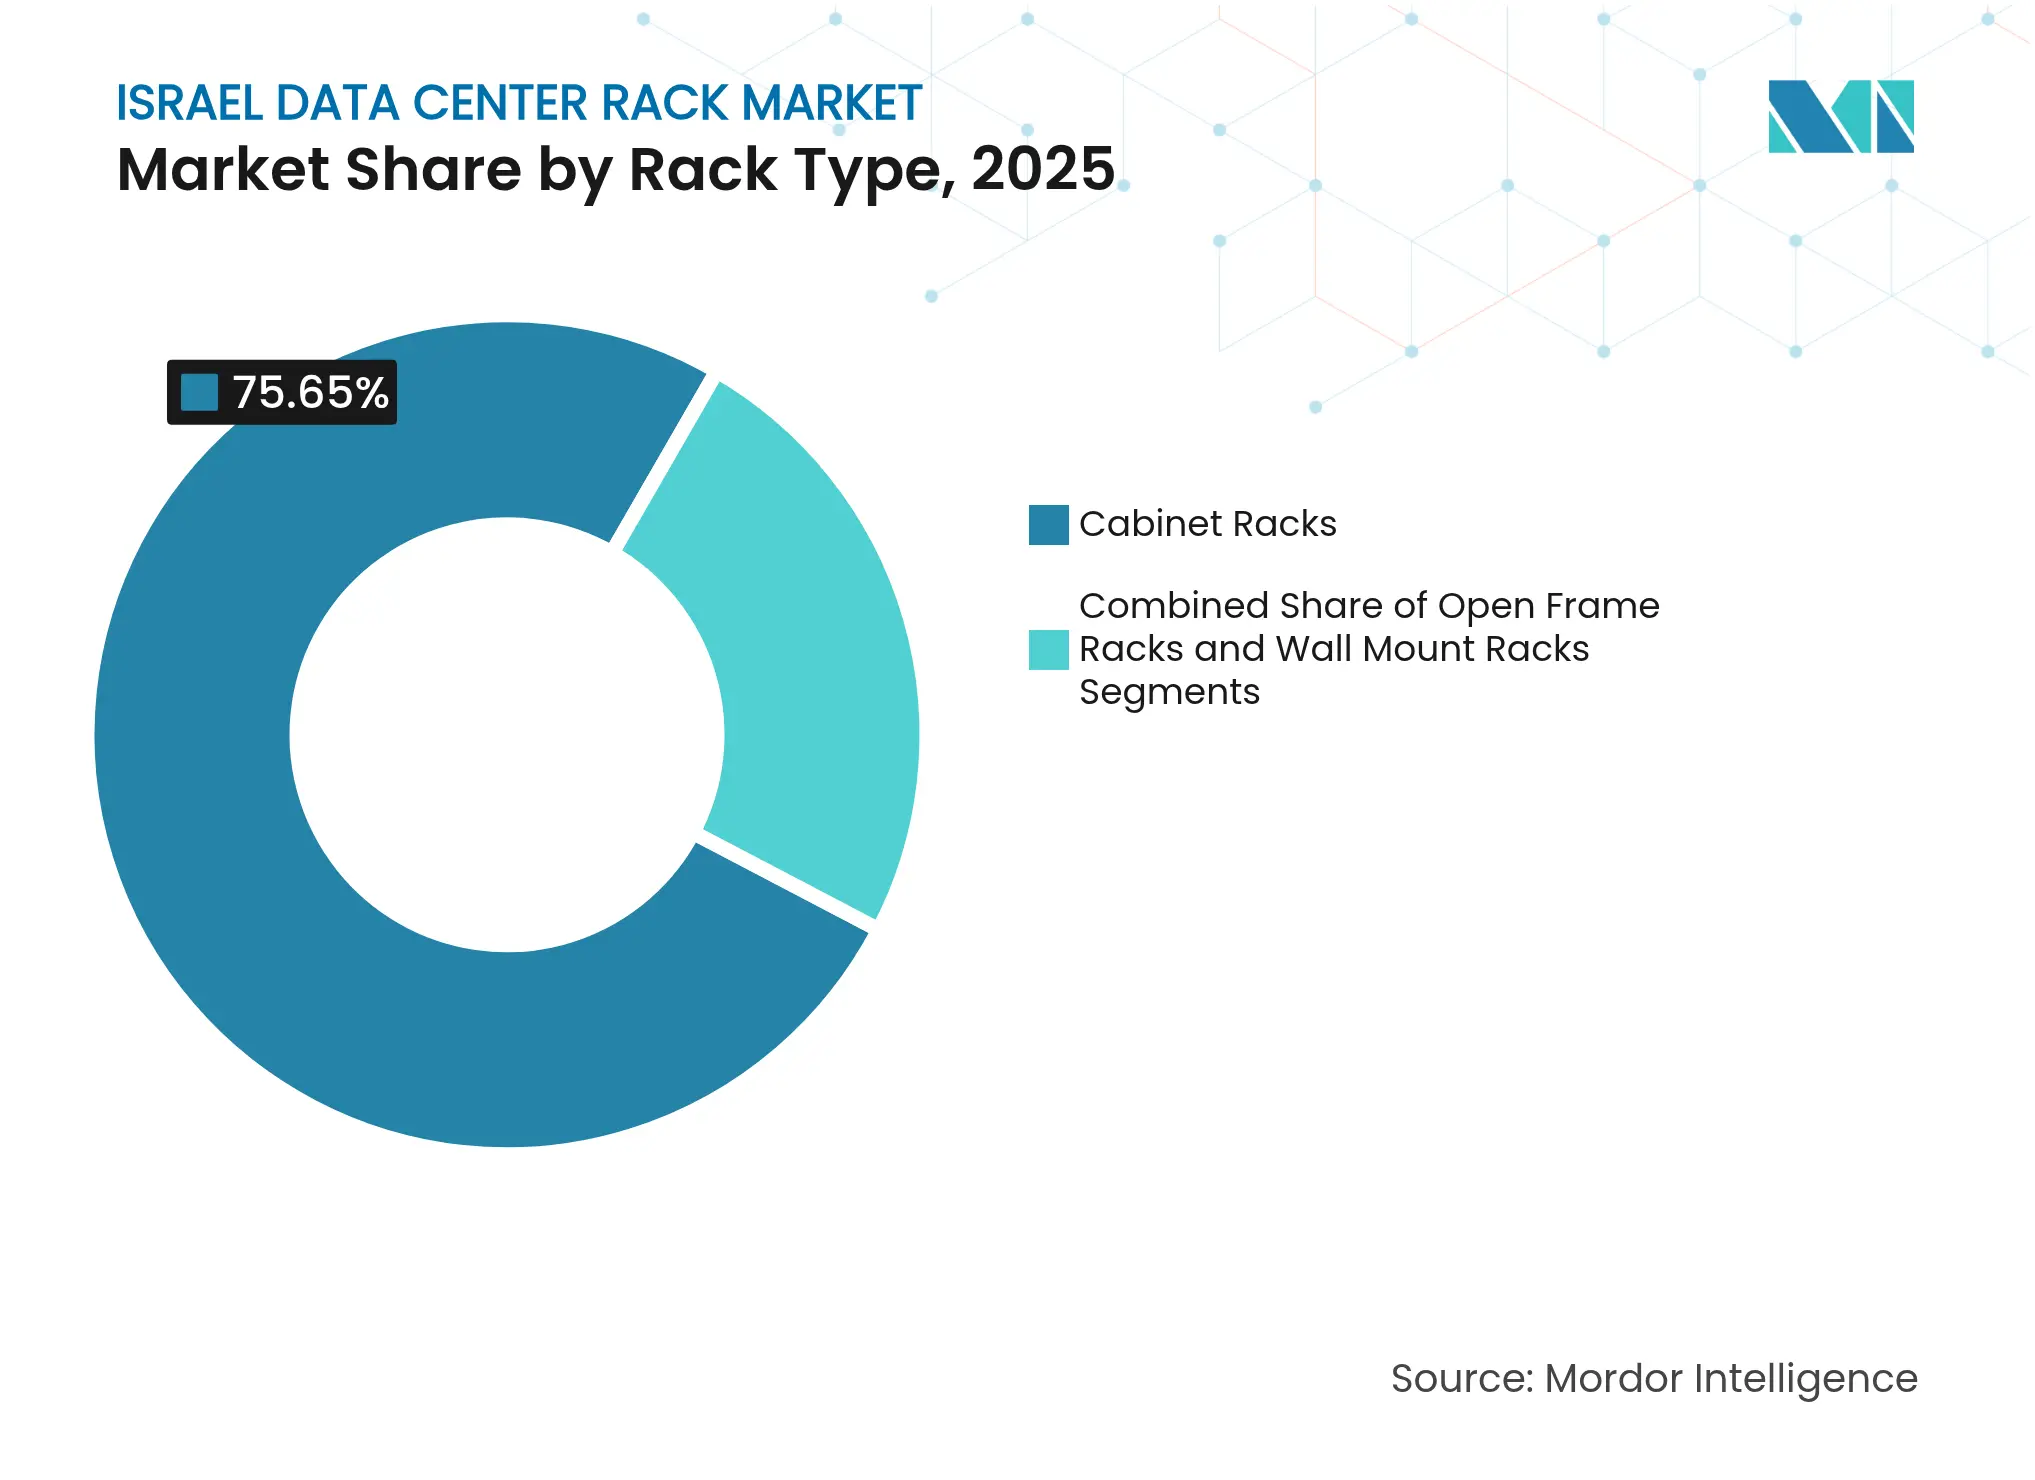
By Rack Type: Cabinet systems dominate security-sensitive deployments
Cabinet (closed) enclosures amassed a 75.65% share in 2025 and grow 10.72% CAGR, reflecting the security ethos of the Israel data center rack market. Their lockable doors, gasketed panels and RF attenuation meshes satisfy government and banking audits. Open-frame racks persist in controlled machine rooms where rapid cable access overrides tamper risks, but they seldom pass SCIF inspections. Wall-mount variants service roadside edge POPs, shipping in flat-pack kits that fit 19-inch switches and 1U microservers.
Cabinet suppliers now pre-bundle blanking panels and brushed entries to safeguard airflow. Demand for side-breathing IT gear triggers deeper 1,200 mm footprints and door-perforation rates exceeding 80% open area. Mixed-material doors steel skeletons clad with aluminum skins reduce door weight and hinge stress, a key convenience for underground halls with narrow aisles.
Note: Segment shares of all individual segments available upon report purchase
By Data Center Type: Colocation leads, but hyperscale accelerates fastest
Colocation facilities housed 54.85% of installed racks in 2025, echoing Israel’s vibrant start-up scene that prizes cap-ex flexibility. Hyperscale/cloud builds, however, record the steepest 11.05% CAGR, supercharging the Israel data center rack market as Microsoft, AWS and Oracle contract full-train loads of identical cabinets per build phase. The Israel data center rack market size for hyperscale segments is projected to surpass USD 0.28 million by 2031, tied to at least four new availability zones.
Enterprises maintain on-prem rooms for latency-sensitive or classified workloads, often opting for specialty seismic frames. Edge containers mushroom along 5G corridors, each integrating eight to twelve 20U swing-cabinets supporting MEC apps. Rack vendors partnering with modular-data-center fabricators penetrate this emerging end-user tier early.
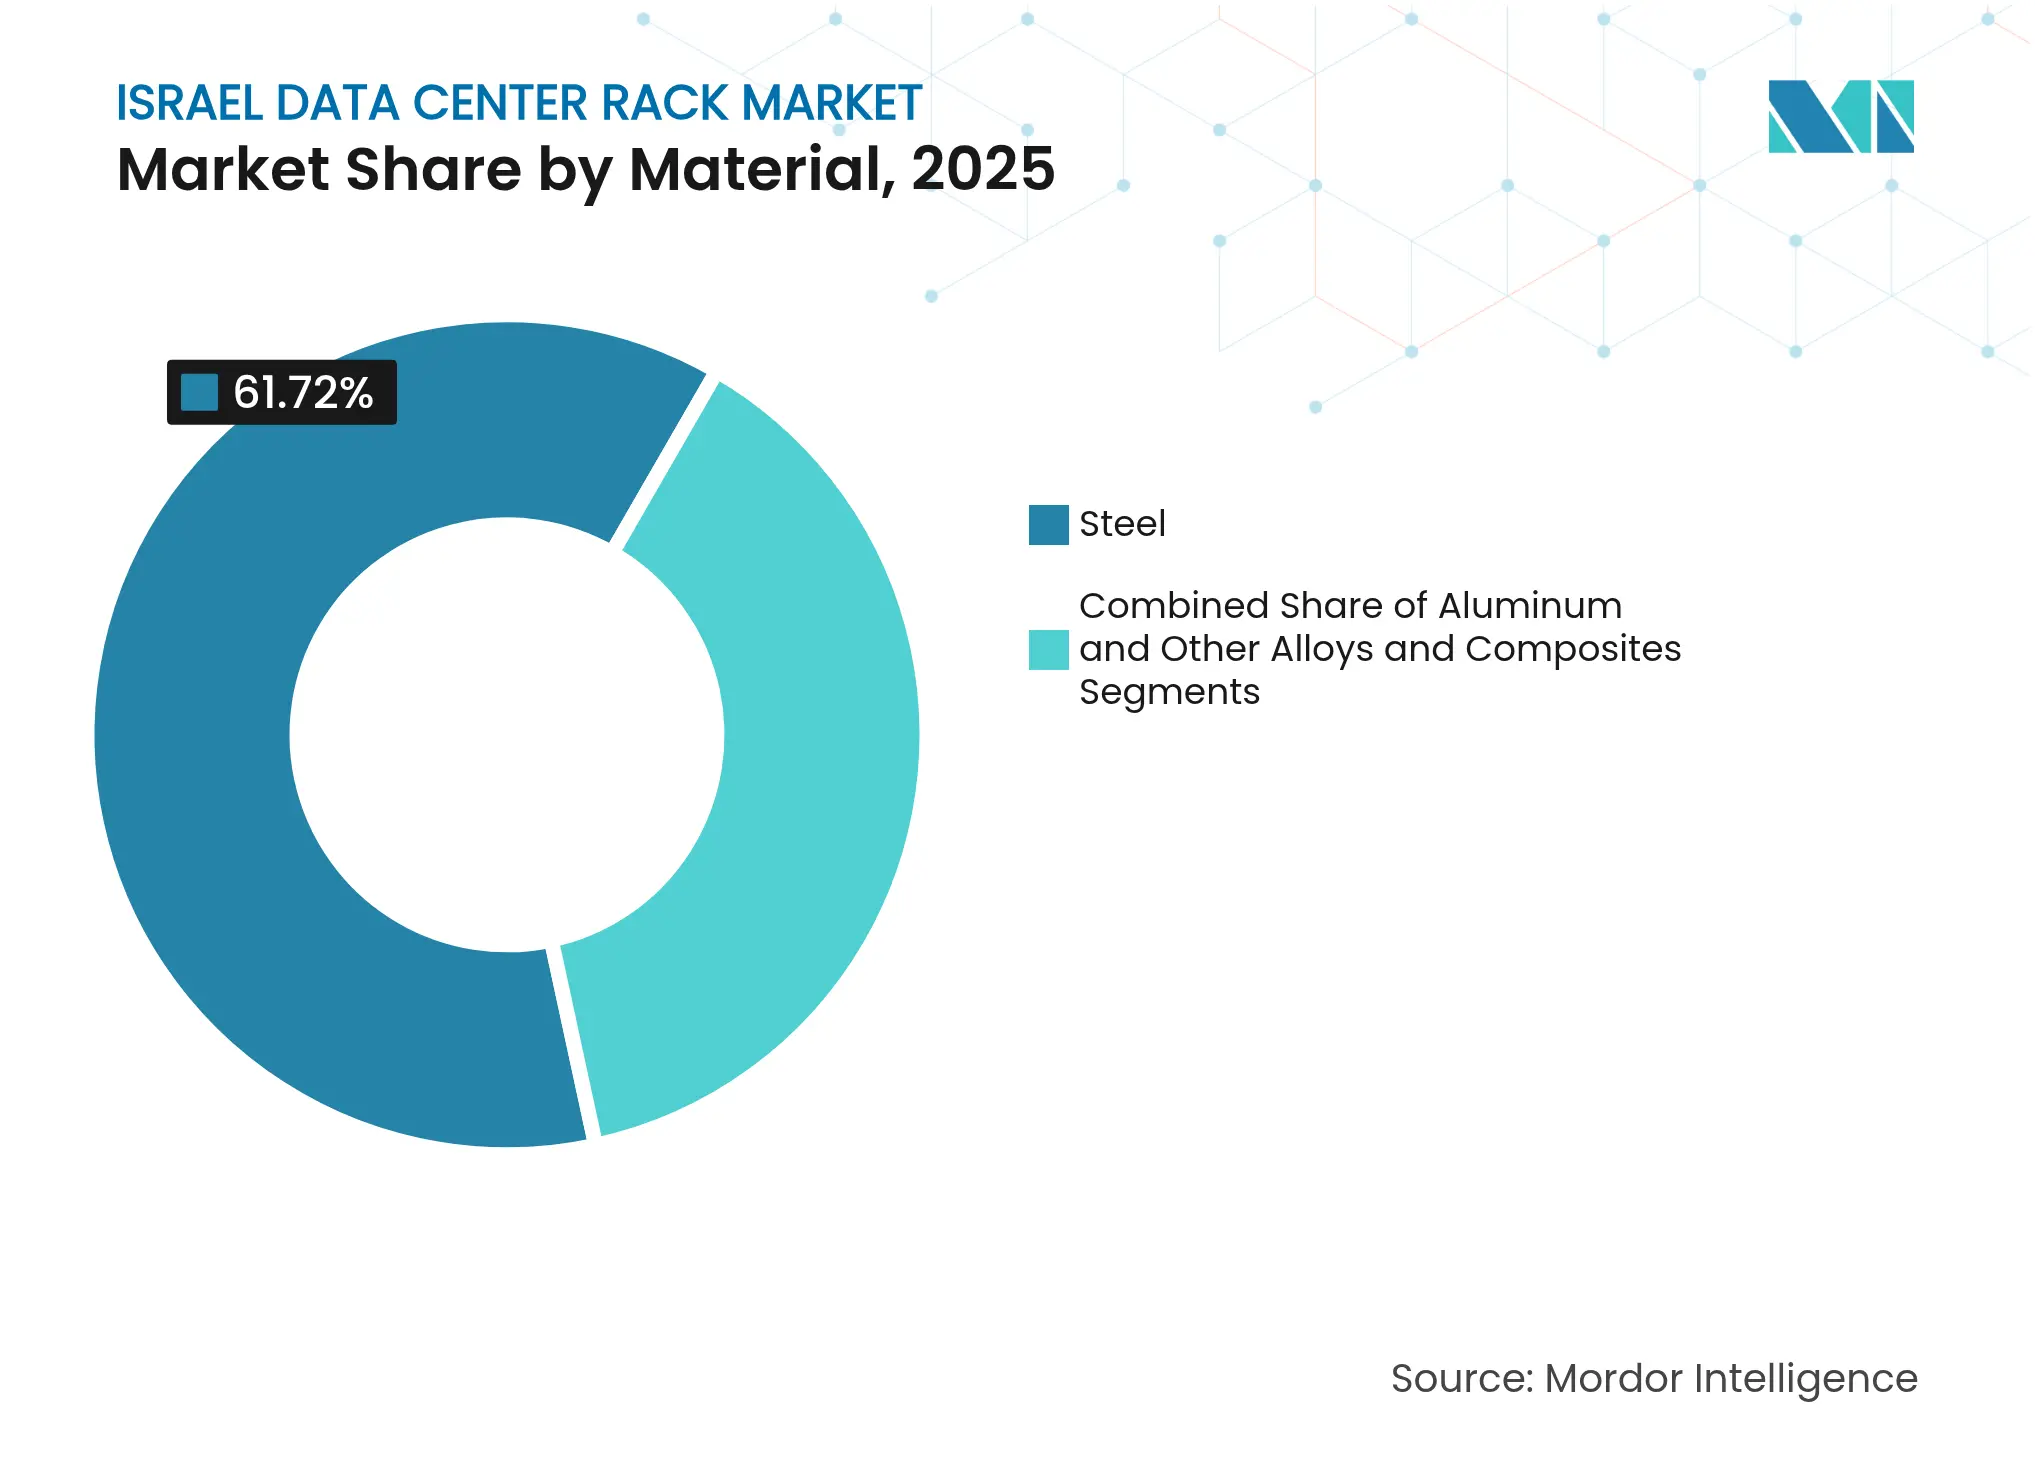
By Material: Steel retains majority while aluminum races ahead
Steel framed 61.72% shipments in 2025 thanks to low cost and elasticity that meets seismic code SII 413. Yet aluminum registers 9.96% CAGR on the strength of weight savings that cut crane lifts in underground shafts. Where copper densities surge, aluminum’s thermal conductivity disperses hot-spot gradients, making it popular for rear-door coolers.
Hybrid designs emerge as steel pillars supply load-bearing muscle, while aluminum sidewalls shed calories. Powder-coated galvanized steel still excels in electromagnetic shielding, required in defense SCIF rooms. Supply-chain shocks mainly the Turkish embargo propel domestic steel procurement, but extended customs delays make locally extruded aluminum a nimble alternative.
Note: Segment shares of all individual segments available upon report purchase
Israel data center rack market activity clusters along the Tel Aviv coastline, where financial, cloud, and media tenants co-locate within milliseconds of one another. Coastal cable-landing sites now anchor purpose-built bunkers that dispatch low-latency traffic to Europe through the Blue-Raman fiber path, reinforcing domestic rack demand. Capacity saturation and zoning hurdles push new halls southward toward the Negev; the Timna mine conversion near Eilat exemplifies this shift, pairing reclaimed tunnels with 400 G fiber and high-irradiance solar fields.
Northern arcs around Haifa leverage university talent pools and research parks. Defense projects near Zikim and Palmachim Airbases adopt dispersed micro-sites, each ordering limited batches of bomb-shelter-rated cabinets. Inland Jerusalem localities, while power-constrained, house national archive facilities that require long-term thermal stability. Together, these regional commitments diversify the Israel data center rack market, mitigating footprint congestion in the Dan metropolitan grid.
Market Concentration
Global OEMs Schneider Electric, Vertiv and Rittal deploy broad catalogs and integrated power-cooling stacks that resonate with hyperscale buyers. They dominate blanket agreements exceeding 1,000-rack call-offs yet local specialists offset scale with agility. CPI-Electra fabricates steel frames in Tel-Aviv, shrinking lead times to two weeks versus the eight-week import cycle. Amcor Enclosures infuses seismic isolators and cable-entry blast baffles tailored for defense tenders.
Technology differentiation leads strategy. Chatsworth Products markets passive-chimney cabinets that reclaim 30% cooling overhead and capture edge contracts at telco shelters. Rittal pilots rear-door fluid coolers rated 40 kW that snap into existing TS IT frames, appealing to upgrade projects constrained by chiller limits. Vertiv bundles busbar trunking and row-level UPS inside its VR rack line to win speed-to-deploy contests.

*Disclaimer: Major Players sorted in no particular order
1. INTRODUCTION
2. RESEARCH METHODOLOGY
3. EXECUTIVE SUMMARY
4. MARKET LANDSCAPE
5. MARKET SIZE AND GROWTH FORECASTS (VALUES)
6. COMPETITIVE LANDSCAPE
7. MARKET OPPORTUNITIES AND FUTURE OUTLOOK
Market Definitions and Key Coverage
Segmentation Overview
Detailed Research Methodology and Data Validation
Primary Research
Desk Research
Market-Sizing & Forecasting
Data Validation & Update Cycle
Why Mordor's Israel Data Center Rack Baseline Commands Reliability
Benchmark comparison
| Market Size | Anonymized source | Primary gap driver | ||
|---|---|---|---|---|
USD 0.37 M (2025) | Mordor Intelligence | - | Anonymized source:Mordor Intelligence | Primary gap driver:- |
USD 0.32 M (2024) | Regional Consultancy A | Excludes aluminum and custom-height racks; older currency base year | ||
USD 150 M (2025) | Trade Journal B | Rolls racks into full power-distribution cabinets and includes wider Middle East orders booked in Israel |
Pricing Strategy for Semiconductor Components
3 Min Read
Accelerating Additive Manufacturing Adoption in India
3 Min Read
When decisions matter, industry leaders turn to our analysts. Let’s talk.