
Insight As A Service Application Market Size and Share
Market Overview
| Study Period | 2020 - 2031 |
|---|---|
| Market Size (2026) | USD 8.64 Billion |
| Market Size (2031) | USD 21.12 Billion |
| Growth Rate (2026 - 2031) | 19.56 % |
| Fastest Growing Market | Asia Pacific |
| Largest Market | North America |
| Market Concentration | Medium |
Major Players *Disclaimer: Major Players sorted in no particular order Image © Mordor Intelligence. Reuse requires attribution under CC BY 4.0. | |
Insight As A Service Application Market Analysis by Mordor Intelligence
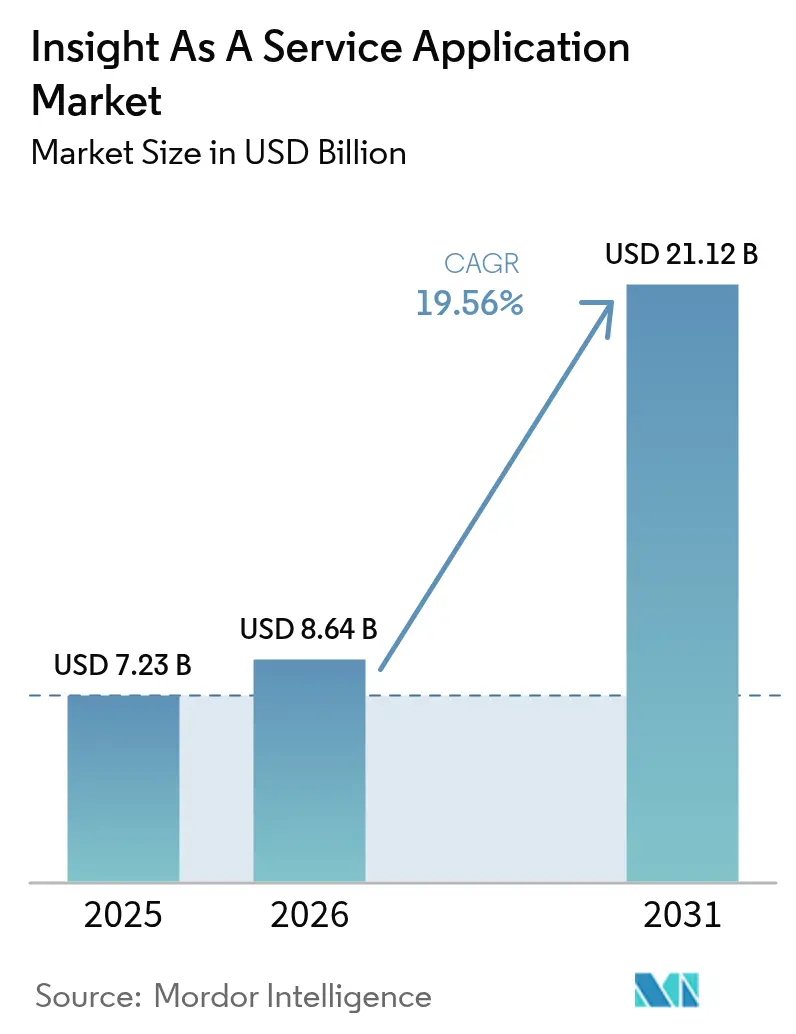
The insight-as-a-service application market size in 2026 is estimated at USD 8.64 billion, growing from 2025 value of USD 7.23 billion with 2031 projections showing USD 21.12 billion, growing at 19.56% CAGR over 2026-2031. This expansion reflects a steady shift away from perpetual licenses toward consumption-based cloud subscriptions, which align spending with workload intensity. Usage-based billing lifted revenue growth 1.5 times faster than seat-based plans across software-as-a-service vendors in 2024, a pattern most visible in analytics workloads where compute demand swings with query complexity.[1]Zuora, “Subscription Economy Index 2024,” zuora.com Generative artificial intelligence (AI) now automates the analysis of unstructured data, lowers technical barriers for business users, and increases cloud consumption, further boosting the insight-as-a-service application market. Public cloud still dominates deployment, yet hybrid architectures are scaling quickly as regulated industries balance sovereignty mandates with hyperscaler capacity. Vertical AI platforms and prescriptive analytics are accelerating decision automation, while small and medium enterprises (SMEs) adopt consumption-priced offerings that remove capital hurdles.
Key Report Takeaways
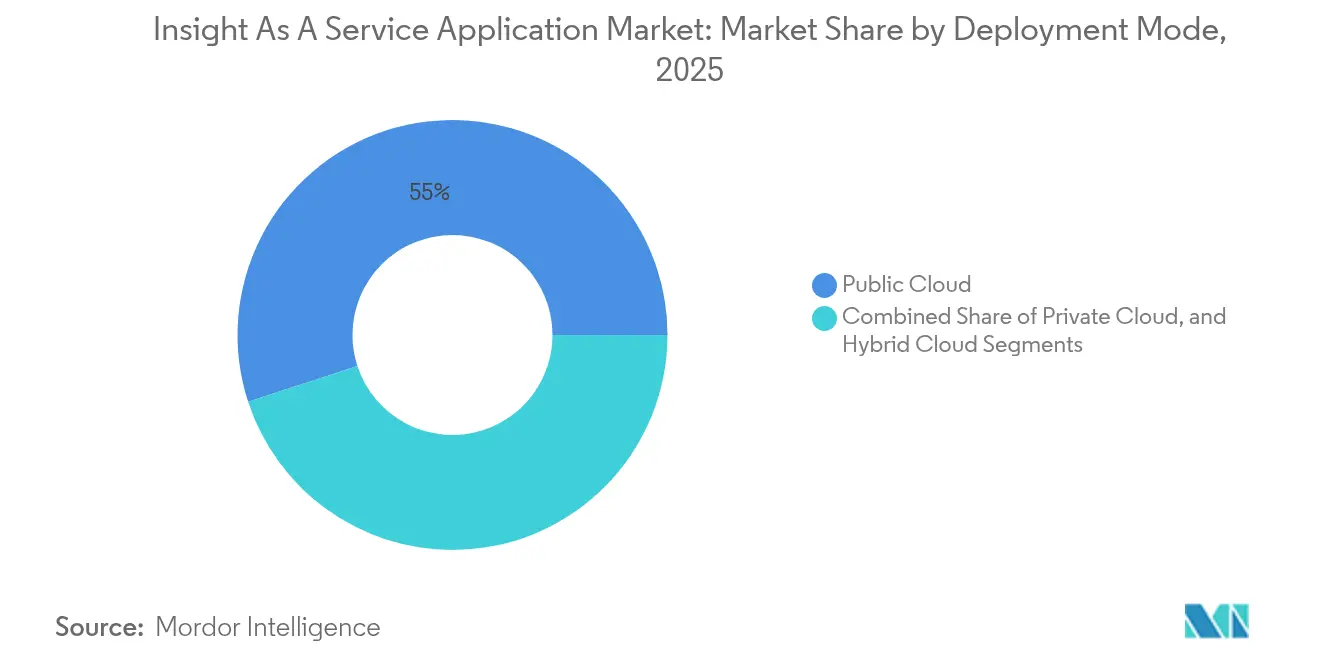
- By deployment mode, public cloud led with 55.02% revenue share in 2025; hybrid cloud is forecast to expand at a 20.24% CAGR through 2031.
- By service type, predictive insights accounted for 45.01% of the insight-as-a-service application market share in 2025, while prescriptive insights are projected to advance at a 23.12% CAGR through 2031.
- By application, customer life-cycle management captured 37.57% of 2025 revenue; strategy management is projected to grow at a 21.66% CAGR through 2031.
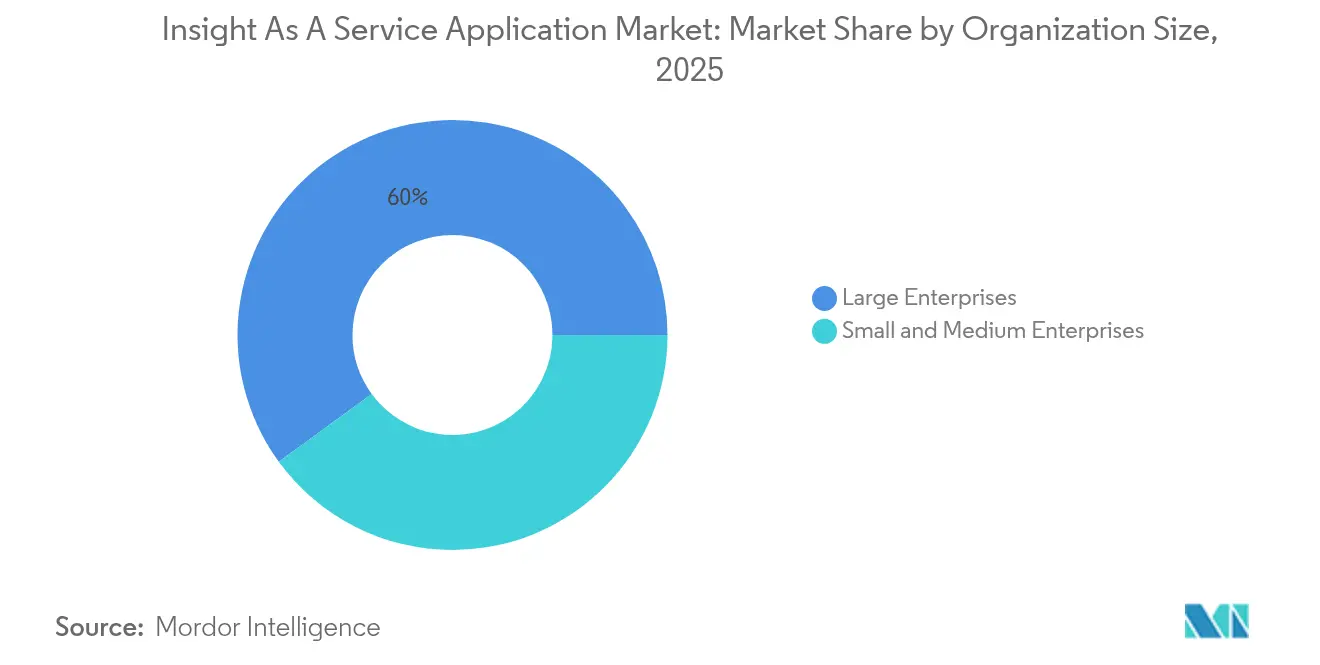
- By organization size, large enterprises held a 60.03% share in 2025, whereas SMEs are set to register a 23.47% CAGR between 2026 and 2031.
- By end-user industry, banking, financial services, and insurance led with 29.12% revenue share in 2025; healthcare is expected to record a 19.94% CAGR over the forecast period.
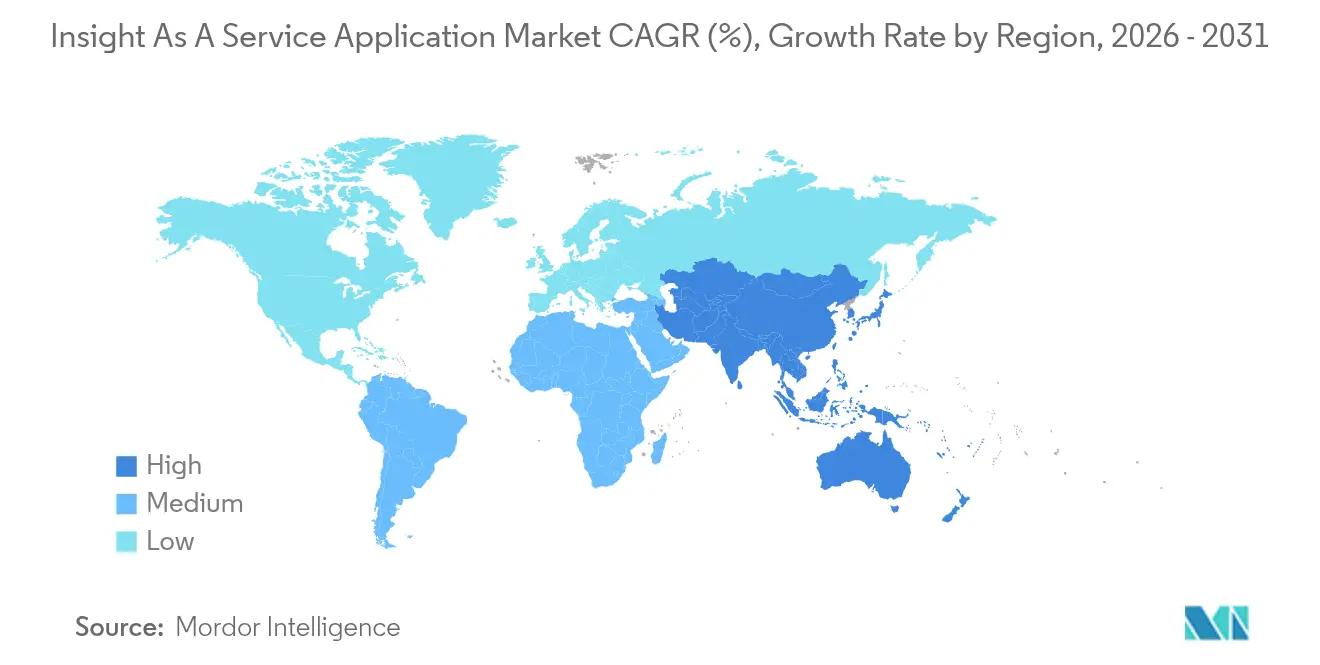
- By geography, North America maintained a 40.77% share in 2025, while the Asia Pacific is poised to grow at a 21.77% CAGR through 2031.
Note: Market size and forecast figures in this report are generated using Mordor Intelligence’s proprietary estimation framework, updated with the latest available data and insights as of 2026.
Market Trends and Insights
Drivers Impact Analysis of Insight As A Service Application Market*
| Driver | (~) % Impact on CAGR Forecast | Geographic Relevance | Impact Timeline |
|---|---|---|---|
| Increasing Adoption of Big Data and IoT | +3.2% | Global, centered in North America and the Asia Pacific manufacturing hubs | Medium term (2-4 years) |
| Increasing Customer Engagement Demand | +2.8% | Global, notably in North America and Europe, retail and ecommerce | Short term (≤ 2 years) |
| Growing Use of Generative AI for Automated Insights | +4.5% | Global, with North America and Europe as early adopters | Short term (≤ 2 years) |
| Migration Toward Consumption-Based Analytics Subscriptions | +3.1% | Global, fastest in North America and Western Europe | Medium term (2-4 years) |
| Rising Compliance Complexity Driving Outsourced Insight Demand | +2.4% | Europe, North America, and the Asia Pacific | Long term (≥ 4 years) |
| Expansion of Industry-Specific Vertical AI Platforms | +2.9% | Global, led by healthcare and BFSI | Medium term (2-4 years) |
| Source: Mordor Intelligence | |||
Growing Use of Generative AI for Automated Insights
Generative AI is compressing insight delivery from days to minutes. IBM’s watsonx.Data embeds large language models inside lakehouse environments, allowing analysts to query structured and unstructured data conversationally.[2]IBM, “Hybrid Cloud Study 2024,” ibm.com Snowflake processed 12 billion Cortex AI queries in its first quarter, with 35% of these queries utilizing generative functions, such as document summarization. SAP customers cut month-end close cycles by 60% after integrating the Joule Copilot with Analytics Cloud. By automating narrative creation and anomaly detection, generative AI democratizes analytics and broadens the insight-as-a-service application market.
Migration Toward Consumption-Based Analytics Subscriptions
Hybrid pricing, which combines a base fee with usage overages, now covers 61% of software-as-a-service vendors, up from 38% in 2022. Databricks’ consumption revenue rose 75% year over year, triple its seat-based growth, after customers expanded real-time and machine-learning workloads. The flexible model removes capital barriers for SMEs and aligns vendor incentives with performance, fueling retention that averages 18 months longer than fixed plans.
Increasing Adoption of Big Data and IoT
Industrial IoT projects stream sensor data at volumes traditional data warehouses cannot absorb. HiveMQ reported that 68% of industrial firms deployed edge analytics in 2024, trimming latency from 2.3 seconds to 180 milliseconds.[3]HiveMQ, “IoT Pulse Report 2024,” hivemq.com Cognite’s embedded platform maps time-series readings to digital twins, spotting equipment degradation 72 hours before failure. 5G rollout and cheaper edge hardware lowered data transport cost 40% between 2022 and 2024, making real-time analytics viable for supply chain and grid balancing use cases.
Increasing Customer Engagement Demand
Retailers and ecommerce brands rely on analytics to personalize experiences, driving higher engagement and conversion. Salesforce’s Einstein AI processed 1 trillion customer interactions each week in 2024, identifying churn risk and upsell potential at scale. Adobe’s Customer Journey Analytics handled 15 trillion behavioral events to optimize cross-channel media allocation. Rising consumer expectations are driving the wider adoption of prescriptive and predictive tools, thereby sustaining the growth trajectory of the insight-as-a-service application market.
Restraints Impact Analysis of Insight As A Service Application Market*
| Restraint | (~) % Impact on CAGR Forecast | Geographic Relevance | Impact Timeline |
|---|---|---|---|
| Data Security and Safety Concerns | -2.1% | Global, heightened in Europe, and healthcare | Short term (≤ 2 years) |
| Shortage of Domain-Specific Data-Science Talent | -1.8% | Global, acute in North America and Western Europe | Long term (≥ 4 years) |
| Vendor Lock-In and Interoperability Challenges | -1.3% | Global, impacting multi-cloud enterprises | Medium term (2-4 years) |
| Escalating Cloud-Compute Cost Pressures | -1.6% | Global, intense in high-frequency workloads | Medium term (2-4 years) |
| Source: Mordor Intelligence | |||
Data Security and Safety Concerns
Snowflake’s June 2024 breach exposed 165 customer environments after attackers used recycled credentials, shaking confidence in cloud analytics.[4]Snowflake, “Security Incident Update,” snowflake.com IBM’s X-Force found misconfigurations caused 28% of breaches, many tied to complex permission models on analytics services. Europe’s NIS2 directive now requires incident disclosure within 24 hours, adding compliance pressure. Heightened scrutiny slows procurement and lengthens proof-of-concept cycles, limiting near-term expansion.
Shortage of Domain-Specific Data-Science Talent
McKinsey estimated a 250,000-person shortfall in U.S. data scientists during 2024. LinkedIn posted 45% year-over-year growth in data-science openings, with healthcare and financial services paying 22% premiums for certified talent. SMEs struggle to match hyperscaler compensation and often defer advanced analytics deployments, which moderates the growth of the insight-as-a-service application market.
*Our forecasts treat driver/restraint impacts as directional, not additive. The impact forecasts reflect baseline growth, mix effects, and variable interactions.
Insight As A Service Application Market Segment Analysis
By Deployment Mode:
Hybrid Architectures Gain TractionHybrid environments are projected to grow at a 20.24% CAGR through 2031, despite the public cloud holding a 55.02% share of the insight-as-a-service application market in 2025. IBM found 87% of enterprises use multiple clouds, with 62% citing compliance as a driver. Red Hat OpenShift subscriptions rose 34% year over year as firms orchestrated Kubernetes across on-premise and public clouds.
Hybrid adoption is on the rise as financial institutions continue to store sensitive data on-premises while training models in hyperscaler regions. Google Cloud’s confidential computing encrypts data during processing, bringing regulated workloads to public infrastructure and lifting healthcare customer count 58% in 2024. Edge nodes at factories and stores are now extensions of hybrid clouds, deepening the penetration of the insight-as-a-service application market.



By Service Type:
Prescriptive Analytics Accelerate Decision AutomationPrescriptive insights, though trailing predictive insight revenue today, are advancing at a 23.12% CAGR as companies automate operational choices. Anaplan’s connected planning reduces manual scenario modeling by 70% for consumer goods manufacturers. Workday’s 2024 purchase of an optimization engine confirms the pivot toward recommendation-oriented services.
Deep reinforcement learning demonstrates its prescriptive power: DeepMind reduced Google's data-center energy use by 40% in 2024. As more firms embed decision engines directly into workflows, the insight-as-a-service application market size for prescriptive platforms will widen.
By Application:
Strategy Management Emerges as Growth LeaderStrategy management software is set to grow 21.66% annually, challenging customer life-cycle management’s 37.57% 2025 revenue lead. Oracle Enterprise Performance Management Cloud cascades objectives into key results, flagging initiatives that are off track in real-time. SAP Analytics Cloud links balanced scorecards to transaction data, eliminating approximately 40 hours of manual consolidation each month.
Boards want always-current views of execution, driving investment in strategy dashboards. While customer life-cycle analytics remain significant for retention and upselling, the need for real-time governance pushes strategy management forward, expanding the insight-as-a-service application market.
By Organization Size:
SMEs Drive Adoption VelocitySMEs are forecast to expand their adoption at a 23.47% CAGR, although large enterprises contributed 60.03% of the 2025 revenue. Microsoft Power BI reported 40% year-over-year growth among firms with fewer than 500 employees, crediting the use of turnkey connectors to accounting and CRM tools. Zoho added 50,000 analytics customers by offering plans from USD 24 per month.
Consumption pricing and pre-configured templates enable SMEs to launch dashboards in just weeks. Large organizations continue to drive the majority of the insight-as-a-service application market size due to their complex security requirements and multi-department rollouts.
By End-User Industry:
Healthcare Leads Growth Amid Value-Based CareHealthcare analytics are projected to grow at a 19.94% annual rate to 2031, outpacing but not yet surpassing the banking, financial services, and insurance sector. The Medicare Shared Savings Program covers 11 million beneficiaries, requiring near real-time monitoring of quality and cost metrics. Epic’s Cosmos lets health systems benchmark outcomes across 215 million de-identified patient records.
Predictive deterioration alerts from Philips HealthSuite reduced intensive-care transfers by 23% during pilots. While BFSI retains the largest share of the insight-as-a-service application market, value-based reimbursement is driving a surge in healthcare’s analytics spending.
Geography Analysis
North America Insight As a Service Application Market
North America accounted for 40.77% of the insight-as-a-service application market in 2025. The United States Federal Data Strategy mandates the use of open APIs for public datasets by 2025, thereby expanding government analytics demand. Canada allocated CAD 2.4 billion (USD 1.8 billion) for cloud migration in federal agencies, supporting regional growth. Mexico’s open-banking regulation generated 450 million API calls monthly by year-end 2024, catalyzing fintech analytics.
APAC Insight As a Service Application Market
The Asia Pacific is projected to post a 21.77% CAGR, the fastest growth rate worldwide. China’s Digital Economy Development Plan aims for a 10% annual expansion in data-driven industries. India’s Digital India initiative connected 1.2 billion residents to digital ID and payments, broadening analytics workloads in public services. Singapore deployed 110,000 sensors under its Smart Nation program, feeding real-time optimization models. Government mandates and hyperscaler investment combine to deepen the insight-as-a-service application market footprint.
Europe and Middle East Insight As a Service Application Market
Europe’s GDPR influences architectural design through strict data minimization and deletion rules, adding 15-20% to project costs. Germany’s Gaia-X federation enrolled 350 firms by late 2024, spurring demand for distributed analytics platforms. The United Kingdom budgeted GBP 1.2 billion (USD 1.5 billion) for public-sector data modernization, with National Health Service projects taking 40% of spending. Emerging markets show pockets of momentum, such as Saudi Arabia’s USD 500 billion NEOM smart-city deployment, where edge analytics underpin transport and energy optimization.

Regulatory Landscape
Compliance requirements for insight-as-a-service applications are tightening around AI governance, cybersecurity, and cross-border data controls. As a result, vendors are being pushed to operationalize risk management and data governance, with audit-ready technical documentation for model-driven analytics. In the European Union, the EU AI Act introduces obligations for providers and deployers of AI systems, including risk management, data governance, and technical documentation requirements that intersect with embedded generative AI in analytics workflows.
Data portability and interoperability rules are also shaping platform architecture and commercial terms. The EU Data Act (applied from 2025) adds requirements around data access and interoperability, including provisions tied to switching and data egress that become enforceable from January 12, 2027. This is increasing attention on open interfaces, metadata/lineage, and exit planning in enterprise procurement. In the United States, NIST continues to anchor enterprise controls through voluntary guidance such as the AI Risk Management Framework, and in December 2025 the draft NIST IR 8596 Cybersecurity Framework Profile for AI. Vendors and buyers use it to structure security controls for AI-enabled insight services.
Value Chain Analysis
The value chain for insight-as-a-service applications begins with data origination, including enterprise applications, IoT/edge systems, and partner data. It then moves through ingestion via connectors, APIs, streaming, and ETL/ELT into cloud data platforms, such as warehouses, lakehouses, and event stores. Governance and security layer on top of this, covering identity, access controls, data cataloging, lineage, and policy enforcement. Next is the analytics and AI layer, including semantic modeling, BI, automated insight generation, and embedded generative AI. The chain ends with delivery into business workflows through dashboards, embedded analytics, and operational applications.
Hyperscalers and data-platform providers supply underlying compute and storage economics that help consumption-based insight services work at scale. Independent software vendors differentiate through verticalized models, prebuilt metrics, and workflow integrations. Implementation and distribution are also mediated by systems integrators, consulting firms, and managed service providers that package accelerators, data products, and operating-model changes for regulated and complex enterprises. Partner ecosystems increasingly emphasize interoperability and bridging legacy bottlenecks, as shown by media supply-chain integrations such as the April 2024 Ateliere Creative Technologies and TMT Insights partnership and the July 2024 ThinkAnalytics and TMT Insights partnership, both aimed at embedding insights into operational supply chains. Across the chain, recurring friction points include fragmented data access and data quality, which continue to surface when enterprises scale generative AI and prescriptive insights beyond pilot deployments.
Competitive Landscape
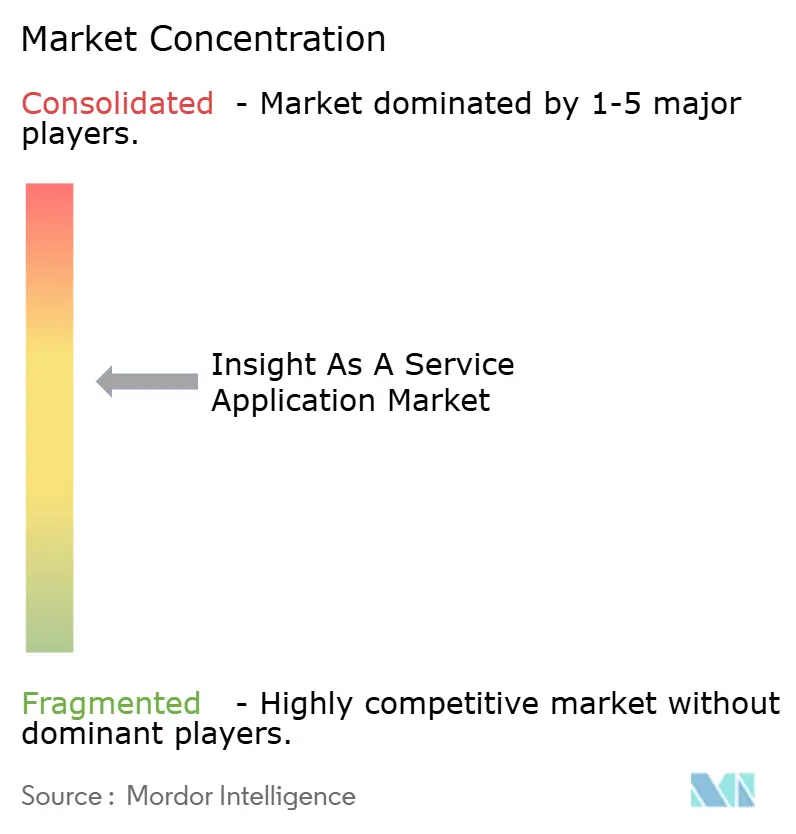
The insight-as-a-service application market remains moderately concentrated, with the ten largest vendors accounting for a significant share of 2024 revenue while several hundred specialists compete in regional or vertical niches. Hyperscalers continue to subsidize analytics software to drive infrastructure usage; for example, Amazon Web Services priced QuickSight usage at USD 0.30 per session in 2024, undercutting most independent offerings by about 70%. Consulting firms strengthen stickiness by bundling proprietary accelerators with long-term managed-service contracts, as shown by Accenture’s myWizard platform, which generated USD 2.1 billion in services revenue during fiscal 2024 after adding pre-built analytics workflows for 23 industries. Independent software vendors defend their margins by going deep into domain workflows; Veeva Systems captured a 78% share among the top 20 pharmaceutical companies by embedding regulatory submission tracking and sales-force effectiveness metrics that horizontal tools lack.
Vertical integration and data-platform consolidation intensified during 2024 and 2025. Oracle’s earlier USD 28.3 billion purchase of Cerner combined electronic health records with Oracle Health Data Intelligence, providing the company with unique clinical data assets that competitors cannot easily replicate. Salesforce followed a similar playbook by acquiring Informatica for USD 27.7 billion in April 2024, combining customer relationship management with enterprise-scale data integration, lineage, and governance. IBM closed its USD 4.6 billion acquisition of Apptio in June 2025 to fold cloud FinOps capabilities into IBM Consulting, enabling clients to align analytics consumption with budget controls. These moves signal an arms race to own both data gravity and the semantic layer that powers automated insights.
The innovation pace remains high, as evidenced by Microsoft's 127 analytics-related patents filed in 2024, 42% of which focused on natural-language querying and automated insight generation. White-space opportunities are emerging at the edge, where sub-100-millisecond inference is essential for autonomous systems; Databricks grew annual recurring revenue 60% to USD 2.4 billion by unifying engineering and machine-learning workflows on a single lakehouse, while Snowflake attracted 1,200 software vendors to build native applications on Snowpark by year-end 2024. Heightened security expectations now shape procurement: 89% of 2024 enterprise requests for proposals required ISO 27001 or SOC 2 Type II attestations, prompting vendors to embed governance and audit capabilities from the outset. Together, these dynamics create a landscape where scale, vertical depth, and credibility of compliance determine competitive advantage.
Insight As A Service Application Industry Leaders
Oracle Corporation
IBM Corporation
Accenture PLC
Dell Technologies Inc.
GoodData Corporation
- *Disclaimer: Major Players sorted in no particular order
Insight As A Service Application Market Companies Covered in this Report
- Oracle Corporation
- Accenture plc
- International Business Machines Corporation
- Dell Technologies Inc.
- Deloitte Touche Tohmatsu Limited
- GoodData Corporation
- Capgemini SE
- SmartFocus Ltd.
- Zephyr AI Health Inc.
- NTT Data Corporation
- Microsoft Corporation
- Amazon Web Services Inc.
- Google LLC
- SAP SE
- SAS Institute Inc.
- Salesforce Inc.
- TIBCO Software Inc.
- Alteryx Inc.
- QlikTech International AB
- Tableau Software LLC
- Sisense Inc.
- Domo Inc.
- Teradata Corporation
- MicroStrategy Incorporated

Market Opportunities and Future Outlook
A clear opportunity is packaging AI-enabled insights as implementation-ready outcomes rather than standalone analytics features, particularly as enterprises move from experimentation to production. Dedicated implementation capacity from AI and investment ecosystem players also provides a concrete market signal: in May 2026, Anthropic launched Ode as a USD 1.5 billion AI implementation venture with Blackstone, Hellman & Friedman, and Goldman Sachs. The focus is on on-site AI engineering and deployment for enterprises, supporting whitespace for insight-as-a-service vendors and integrators to bundle governed data foundations, model operations, and workflow integration into repeatable delivery playbooks for areas like finance, customer operations, and supply-chain optimization.
Regulated, sovereignty-sensitive buyers are also creating demand for differentiated offerings centered on policy enforcement, audit trails, and hybrid architectures, rather than model performance alone. Europe-facing deployments further elevate switching, interoperability, and data egress readiness as procurement requirements under the EU Data Act timeline toward January 2027 take shape, reinforcing interest in open connectors and semantic layers that move across platforms, along with stronger lineage and access controls. At the same time, security posture is turning into a commercial differentiator after widely publicized cloud analytics incidents, which supports configurations and managed governance that reduce misconfiguration risk and accelerate compliance validation for AI-augmented insight delivery.
Recent Industry Developments in Insight As A Service Application Market
- July 2026: Insight Enterprises announced it would offer Microsoft 365 E7, an AI-powered Frontier Suite, and positioned itself as a global launch partner for Microsoft Agent 365. The move strengthens Insight's role as a services-led channel for agentic AI adoption and expands its ability to bundle analytics, security, and deployment services around Microsoft platforms.
- May 2026: IBM put IBM Concert into public preview and announced IBM Sovereign Core as generally available, emphasizing policy controls at the infrastructure runtime level. These releases support enterprises running insight workloads across hybrid environments by tightening operational governance and sovereignty controls alongside AI-enabled operations.
- May 2024: Accenture and Oracle announced a collaboration focused on helping clients accelerate generative AI adoption, starting with finance use cases. The partnership underscores continued investment in packaged industry and function accelerators that combine cloud applications, data foundations, and AI services to deliver decision-ready insights.


Insight As A Service Application Market Report Scope and Research Methodology
Market Definition and Coverage
This market covers software-led insight-as-a-service applications that turn data into usable business insights through cloud delivery. It includes platforms and application layers used for descriptive, predictive, and prescriptive insights across common enterprise functions.
Scope exclusions: It does not count general IT infrastructure, raw data brokerage, or standalone consulting projects that are not delivered as a recurring application service.
Segments Covered in This Report
- By Deployment Mode
- Public Cloud
- Private Cloud
- Hybrid Cloud
- By Service Type
- Predictive Insights
- Descriptive Insights
- Prescriptive Insights
- By Application
- Customer Life-Cycle Management
- Revenue Cycle Management
- Branding and Marketing Insights
- Strategy Management
- Supply-Chain Optimization
- Other Applications
- By Organization Size
- Large Enterprises
- Small and Medium Enterprises
- By End-user Industry
- BFSI
- IT and Telecom
- Healthcare
- Retail and E-Commerce
- Manufacturing
- Energy and Utilities
- Other End-user Industries
- By Geography
- North America
- United States
- Canada
- Mexico
- South America
- Brazil
- Argentina
- Rest of South America
- Europe
- Germany
- United Kingdom
- France
- Italy
- Spain
- Rest of Europe
- Asia Pacific
- China
- Japan
- India
- South Korea
- Rest of Asia Pacific
- Middle East and Africa
- Middle East
- Saudi Arabia
- United Arab Emirates
- Turkey
- Rest of Middle East
- Africa
- South Africa
- Nigeria
- Kenya
- Rest of Africa
- Middle East
- North America
Data Sources, Market Sizing, and Validation
Desk Research
Desk work starts by mapping what gets sold as insight applications and where spending shows up in public records, so our model stays aligned with real commercial behavior. We review sources such as the US Census Bureau and Bureau of Economic Analysis for digital services signals, and the International Telecommunication Union for cloud and connectivity indicators that influence adoption.
To keep assumptions realistic, we also use materials such as SEC filings, investor presentations, product documentation pages, and earnings call transcripts to understand pricing logic, contract durations, and bundling patterns. Additional checks come from sources such as the OECD digital economy work and World Bank macro series for demand context, along with peer reviewed research on analytics and AI adoption. Where needed, paid subscriptions that compile company financials, news and financials, and patent databases are used to cross-check revenue exposure and product positioning. These examples are not exhaustive, and many other public sources were also referenced to collect data, validate inputs, and clarify open questions.
Primary Interviews and Surveys
Primary discussions are used to confirm how customers buy insight applications, which use cases are prioritized, and how cloud deployment choices affect pricing and renewal behavior. We speak with a mix of application providers, system integrators, and enterprise users across major regions, so assumptions on penetration, average contract values, and usage based expansion can be adjusted before final sizing.
Distribution of primary research fieldwork respondents
| Company type | Respondent position | Region |
|---|---|---|
| Top tier: 31% | CXOs: 13% | APAC: 45% |
| Mid tier: 55% | Functional/Unit leaders: 29% | EMEA: 35% |
| Smaller Players: 14% | Managers: 58% | Americas: 20% |
Market-Sizing & Forecasting
Sizing begins with a top-down build where overall cloud and analytics spending signals are translated into a demand pool for insight applications using adoption and attach-rate assumptions by industry and company size. Once the demand pool is shaped, we corroborate totals with selective bottom-up approximations, such as sampled price points by deployment mode, typical contract terms, and volume proxies from channel checks. We then adjust outputs when overlaps or gaps are found.
Key inputs used in the model include cloud deployment mix (public versus private or hybrid), the share of demand tied to core applications like customer life-cycle management and supply-chain optimization, organization size split (large enterprises versus SMEs), and the pace of AI feature adoption that changes value per user over time. We also track pricing motions like usage based expansion and seat growth, since these affect average revenue per account and churn sensitivity. Forecasting is mainly done through scenario analysis supported by trend checks on cloud migration timelines and buyer budget priorities that were consistently heard in primary conversations. The final curve is then stress-tested against regional IT spending direction and enterprise software renewal patterns.
Data Validation & Update Cycle
Validation is done in layers so the market totals do not rely on a single data stream. We compare outputs against independent signals like cloud adoption indicators, enterprise software spending direction, and reported growth commentary, and then any large variances are traced back to inputs such as pricing steps, deployment mix, or regional weighting.
Before sign-off, the model is reviewed by another analyst. Questionable movements trigger re-checks of source notes and follow-up outreach to clarify what changed. Reports are refreshed annually, and interim updates are made when material events shift demand or pricing assumptions. Right before delivery, we run a final pass to ensure the newest public information and interview learnings are reflected in the numbers.
Mordor Intelligence's Insight As A Service Application Market Estimate Compared With Other Published Estimates
Published market sizes for insight-as-a-service applications can vary even when the topic looks similar, because the included application scope and the base year used for measurement are not always the same. Differences also come from how pricing is treated for subscriptions, usage based expansion, and bundled analytics features.
The main gap drivers in this market are usually whether adjacent categories like broader analytics platforms or professional services are counted, plus how regions are converted and timed in USD when exchange rates move. Another common difference is refresh cadence, since a model that re-checks cloud deployment mix and renewal behavior can land on a different current-year value than a model that uses older input ratios. When the scope is limited to insight applications across defined use cases and is tied to the 2026 base-year demand pool, the spread becomes easier to explain, which is the approach followed here by Mordor Intelligence.
Benchmark comparison
| Source | Market Size | Gaps in Research Methodology |
|---|---|---|
| Mordor Intelligence | USD 8.64 B (2026) | |
| Global Consultancy A | USD 7.26 B (2025) | Uses a different base year and a longer forecast window, and the scope is presented at the broader insights-as-a-service level, which can shift what is counted under applications versus adjacent analytics and enablement layers. |
| Industry Publisher B | USD 5.82 B (2024) | Anchors the series on an earlier base year and may capture a wider set of insight related services, so the 2024 value is not directly comparable to a 2026 application-focused estimate without re-basing and normalizing currency timing. |
Across the three figures, the differences mostly trace back to base-year selection and how tightly the application layer is separated from broader analytics or services. By keeping the inputs tied to clear adoption drivers, pricing mechanics, and region-level checks, we can explain the estimate in repeatable steps and reduce avoidable mismatch when users compare sources later on.


Key Questions Answered in the Report
How large is the insight-as-a-service application market in 2026?
The insight-as-a-service application market size is expected to reach USD 8.64 billion by 2026.
What CAGR is projected for insight-as-a-service platforms through 2031?
The market is forecast to expand at a 19.56% CAGR between 2026 and 2031.
Which deployment model is growing fastest?
Hybrid cloud deployments are advancing at a 20.24% CAGR as firms blend on-premise control with hyperscaler scale.
Why are prescriptive analytics gaining traction?
Companies adopt prescriptive tools to automate actions such as pricing and routing, enabling faster decisions and lowering manual modeling workload.
Which industry is expected to be the fastest-growing end user?
Healthcare is projected to post a 19.94% CAGR as value-based care requires real-time outcome analytics.
What regions are driving future demand?
Asia Pacific is set to lead with a 21.77% CAGR, propelled by national digital agendas and hyperscaler expansion.
Page last updated on:





