Market Overview
| Study Period | 2020 - 2031 |
|---|---|
| Base Year For Estimation | 2025 |
| Forecast Data Period | 2026 - 2031 |
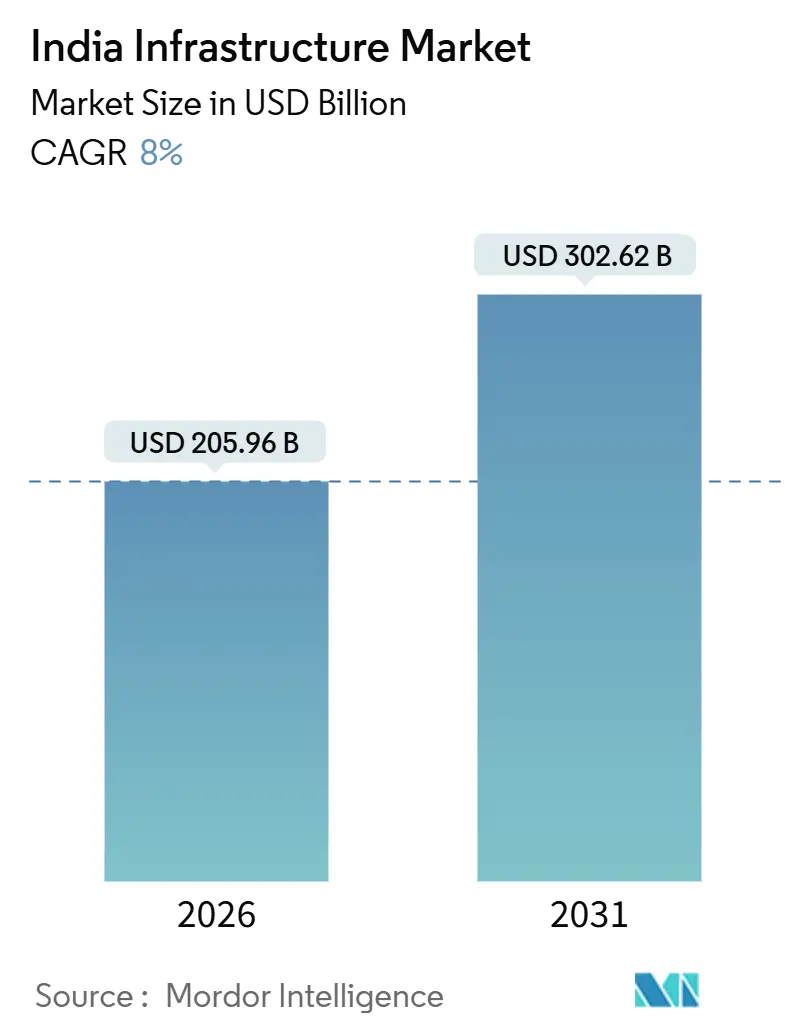
| Market Size (2026) | USD 205.96 Billion |
| Market Size (2031) | USD 302.62 Billion |
| Growth Rate (2026 - 2031) | 8.00% CAGR |
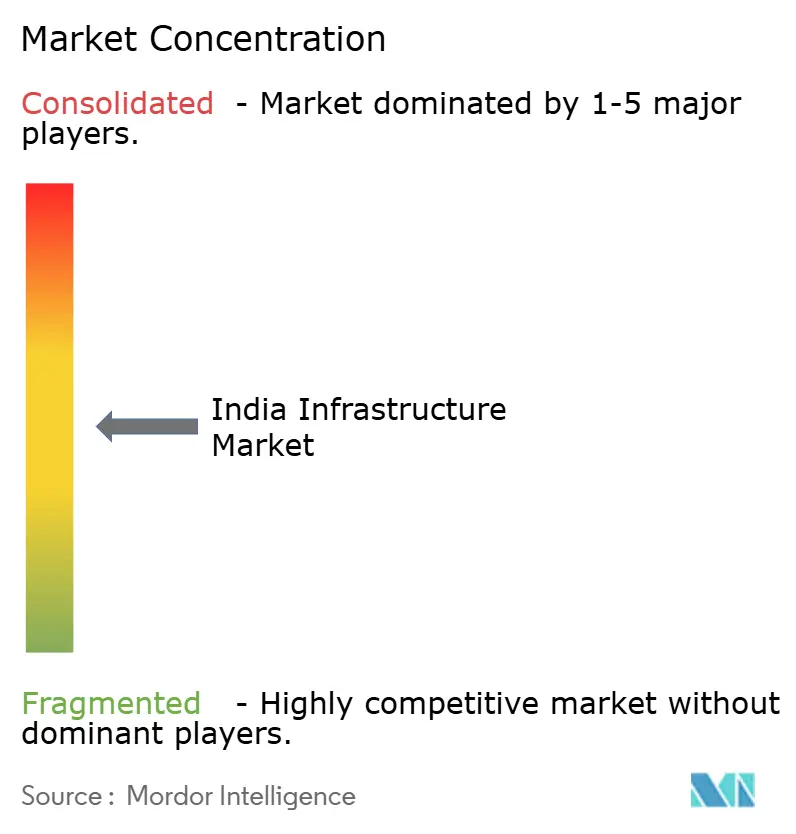
| Market Concentration | Medium |
Major Players *Disclaimer: Major Players sorted in no particular order Image © Mordor Intelligence. Reuse requires attribution under CC BY 4.0. | |
India Infrastructure Market Analysis by Mordor Intelligence
The India Infrastructure Market size is estimated at USD 205.96 billion in 2026, and is expected to reach USD 302.62 billion by 2031, at a CAGR of 8% during the forecast period (2026-2031).
Strong policy coordination, sovereign climate financing, and hyperscale computing demand underpin this expansion even as tighter environmental screens reshape funding flows. The transportation segment continues to anchor activity because expressways, metro corridors, and dedicated freight routes shorten travel times for manufacturers and commuters. Digital approval platforms now halve clearance cycles, which lowers interest costs for concessionaires and improves bid competitiveness. At the same time, sovereign green bonds reduce the cost of capital for metro rail and electric-vehicle charging networks. Rising private investment in operational assets created a deep secondary market that recycles public funds into greenfield projects. However, skilled-labor shortages and stricter ESG lending norms add friction, raising the execution burden on contractors.
Key Report Takeaways
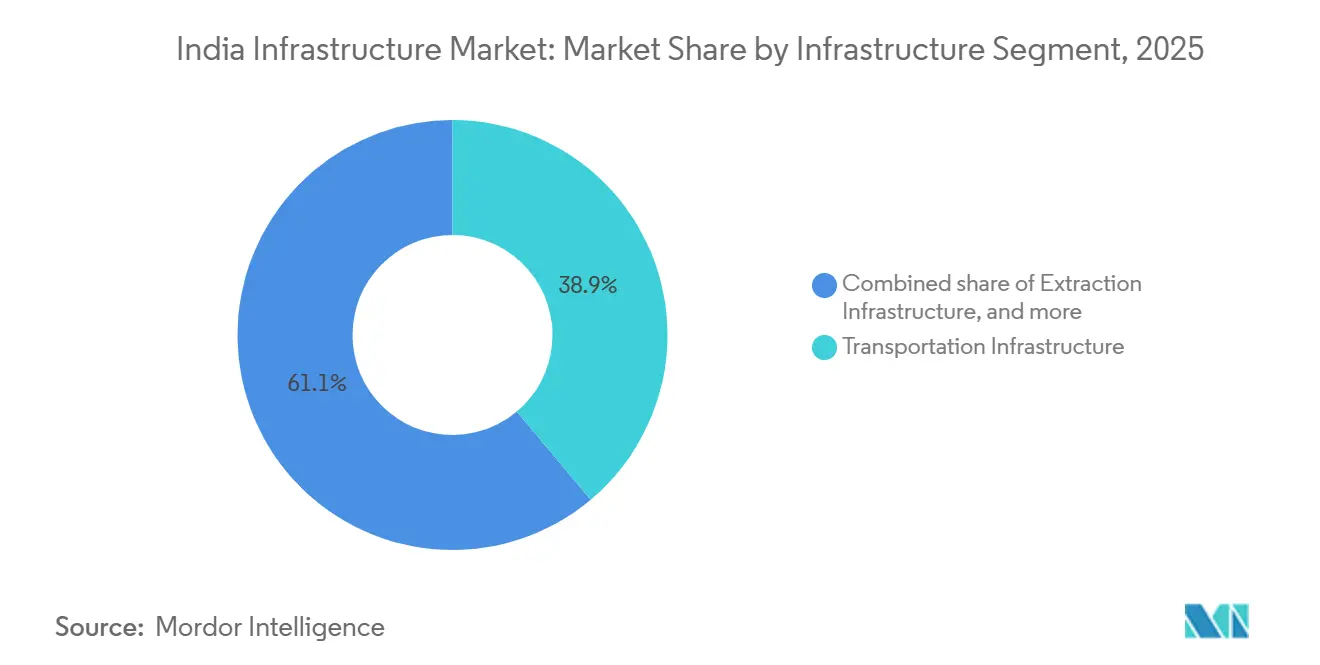
- By infrastructure segment, transportation infrastructure led with 38.89% of the 2025 India Infrastructure Sector market share, while utilities infrastructure is forecast to expand at a 10.09% CAGR through 2031.
- By construction type, new construction accounted for 79.79% of 2025 spending; renovation is advancing at a 9.79% CAGR to 2031.
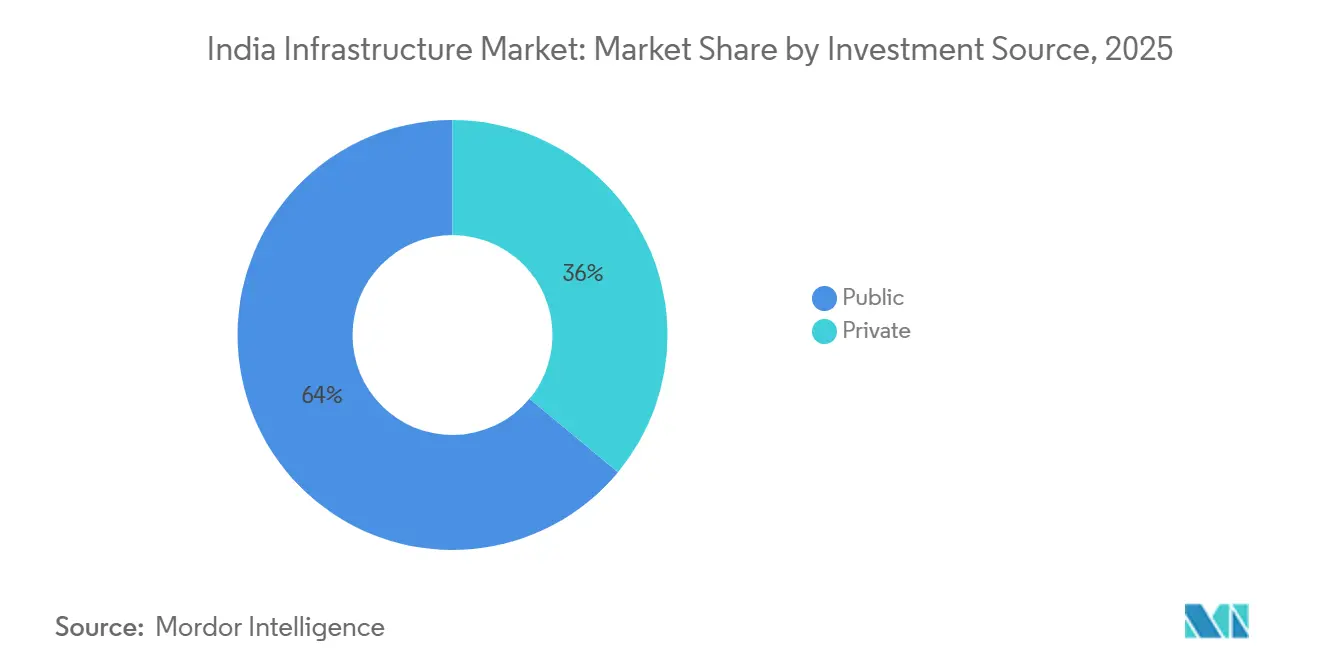
- By investment source, public entities controlled 63.99% of 2025 outlays, whereas private capital is projected to grow at a 10.59% CAGR through 2031.
- By key cities, the Mumbai Metropolitan Region held 15.59% of 2025 spending, while Hyderabad is set to grow at an 11.29% CAGR to 2031.
Note: Market size and forecast figures in this report are generated using Mordor Intelligence’s proprietary estimation framework, updated with the latest available data and insights as of January 2026.
India Infrastructure Market Trends and Insights
Drivers Impact Analysis
| Driver | (~) % Impact on CAGR Forecast | Geographic Relevance | Impact Timeline |
|---|---|---|---|
| PM Gati Shakti unified logistics platform shortens approval cycles | +2.1% | National, early gains in Delhi NCR and Mumbai MMR | Short term (≤ 2 years) |
| Hyperscale data-centre demand catalyzes renewable-powered parks | +1.9% | Hyderabad, Mumbai MMR, Chennai, Pune | Medium term (2-4 years) |
| Green Hydrogen Mission drives pipeline, port, and storage build-out | +1.8% | Coastal states and Rajasthan solar zones | Medium term (2-4 years) |
| Sovereign green bonds unlock low-cost capital for metro and EV proje | +1.5% | Tier-1 cities | Short term (≤ 2 years) |
| Second wave of airport privatization spurs regional EPC contracts | +0.9% | Tier-2 cities | Long term (≥ 4 years) |
| Source: Mordor Intelligence | |||
PM Gati Shakti Unified Logistics Platform Shortens Infrastructure Approval Cycles
The PM Gati Shakti digital portal overlays geospatial data from 16 ministries, enabling authorities to catch right-of-way conflicts before tenders are issued. By December 2025, the portal cut inter-ministerial clearance times for logistics parks from 18 to 9 months, which saved concessionaires significant interest during bid preparation[1]Ministry of Commerce, “Gati Shakti portal reduces clearance time,” economictimes.indiatimes.com. Faster clearances also lifted the share of highway projects reaching financial closure within 120 days to 87% in fiscal 2025, up from 62% two years earlier. The platform’s machine-learning module now flags parcels with overlapping agency claims, reducing arbitration filings by 30%. Adoption still hinges on state digitization of legacy land records because only 14 states had completed compatible cadastral surveys by mid-2025. Until lagging states catch up, highway mega-projects in Uttar Pradesh and Bihar remain prone to title disputes.
Surging Hyperscale Data-Centre Demand Catalyzes Renewable-Powered Industrial Parks
India’s installed data-centre capacity hit 1,100 MW in 2025, with 1,800 MW under construction to serve AI and cloud workloads[2]Telangana IT Department, “AI City master plan announced,” business-standard.com. Operators mandate 60% renewable energy, which drives co-location of data halls with solar parks and battery storage. Telangana allocated 12,000 acres for an AI City in 2025, complete with pre-approved clearances and 500 kV grid links, a USD 1.2 billion outlay that rapidly drew global cloud firms. Navi Mumbai’s Panvel node attracted USD 800 million because three submarine-cable stations lower the latency for global traffic. Water scarcity forces investment in closed-loop cooling and wastewater reuse systems, which raises capital intensity but ensures compliance with environmental norms.
Green Hydrogen Mission Drives Pipeline, Port, and Storage Infrastructure Build-Out
The National Green Hydrogen Mission targets 5 million t of annual capacity by 2030, triggering an estimated USD 100 billion of electrolyzer plants, renewable parks, and ammonia export terminals. Incentives worth USD 2.4 billion spurred Reliance, Adani, and NTPC to announce gigawatt-scale facilities along Gujarat’s Kutch coast and the Visakhapatnam cluster. These projects require high-voltage direct-current lines, desalination plants, and cryogenic tanks that create a near-term order pipeline for EPC firms. Paradip and Tuticorin ports awarded engineering contracts in 2025 for ammonia-cracking terminals aimed at Japan and South Korea, where carbon tariffs penalize gray hydrogen. Retrofitting natural-gas pipelines remains expensive at USD 1.2 million per kilometer, underscoring the demand for hydrogen-ready networks. Front-loaded spending concentrates 60% of capital outlays in 2025-2028, offering contractors sizable but time-bound opportunities.
Sovereign Green Bonds Unlock Low-Cost Capital for Metro and EV Charging Projects
Two sovereign green-bond tranches totaling USD 4 billion lowered borrowing costs for certified clean-transport projects by 80-100 basis points[3]Ministry of Finance, “Green bond framework execution update,” reuters.com. Delhi Metro raised USD 500 million at a 6.85% coupon for Phase IV, well below its 2022 rate. Bengaluru earmarked USD 300 million to deploy 5,000 fast chargers, making 15-minute access possible citywide. The bonds widened India’s investor base by attracting European pension funds and Japanese institutions that seek ESG-compliant assets. A third USD 3 billion tranche planned for fiscal 2026 will fund coastal-highway climate proofing, indicating policy commitment to scale the program.
Restraints Impact Analysis
| Restraint | (~) % Impact on CAGR Forecast | Geographic Relevance | Impact Timeline |
|---|---|---|---|
| Skilled-labor shortages spike wage bills during mega-project overlap | -0.9% | Tier-1 cities | Short term (≤ 2 years) |
| Tightening ESG financing norms restrict fossil-linked funding | -0.7% | Coal-belt states, thermal-power hubs | Medium term (2-4 years) |
| Source: Mordor Intelligence | |||
Skilled-Labor Shortages Amid Concurrent Mega-Projects Spike Wage Bills
Concurrent metros, expressways, and data-centre campuses lifted demand for certified carpenters, tunnel-boring operators, and high-voltage electricians beyond available supply. Daily wages for skilled rebar fixers in Bengaluru jumped 19% between January 2024 and December 2025, well above inflation. Only 12% of the construction workforce held formal certification in 2025, which curbed productivity gains from mechanization. Larsen & Toubro disclosed that labor costs rose to 22% of project expenses in fiscal 2025, from 18% two years earlier. Robotics reduced headcount on marquee projects, yet adoption remains uneconomical for contracts below USD 500 million, so the wage spiral is expected to persist into 2027.
Tightening ESG Financing Norms Restrict Funding for Fossil-Linked Projects
Reserve Bank guidelines on financed emissions prompted leading banks to cut thermal-power exposure by USD 4.2 billion in fiscal 2025. International financiers such as the Asian Development Bank withdrew from all fossil infrastructure in 2024, closing a USD 6-8 billion annual channel. The funding gap stalled coal-rail sidings in Jharkhand and Odisha, delaying Coal India’s plan to reach 1 billion t output. Contractors now pivot toward carbon-capture retrofits and mine-site solar plants, but legacy EPC players lack the specialized skills needed. Brownfield coal-plant expansions remain high risk despite shorter payback periods, underscoring the restraint’s persistence.
Segment Analysis
By Infrastructure Segment – Transport Dominance Sustains Momentum
Transportation infrastructure contributed 38.89% of 2025 spending, confirming its position as the largest slice of the India Infrastructure Sector market. The Bharatmala program’s USD 18 billion annual allocation and the near-completion of 2,843 kilometers of dedicated freight corridors shortened factory-to-port transit times, unlocking just-in-time logistics for automakers and electronics assemblers. On the urban side, USD 12 billion flowed into metro rail, including the 33.5-kilometer underground Mumbai corridor that demanded precise tunnel-boring beneath dense utilities. Expressway concessions employing hybrid-annuity models drew USD 6.5 billion of private equity in fiscal 2025, validating shared-risk frameworks.
Utilities infrastructure followed with 28% of spending as Power Grid’s USD 8 billion program linked western renewables to southern demand centers. Social segments such as hospitals and affordable housing commanded 18%, while extraction infrastructure slipped to 15% because ESG funding constraints slowed coal logistics. The India Infrastructure Sector market size attributed to transportation is projected to expand at a 10.09% CAGR through 2031, outpacing extraction yet just behind utilities, which gains from transmission links for green-hydrogen clusters. As corridors converge with multimodal nodes, mid-sized EPC firms specializing in high-voltage direct-current lines and bored tunnels are projected to win larger shares of upcoming bids.
Note: Segment shares of all individual segments available upon report purchase
Get Detailed Market Forecasts at the Most Granular Levels
Download PDF
By Construction Type – Renovation Rises as Assets Mature
New construction owned 79.79% of 2025 activity, but renovation is projected to post a 9.79% CAGR to 2031, slightly faster than greenfield growth. The National Highways Authority allocated USD 2.8 billion in fiscal 2025 for pavement and bridge rehabilitation that extends service life by more than a decade at one-third of replacement cost. Urban retrofits are also gathering pace; Mumbai committed USD 1.2 billion in 2025 to strengthen 47 century-old rail overbridges using seismic dampers. Delhi Metro invested USD 400 million in signaling upgrades that raised peak-hour frequency to 90 seconds.
The India Infrastructure Sector market share for renovation is expected to climb steadily as the National Monetisation Pipeline requires bidders to invest 15% of enterprise value in asset upgrades. Private operators prefer renovation because timelines run 18-24 months, minimizing exposure to land acquisition delays. Climate-resilience work, such as elevating coastal stretches in Kerala, is an emerging niche that accelerates the segment’s appeal. Despite the rise of renovation, greenfield projects remain indispensable in industrializing states where baseline connectivity gaps persist.
By Investment Source – Private Capital Broadens the Funding Base
Public entities supplied 63.99% of 2025 outlays, reflecting government dominance in mega-projects. The India Infrastructure Sector market size attributable to private players is set to grow at a 10.59% CAGR, powered by asset-monetization drives. The National Highways Authority raised USD 4.2 billion from 1,600 lane-kilometers of toll roads under the Toll-Operate-Transfer scheme, giving investors inflation-indexed cash flows. Hybrid-annuity projects totaling 3,200 kilometers attracted competitive bids from Dilip Buildcon and Ashoka Buildcon, showing that risk-sharing structures widen the pool of concessionaires.
Data-centre campuses form a pure-private wave; Adani Data Networks and Yotta Infrastructure committed USD 5 billion in 2025 without government support. New dispute-resolution frameworks featuring fast-track arbitration now shield private capital from lengthy litigation, enhancing confidence. As InvITs gain traction, secondary deals recycle capital at scale, which accelerates multiplier effects across the project pipeline.
Get Detailed Market Forecasts at the Most Granular Levels
Download PDF
Geography Analysis
Mumbai MMR commanded 15.59% of 2025 spending, driven by the Trans-Harbour Link, Coastal Road, and Metro Line 3, three mega-projects that together absorbed USD 18 billion. Their collective impact reduced island-city congestion and enabled Navi Mumbai International Airport, operational since 2024, to catalyze USD 6 billion in logistics villages and hotel districts. Monetization of the Mumbai-Pune Expressway raised USD 2.8 billion that will bankroll the Virar-Alibaug Multi-Modal Corridor and open fresh right-of-way for freight and commuters. Land scarcity and deep-tunnel costs temper MMR’s future growth, yet secondary projects around Panvel and Alibaug offer new momentum.
Delhi NCR ranks second by spend share, anchored by the 104-kilometer Metro Phase IV and the 82-kilometer Delhi-Meerut rapid-transit corridor. Noida’s logistics hub and data-centre park leverage proximity to the Dedicated Freight Corridor, drawing USD 4.5 billion in 2025. Completion of the Dwarka Expressway unlocked USD 8 billion in real-estate value, underscoring how road upgrades quickly translate into private-sector development. Planned corridors to Gurugram and Alwar are expected to boost the region’s ridership and freight volumes further.
Hyderabad leads on growth at an 11.29% forecast CAGR. Allocation of 12,000 acres for AI City, fast-track permitting, and a 500 MW renewable quota attract hyperscale investors. Metro Phase II will stretch the network to 148 kilometers, cutting transport emissions by 18% by 2030. The Hyderabad Growth Corridor promises four-hour trucking to Nagpur, expected to unlock USD 3 billion in pharmaceutical and electronics manufacturing by 2028. Strong governance and rapid approvals give the city an edge over legacy metros where clearances take longer and land is costlier.
Competitive Landscape
Competition is moderate; the top five EPC firms hold roughly 35% of order books. Larsen & Toubro pivoted toward metro and renewable-transmission contracts that now form 42% of its USD 30 billion fiscal-2025 inflow, exiting coal EPC as bank lending shrank. Tata Projects and Shapoorji Pallonji focus on metro rail and green-hydrogen terminals, where design-build models compress execution risk and improve working-capital cycles. Mid-tier contractors differentiate through specialized skills such as tunnel-boring or HVDC transmission, securing roles on projects where incumbents cannot scale.
Adani Ports pursues vertical integration. Its 28% share of container throughput in 2025, plus rights to develop Vadhavan port, positions it at the nexus of shipping, rail connectivity, and logistics parks. GMR’s modular terminal strategy at Goa’s Mopa airport showcased how phased capacity protects returns in demand-uncertain markets. Technology adoption widens the performance gap; Tata Projects used digital twins on Mumbai Metro Line 3, cutting rework by 22% and shortening schedules by eight months. Meanwhile, smaller firms struggle to finance BIM tools and advanced geotechnical surveys required by new Indian Roads Congress standards, accelerating industry consolidation.
White-space opportunities center on climate-resilient retrofits and battery storage. Contractors that invest early in falling-weight deflectometers, advanced pavement software, and hydrogen-ready metallurgy can win outsized shares as design norms tighten. With banks rewarding ESG-aligned portfolios, firms that shift from fossil-linked EPC to renewable and digital infrastructure stand to capture premium valuations.
India Infrastructure Industry Leaders
Larsen & Toubro Ltd
Tata Projects Ltd
Hindustan Construction Company Ltd
NCC Ltd
Shapoorji Pallonji Engineering & Construction
- *Disclaimer: Major Players sorted in no particular order
Need More Details on Market Players and Competitors?
Download PDF
Recent Industry Developments
- January 2026: Larsen & Toubro won a USD 4.2 billion contract for 237 kilometers of viaducts and seven mountain tunnels on the Mumbai-Ahmedabad High-Speed Rail corridor.
- December 2025: Adani Ports confirmed a USD 3.8 billion outlay for the Vadhavan deep-water port, adding 23.2 million TEU annual capacity by 2030 .
- November 2025: Tata Projects and Siemens Mobility launched a USD 620 million metro-rolling-stock plant in Savli with 300-car annual capacity.
- September 2025: Reliance Infrastructure and Brookfield acquired the Mumbai-Pune Expressway under a 30-year, USD 2.8 billion toll concession and pledged USD 420 million in upgrades.
Research Methodology Framework and Report Scope
Market Definitions and Key Coverage
Our study defines India's infrastructure sector as the yearly value of civil works and equipment installations across transportation networks, utilities, social assets, and extraction-related facilities, covering new builds as well as life-extending refurbishments. Investments tracked include engineering, construction, project-management fees, and commissioning but exclude land procurement and purely digital assets.
Scope exclusion: telecom towers, data-center fit-outs, and cloud facilities lie outside this valuation.
Segmentation Overview
- By Infrastructure Segment
- Transportation Infrastructure
- Utilities Infrastructure
- Social Infrastructure
- Extraction Infrastructure
- By Construction Type
- New Construction
- Renovation
- By Investment Source
- Public
- Private
- By Key Cities
- Mumbai Metropolitan Region
- Delhi NCR
- Pune
- Bengaluru
- Hyderabad
- Chennai
- Kolkata
- Ahemadabad
- Rest of India
Detailed Research Methodology and Data Validation
Primary Research
Mordor analysts held structured interviews with EPC contractors, PPP concessionaires, state transport engineers, and infrastructure fund managers spanning eight leading states. These discussions clarified realistic award pipelines, private-equity hurdle rates, and typical lead times, allowing us to plug data gaps found in secondary material.
Desk Research
We mined open-access datasets from the Ministry of Statistics and Programme Implementation, NITI Aayog dashboards, the Reserve Bank of India, and the National Highways Authority to map historic completions and public outlays. Union Budget books, state tender portals, and Construction Industry Development Council publications sharpened unit-cost and productivity benchmarks. Select insights from D&B Hoovers and Dow Jones Factiva enriched company-level views. The sources cited here are illustrative; many additional public records were reviewed to cross-check, validate, and archive estimates.
Market-Sizing & Forecasting
We begin with a top-down split of gross fixed capital formation, disaggregating it by sector using National Infrastructure Pipeline targets, city-level smart-mission budgets, and ministry capex plans. Supplier roll-ups of cement dispatches, steel demand, and project-finance sanctions provide bottom-up checks that fine-tune totals. Key model inputs include annual Union Budget capital outlay, PPP award rate, cost per lane-kilometer, metro rail route additions, and funds mobilized through InvITs. Forecasts rely on multivariate regression in which infrastructure spend is driven by GDP growth, fiscal headroom, and commodity cost indices. The resulting curves are stress-tested with scenario bounds validated by our primary experts.
Data Validation & Update Cycle
We run variance scans against high-frequency signals such as monthly steel shipments and EPC order books; anomalies trigger a re-check before sign-off. Reports refresh every twelve months, with interim updates issued when material policy or funding shifts occur, ensuring clients receive the latest calibrated view.
Why Mordor's Indian Infrastructure Baseline Commands Reliability
Published estimates often diverge because analysts pick different asset baskets, convert currencies on varied dates, or roll forward past trends without live primary touchpoints.
Key gap drivers include our clear exclusion of telecom and cloud assets, use of award-pipeline visibility rather than announced values alone, and an annual refresh aligned with Union Budget revisions. Other studies frequently lean on headline NIP totals or fixed escalation factors.
Benchmark comparison
| Market Size | Anonymized source | Primary gap driver |
|---|---|---|
| USD 190.7 B (2025) | Mordor Intelligence | - |
| USD 231 B (2024) | Global Consultancy A | Counts real-estate refurbishments; single-date FX conversion |
| USD 290 B (2025) | Industry Advisory B | Assumes full NIP spend realization; limited primary validation |
In sum, Mordor's disciplined scope setting, dual-path modeling, and continuous expert engagement deliver a balanced, transparent baseline that decision-makers can rely on when allocating capital.
Need A Different Region or Segment?
Customize Now
Key Questions Answered in the Report
What is the current value of the India Infrastructure Sector market?
The India Infrastructure Sector market is valued at USD 205.96 billion in 2026.
How fast is private capital growing in India’s infrastructure build-out?
Private investment is projected to rise at a 10.59% CAGR between 2026 and 2031 as operational asset monetization scales.
Which city is set to record the fastest infrastructure growth through 2031?
Hyderabad is forecast to expand at an 11.29% CAGR because of large data-centre and metro rail commitments.
Why is renovation spending gaining ground against new construction?
Renovation delivers asset-life extensions at one-third of reconstruction cost and has shorter execution timelines, driving a 9.79% CAGR outlook.


