
Industrial Asset Inspection Services Market Size and Share
Market Overview
| Study Period | 2021 - 2032 |
|---|---|
| Market Size (2027) | USD 45.82 Billion |
| Market Size (2032) | USD 66.64 Billion |
| Growth Rate (2027 - 2032) | 7.80 % |
| Fastest Growing Market | Asia-Pacific |
| Largest Market | North America |
| Market Concentration | Medium |
Major Players *Disclaimer: Major Players sorted in no particular order Image © Mordor Intelligence. Reuse requires attribution under CC BY 4.0. | |
Industrial Asset Inspection Services Market Analysis by Mordor Intelligence
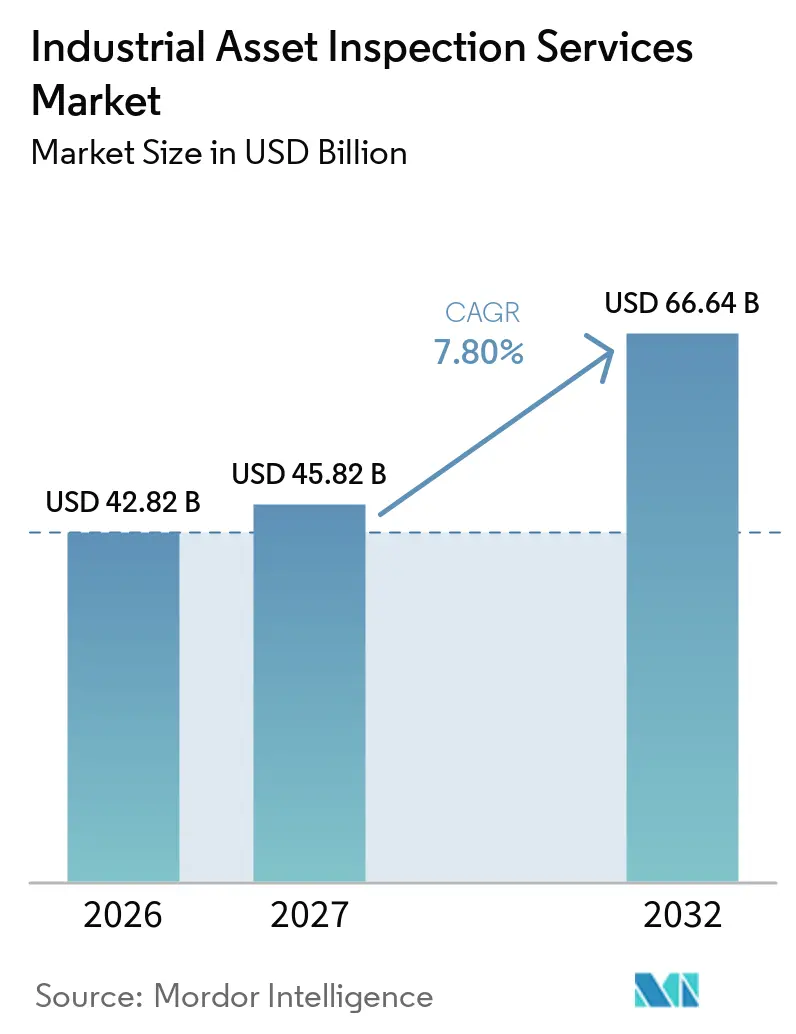
The Industrial Asset Inspection Services Market size was valued at USD 42.82 billion in 2026 and is estimated to grow from USD 45.82 billion in 2027 to reach USD 66.64 billion by 2032, at a CAGR of 7.80% during the forecast period (2027-2032).
Mandatory safety programs, aging facilities, and wider use of external inspection specialists support demand across process industries. Owners are extending the life of pipelines, pressure systems, and other critical equipment instead of replacing them, which increases the need for condition monitoring. The industrial asset inspection services market is also moving toward integrated contracts that cover several asset classes and maintain common digital records. Technology investment is separating larger providers from smaller regional firms, particularly where robotics, advanced ultrasonic testing, and digital reporting are required. This creates opportunities for renewable energy and grid assets, although service providers must manage differing standards and high access costs.
Key Report Takeaways
- By asset type, pipelines and piping systems held 23% of the industrial asset inspection services market share in 2026, while electrical and power equipment is projected to grow at a 9% CAGR through 2032.
- By end-use industry, oil and gas, refining, and petrochemicals held 29% of the industrial asset inspection services market size in 2026, while power generation, renewable energy, and electrical utilities are projected to grow at a 9.5% CAGR through 2032.
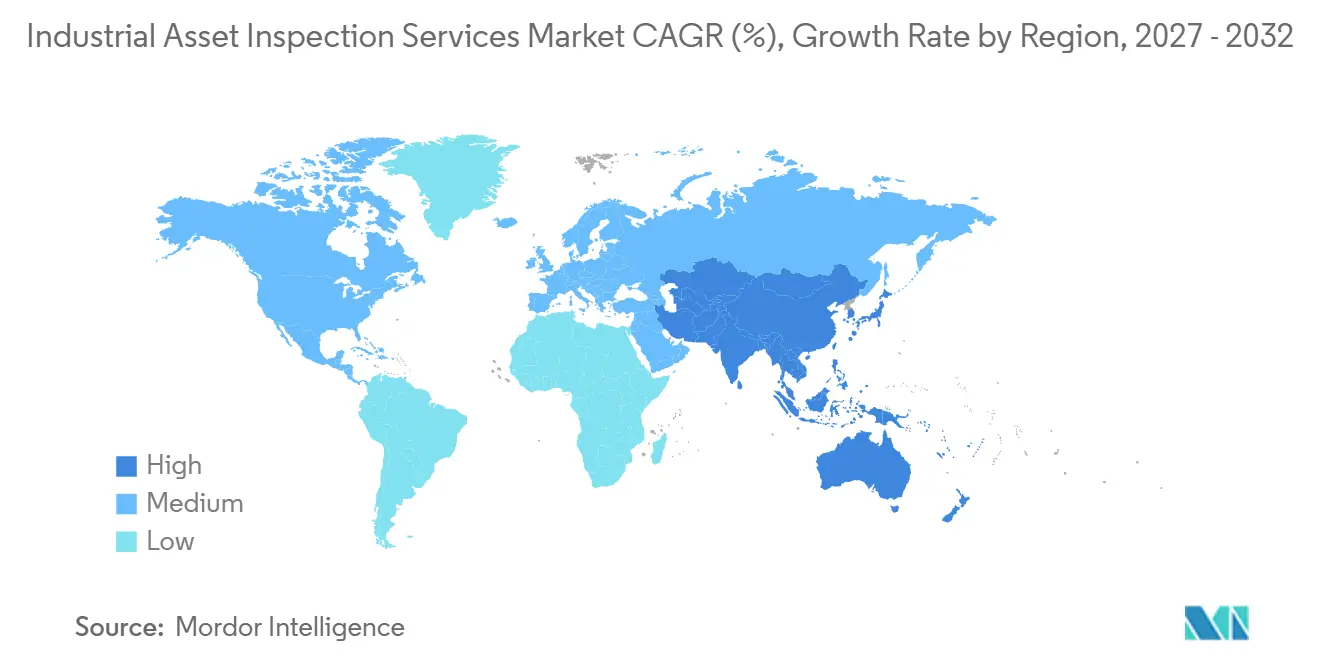
- By geography, North America held 32% of revenue in 2026, while Asia-Pacific is projected to grow at a 9% CAGR through 2032.
Note: Market numbers in this report are based on Mordor Intelligence's proprietary estimation framework, which combines nine months of actuals with Q4 projections for base year 2026.
Global Industrial Asset Inspection Services Market Trends and Insights
Drivers Impact Analysis*
| Driver | (~) % Impact on CAGR Forecast | Geographic Relevance | Impact Timeline |
|---|---|---|---|
| Aging Industrial Assets and Infrastructure Life-Extension Requirements | +2% | Global, highest intensity in North America and Western Europe | Long term (≥ 4 years) |
| Stringent Industrial Safety and Regulatory Compliance Requirements | +1.5% | North America, EU, GCC, with spill-over to Asia-Pacific and Latin America | Short term (≤ 2 years) |
| Rising Demand for Preventive and Risk-Based Inspection | +1.3% | Global, led by North America and the EU, and accelerating in the Middle East | Medium term (2-4 years) |
| Growing Outsourcing of Asset Integrity and Inspection Services | +1% | Global, most pronounced in Asia-Pacific and South America | Medium term (2-4 years) |
| Expansion of Energy, Process Industry, and Industrial Infrastructure Investments | +0.8% | Middle East, Asia-Pacific, and North America | Medium term (2-4 years) |
| Increasing Inspection Demand from Renewable Energy and Emerging Industrial Assets | +0.7% | EU, Asia-Pacific, and North America | Long term (≥ 4 years) |
| Source: Mordor Intelligence | |||
Aging Industrial Assets and Infrastructure Life-Extension Requirements
Aging pipelines, processing plants, and utility equipment provide a durable source of work for the industrial asset inspection services market. PHMSA stated in its May 2025 proposal that some hazardous-liquid pipeline repair provisions had not been substantially updated since 1981, showing the long operating history of both the assets and their inspection rules.[1] When owners extend an asset’s operating life, they need more frequent monitoring and clearer evidence that it remains fit for service. This work can continue even when industrial output weakens because it is linked to asset conditions rather than new construction. The market witnessed revenue growth among the 20 largest industrial service providers while German industrial production fell 1.1% in 2025. The industrial asset inspection services market therefore has a steadier demand base than equipment supply and engineering construction work.
Stringent Industrial Safety and Regulatory Compliance Requirements
Safety regulation remains a direct demand driver for the industrial asset inspection services market because owners need documented mechanical-integrity programs. OSHA’s Process Safety Management standard requires covered facilities to establish and implement written procedures for maintaining the ongoing integrity of process equipment.[2] API RP 581, released in its fourth edition, covers risk-based inspection methods for pressure equipment, piping, and storage tanks. These methods direct spending toward equipment with greater probability or consequence of failure, increasing the need for advanced assessments on critical assets. The framework also supports demand for accredited specialists who can prepare inspection records that withstand regulatory and insurer review.
Rising Demand for Preventive and Risk-Based Inspection
The shift from calendar-based inspection to risk-based inspection is increasing demand for specialized services in the industrial asset inspection services market. API RP 580 and API RP 581 guide operators to set inspection intervals based on the probability and consequence of failure, directing resources toward equipment with greater operational risk. This approach can reduce unnecessary examinations of lower-risk equipment while requiring more detailed assessments of critical pipelines, pressure vessels, storage tanks, and process piping. Higher-risk assets often need advanced techniques such as phased-array ultrasonic testing, computed radiography, and guided-wave ultrasonic testing. These methods require qualified personnel, validated procedures, and reliable digital records, which increases the value of each inspection engagement. As operators prioritize prevention of unplanned outages and safety incidents, demand is shifting toward providers that can combine field inspection, risk evaluation, and ongoing asset-integrity planning.
Growing Outsourcing of Asset Integrity and Inspection Services
The industrial asset inspection services market is growing as plant owners outsource specialized work rather than build every capability internally. Intelligent pigging, subsea vehicles, automated ultrasonic equipment, and digital data platforms require significant investment and trained personnel. Outsourcing gives owners access to these tools without carrying the cost of maintaining equipment fleets and technical teams between projects. It also supports independent verification in high-hazard applications where credible documentation is important. Bilfinger acquired Zentur.io’s digital platform in July 2026 to expand digital services for the energy sector, showing how leading service firms are linking inspection data with asset-management workflows. This approach makes the industrial asset inspection services market more favorable to providers that can connect field work, data analysis, and long-term planning.
Restraints Impact Analysis*
| Restraint | (~) % Impact on CAGR Forecast | Geographic Relevance | Impact Timeline |
|---|---|---|---|
| High Costs of Advanced Inspection Technologies and Specialized Access | -1.2% | Global, most acute in developing economies and fragmented regional markets | Long term (≥ 4 years) |
| Operational Downtime and Shutdown Scheduling Constraints | -0.9% | Global, particularly in refinery-intensive North America and the Middle East | Medium term (2-4 years) |
| Inspection Complexity in Hazardous and Hard-to-Access Environments | -0.7% | Offshore-heavy regions, including the North Sea, Gulf of Mexico, and Middle East offshore | Long term (≥ 4 years) |
| Varying Regulatory Standards and Inspection Requirements Across Countries | -0.5% | Cross-border operators, including multinational oil and gas and chemical companies | Medium term (2-4 years) |
| Source: Mordor Intelligence | |||
High Costs of Advanced Inspection Technologies and Specialized Access
High equipment and access costs can limit adoption in the industrial asset inspection services market, especially among small asset owners and local providers. OSHA requires mechanical-integrity programs to follow recognized and generally accepted good engineering practices, which can lead operators toward advanced methods and specialist expertise. Phased-array ultrasonic testing, automated testing, fitness-for-service analysis, and related methods need calibrated equipment and certified personnel. Offshore structures, elevated plant areas, and confined spaces can add rope access, scaffolding, or remotely operated vehicles before testing begins. PHMSA’s 2025 proposal recognized the burden that repair criteria may place on smaller operators. These costs favor larger providers but can slow the use of advanced methods in fragmented local markets.
Operational Downtime and Shutdown Scheduling Constraints
Operational constraints can limit the timing and scope of work in the industrial asset inspection services market. Inspection of pressurized equipment may require a partial or complete shutdown, while refiners commonly concentrate major inspection work during multi-year turnaround windows. PHMSA’s 2025 proposal asked whether risk-based intervals should be allowed for certain in-service atmospheric tanks, reflecting the scheduling challenges created by fixed inspection periods. The British Safety Council’s 2025 process-safety audit specification identifies shutdown management as an important area for review.[3] Offshore locations add weather, logistics, and safety restrictions, while multinational owners must also adjust to differing national rules. These factors can delay projects and raise delivery risk for both operators and inspection providers.
*Our forecasts treat driver/restraint impacts as directional, not additive. The impact forecasts reflect baseline growth, mix effects, and variable interactions.
Segment Analysis
By Asset Type: Pipelines Lead Revenue While Electrical Equipment Drives Growth
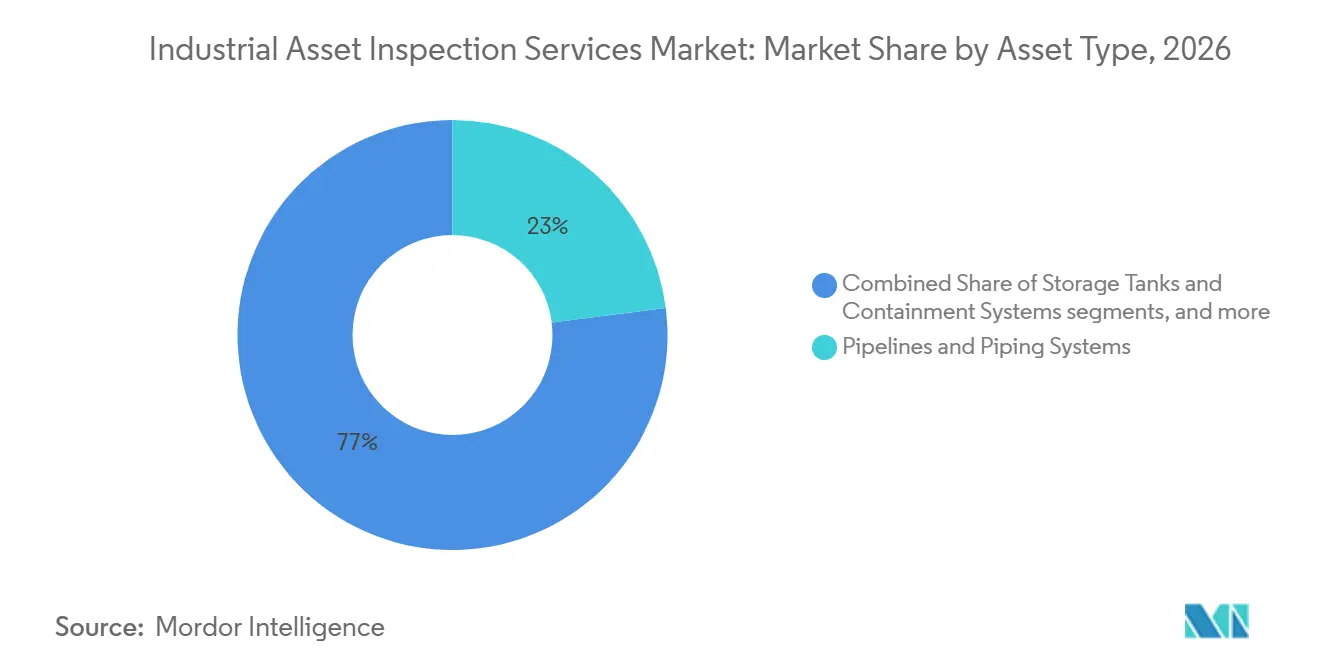
Pipelines and piping systems held 23% of the industrial asset inspection services market share in 2026. Their leading position reflects the need for recurring monitoring across oil, gas, industrial transmission, process, and utility networks. Operators use intelligent pigging, magnetic flux leakage, electromagnetic acoustic transducers, and other methods to map corrosion and characterize anomalies. Offshore pipelines, risers, and flowlines require specialized work and generally command higher service fees than onshore assets. Process piping and plant utility lines add a large volume of lower-complexity inspections. PHMSA’s pipeline safety activity continues to support systematic integrity management for hazardous-liquid and gas transmission systems.
Electrical and power equipment is projected to record a 9% CAGR through 2032, the fastest growth rate by asset type in the industrial asset inspection services market. Grid expansion, offshore wind substations, and aging transformer fleets are creating new work in partial-discharge analysis, thermography, high-voltage cable assessment, and switchgear inspection. This growth is less connected to commodity cycles than pipeline and refinery activity. Rotating equipment remains important because vibration-based monitoring supplements scheduled nondestructive testing on pumps, compressors, turbines, and conveyors. Storage tanks, containment systems, structures, and fixed plant assets also carry specific inspection obligations under API and ASME practices. Pressure vessels, boilers, and heat exchangers retain a recurring inspection base because statutory and safety requirements persist through changes in the energy mix.

By End-Use Industry: Hydrocarbons Provide Scale While Power Assets Expand Faster
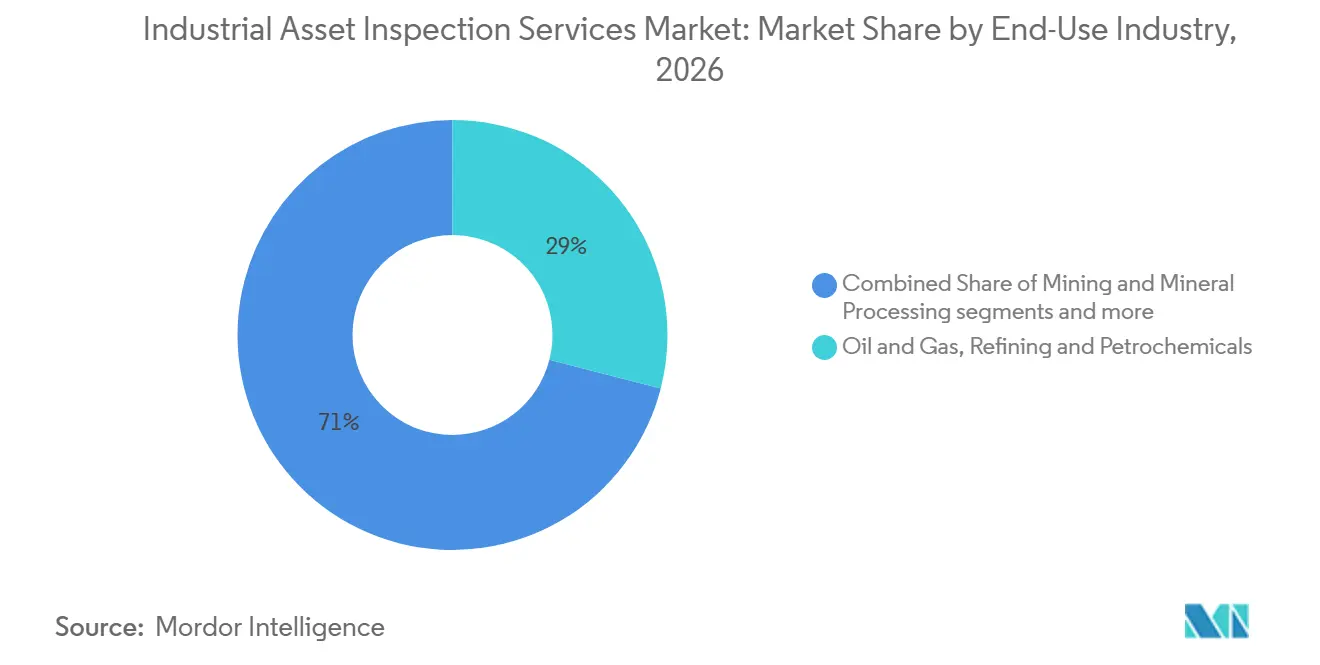
Oil and gas, refining, and petrochemicals accounted for 29% of the industrial asset inspection services market share in 2026. The segment relies on long-established mechanical-integrity practices for pressure vessels, piping, tanks, and related process equipment. High consequences of failure and formal inspection standards make spending per asset substantial in this end-use group. Saudi Arabia, the United Arab Emirates, and Qatar continue to combine hydrocarbon expansion with maintenance of established facilities. This supports contracts that cover both commissioning and recurring integrity programs. The industrial asset inspection services market retains a broad base in this segment even as new energy assets increase their role.
Power generation, renewable energy, and electrical utilities are projected to grow at a 9.5% CAGR through 2032. Offshore wind projects require inspection of marine structures, composite blades, and subsea cables, while grid investment increases the need for transformer and high-voltage equipment assessment. Service firms must adapt methods to asset types that do not always have the mature inspection protocols used in conventional process industries. Chemical manufacturing provides a meaningful base because of pressure equipment intensity and process-safety obligations. Metals, mining, water and wastewater utilities, pharmaceuticals, ports, and logistics sites add recurring work across structures, conveyors, clean environments, and storage facilities. This end-use diversity reduces dependence on any single commodity cycle within the industrial asset inspection services market.
Geography Analysis
North America held 32% of the industrial asset inspection services market share in 2026. The region combines a large base of aging process assets with regulatory requirements that support third-party inspection and integrity work. OSHA’s Process Safety Management framework requires covered facilities to maintain the integrity of process equipment through written procedures. PHMSA also provides national performance measures for the safety and reliability of pipeline transportation. MISTRAS was selected in December 2025 to provide nondestructive testing services for Woodside’s Louisiana LNG project, which has a stated USD 17.5 billion project value. These conditions support demand for advanced ultrasonic testing, digital radiography, and risk-based inspection services.
Europe has demand from mature offshore oil and gas assets, expanding offshore wind activity, and strict industrial safety rules. TÜV Rheinland reported EUR 3 billion (USD 3.5 billion) in 2025 revenue, up 9.7% from the prior year, while classical pressure-equipment and industrial-plant inspections remained among its core activities. TÜV SÜD reported that its industry segment grew 7.4% to EUR 1.2 billion (USD 1.4 billion) in 2025. European providers are extending their portfolios toward power and renewable-energy applications. The industrial asset inspection services market in the region therefore combines legacy maintenance needs with new asset classes. The approach favors providers that can work across both conventional plant systems and energy-transition infrastructure.
Asia-Pacific is projected to grow at a 9% CAGR through 2032. Greenfield commissioning, growing industrial capacity, and a maturing maintenance cycle underpin demand in the region. India’s refinery additions, South Korean petrochemical investment, and Australian LNG maintenance represent different sources of activity. The Middle East and Africa also benefit from hydrocarbon maintenance and investment linked to broader infrastructure diversification. South America contributes demand from Brazil’s deepwater assets and Argentina’s Vaca Muerta development. Across these regions, local access, accreditation, and specialized offshore or pipeline capability will affect provider selection.
Competitive Landscape
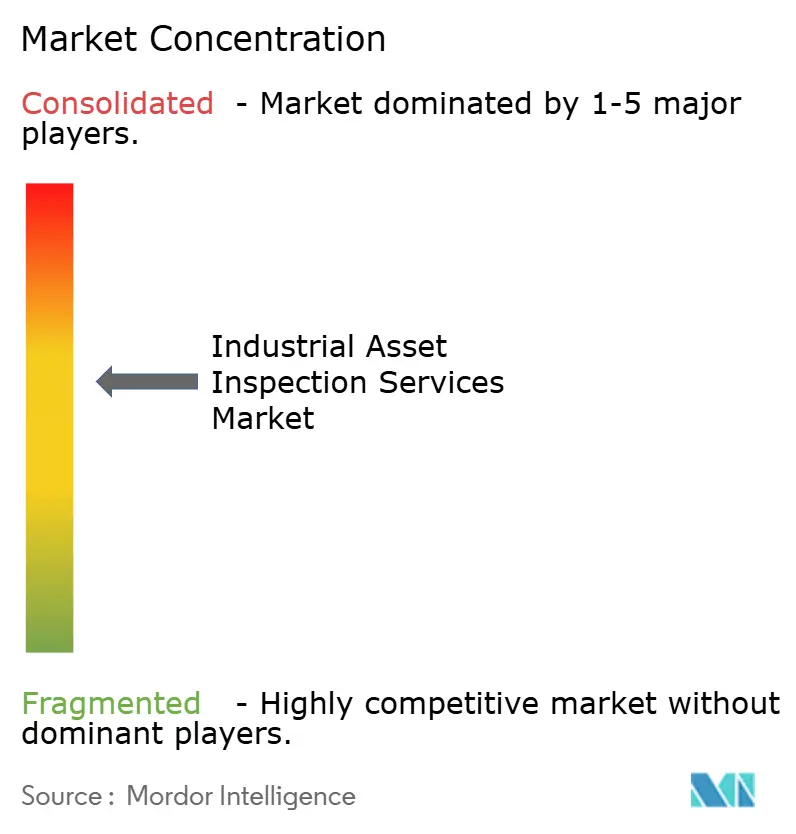
The industrial asset inspection services market exhibits a medium level of market concentration. SGS, Bureau Veritas, TÜV SÜD, and DNV hold strong positions with multinational customers that need broad technical coverage and consistent reporting. Regional firms often compete on local availability and day rates. Larger providers are strengthening their positions through acquisitions and digital service investment. SGS completed its acquisition of Applied Technical Services in January 2026 for USD 1.3 billion, adding 2,100 employees and 85 North American facilities. The transaction supports SGS’s stated aim to more than double North American sales by 2027.
Bureau Veritas acquired Lotusworks in April 2026, creating a EUR 300 million (USD 352.9 million) platform for mission-critical asset commissioning in data centers and semiconductor facilities. This move extends the company’s coverage into technology infrastructure where equipment reliability and commissioning controls are important. DNV’s 2026 Industrial Services unit focuses on digital capability across energy, infrastructure, and supply-chain inspection. Bilfinger’s work across bp’s North Sea assets uses robotics, artificial intelligence, and an integrated digital nondestructive testing workflow. These examples show how technology and long-term contracts can raise switching costs for customers. They also increase pressure on smaller firms that cannot fund comparable platforms.
The industrial asset inspection services market is likely to see continued consolidation because owners increasingly prefer providers that can cover several asset types under one contract. Integrated services can give customers a common asset record and reduce the effort involved in managing many vendors. However, regional providers remain relevant in locations where rapid mobilization, specialist access, or local regulation is decisive. The market also has a gap among mid-sized industrial operators that may be too small for major providers but require more digital and technical capability than local firms can offer. EQT’s recommended acquisition of Intertek, announced in 2026, adds another potential driver of acquisition activity among large inspection companies.
Industrial Asset Inspection Services Industry Leaders
-
SGS SA
-
Bureau Veritas SA
-
Intertek Group plc
-
Applus+
-
TÜV SÜD AG
- *Disclaimer: Major Players sorted in no particular order
Recent Industry Developments
- July 2026: Bilfinger acquired the digital platform of Zentur.io GmbH to expand its digital service portfolio for the energy sector, deepening the integration of inspection and condition data into connected asset management workflows.
- June 2026: EQT, alongside Luxinva and Mubadala as minority shareholders, reached a recommended final cash acquisition agreement for the entire share capital of Intertek Group plc, to be implemented via a court-sanctioned scheme of arrangement; completion is expected in Q4 2026 or Q1 2027, marking the first private equity ownership of a top-tier TIC major and likely to accelerate Intertek's industrial inspection acquisition agenda.
- April 2026: Bureau Veritas signed an agreement to acquire Lotusworks, a global leader in mission-critical assets commissioning for data centers and semiconductor manufacturing, creating a new EUR 300 million (USD 352.9 million) platform within the LEAP|28 strategy and extending the company's industrial inspection reach into high-growth technology infrastructure.
- March 2026: SPIE signed an agreement to acquire SGS Industrial Services Group, a provider of industrial inspection and maintenance services in Germany with EUR 180 million (USD 211.7 million) in 2025 revenues, expanding SPIE's industrial services range and creating cross-selling potential within its existing energy and logistics customer base.
Global Industrial Asset Inspection Services Market Report Scope
The Industrial Asset Inspection Services Market Report is segmented by Asset Type (Pipelines and Piping Systems, Pressure Vessels, Boilers and Heat Exchangers, and more), by End-Use Industry (Oil and Gas, Refining and Petrochemicals, Mining and Mineral Processing, Water and Wastewater Utilities, and more), and by Geography (North America, Europe, Asia-Pacific, and more). The Market Forecasts are Provided in Terms of Value (USD).
| Pipelines and Piping Systems | Oil, Gas and Industrial Transmission Pipelines |
| Process Piping and Industrial Utility Piping | |
| Offshore Pipelines, Risers and Flowlines | |
| Pressure Vessels, Boilers and Heat Exchangers | Pressure Vessels and Process Reactors |
| Industrial Boilers and Steam Systems | |
| Heat Exchangers and Pressurized Thermal Equipment | |
| Storage Tanks and Containment Systems | Aboveground and Underground Industrial Storage Tanks |
| Industrial Containment and Bulk Storage Systems | |
| Rotating and Mechanical Equipment | Pumps, Compressors and Industrial Turbines |
| Conveyors, Drives and Fixed Production Machinery | |
| Other Installed Mechanical Equipment | |
| Electrical and Power Equipment | Transformers, Switchgear and Power Distribution Equipment |
| Generators and Electrical Installations | |
| Power Transmission and Electrical Utility Assets | |
| Industrial Structures and Fixed Installations | Industrial Structural Steel and Equipment Supports |
| Offshore Platforms and Fixed Energy Installations | |
| Industrial Towers, Stacks and Supporting Structures | |
| Other Fixed Industrial Assets | Process Furnaces and Refractory Systems |
| Industrial Instrumentation and Control Installations | |
| Other Specialized Installed Industrial Assets |
| Oil and Gas, Refining and Petrochemicals |
| Power Generation, Renewable Energy and Electrical Utilities |
| Chemical Manufacturing (Excluding Petrochemicals) |
| Metals and Other Industrial Manufacturing |
| Mining and Mineral Processing |
| Water and Wastewater Utilities |
| Food and Beverage Processing |
| Pharmaceuticals and Bioprocessing |
| Transportation, Logistics and Port Operations |
| Other Industrial End Users |
| North America | United States |
| Canada | |
| Mexico | |
| Europe | Germany |
| United Kingdom | |
| France | |
| Italy | |
| Spain | |
| Netherlands | |
| Poland | |
| Turkey | |
| Russia | |
| Rest of Europe | |
| Asia-Pacific | China |
| Japan | |
| India | |
| South Korea | |
| Taiwan | |
| Australia | |
| ASEAN | |
| Rest of Asia-Pacific | |
| Middle East and Africa | Saudi Arabia |
| United Arab Emirates | |
| Qatar | |
| South Africa | |
| Egypt | |
| Nigeria | |
| Rest of Middle East | |
| Rest of Africa | |
| South America | Brazil |
| Argentina | |
| Rest of South America (Chile, Colombia, Peru, etc.) |
| By Asset Type | Pipelines and Piping Systems | Oil, Gas and Industrial Transmission Pipelines |
| Process Piping and Industrial Utility Piping | ||
| Offshore Pipelines, Risers and Flowlines | ||
| Pressure Vessels, Boilers and Heat Exchangers | Pressure Vessels and Process Reactors | |
| Industrial Boilers and Steam Systems | ||
| Heat Exchangers and Pressurized Thermal Equipment | ||
| Storage Tanks and Containment Systems | Aboveground and Underground Industrial Storage Tanks | |
| Industrial Containment and Bulk Storage Systems | ||
| Rotating and Mechanical Equipment | Pumps, Compressors and Industrial Turbines | |
| Conveyors, Drives and Fixed Production Machinery | ||
| Other Installed Mechanical Equipment | ||
| Electrical and Power Equipment | Transformers, Switchgear and Power Distribution Equipment | |
| Generators and Electrical Installations | ||
| Power Transmission and Electrical Utility Assets | ||
| Industrial Structures and Fixed Installations | Industrial Structural Steel and Equipment Supports | |
| Offshore Platforms and Fixed Energy Installations | ||
| Industrial Towers, Stacks and Supporting Structures | ||
| Other Fixed Industrial Assets | Process Furnaces and Refractory Systems | |
| Industrial Instrumentation and Control Installations | ||
| Other Specialized Installed Industrial Assets | ||
| By End-Use Industry | Oil and Gas, Refining and Petrochemicals | |
| Power Generation, Renewable Energy and Electrical Utilities | ||
| Chemical Manufacturing (Excluding Petrochemicals) | ||
| Metals and Other Industrial Manufacturing | ||
| Mining and Mineral Processing | ||
| Water and Wastewater Utilities | ||
| Food and Beverage Processing | ||
| Pharmaceuticals and Bioprocessing | ||
| Transportation, Logistics and Port Operations | ||
| Other Industrial End Users | ||
| By Geography | North America | United States |
| Canada | ||
| Mexico | ||
| Europe | Germany | |
| United Kingdom | ||
| France | ||
| Italy | ||
| Spain | ||
| Netherlands | ||
| Poland | ||
| Turkey | ||
| Russia | ||
| Rest of Europe | ||
| Asia-Pacific | China | |
| Japan | ||
| India | ||
| South Korea | ||
| Taiwan | ||
| Australia | ||
| ASEAN | ||
| Rest of Asia-Pacific | ||
| Middle East and Africa | Saudi Arabia | |
| United Arab Emirates | ||
| Qatar | ||
| South Africa | ||
| Egypt | ||
| Nigeria | ||
| Rest of Middle East | ||
| Rest of Africa | ||
| South America | Brazil | |
| Argentina | ||
| Rest of South America (Chile, Colombia, Peru, etc.) | ||
Key Questions Answered in the Report
What is the projected value of the industrial asset inspection services market in 2032?
The industrial asset inspection services market is projected to reach USD 66.6 billion by 2032, rising from USD 45.8 billion in 2027 at a 7.8% CAGR (2027-2032). Growth is supported by mandatory compliance activity, life-extension programs for aging equipment, and wider outsourcing of specialized integrity work.
Which asset category has the largest revenue position?
Pipelines and piping systems lead with 23% of 2026 revenue because they require recurring integrity monitoring across transmission, process, and utility networks. The work ranges from routine process-piping examinations to higher-value interventions on offshore pipelines, risers, and flowlines.
Which end-use segment is growing fastest?
Power generation, renewable energy, and electrical utilities are projected to grow at a 9.5% CAGR through 2032. Offshore wind structures, composite blades, subsea cables, transformers, and switchgear are expanding the need for specialists who can inspect newer asset types.
Why do industrial operators outsource inspection work?
Outsourcing provides access to advanced tools, certified staff, independent verification, and digital inspection records without maintaining all capabilities in-house. It is particularly relevant where intelligent pigging, remotely operated vehicles, automated ultrasonic equipment, and connected asset data systems are required.
Which region is growing fastest?
Asia-Pacific is projected to grow at a 9% CAGR through 2032 as new assets enter service and maintenance needs develop. India, South Korea, and Australia provide different sources of demand through refinery expansion, petrochemical investment, and LNG asset maintenance.
What constrains adoption of advanced inspection methods?
Technology, certification, access, shutdown, and cross-border compliance costs can limit adoption, especially for smaller owners and providers. These constraints become more significant in offshore, elevated, confined, or hazardous settings that require specialist access and more detailed safety planning.