Market Overview
| Study Period | 2020 - 2030 |
|---|---|
| Base Year For Estimation | 2024 |
| Forecast Data Period | 2025 - 2030 |
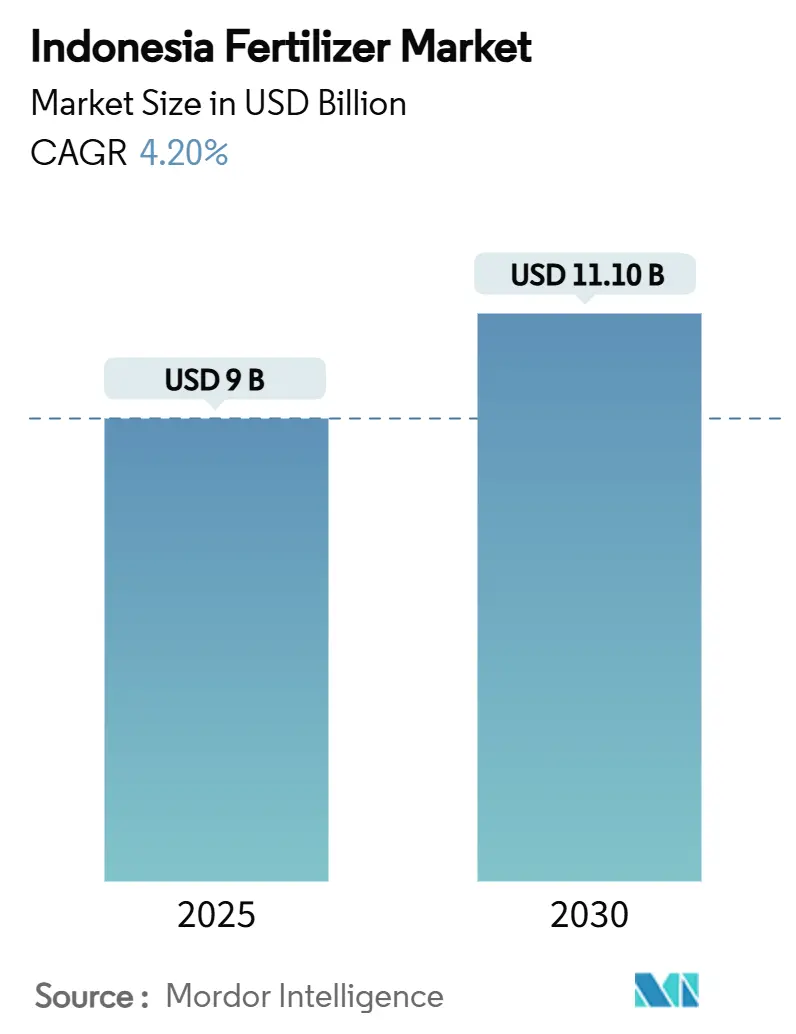
| Market Size (2025) | USD 9 Billion |
| Market Size (2030) | USD 11.10 Billion |
| Growth Rate (2025 - 2030) | 4.20% CAGR |
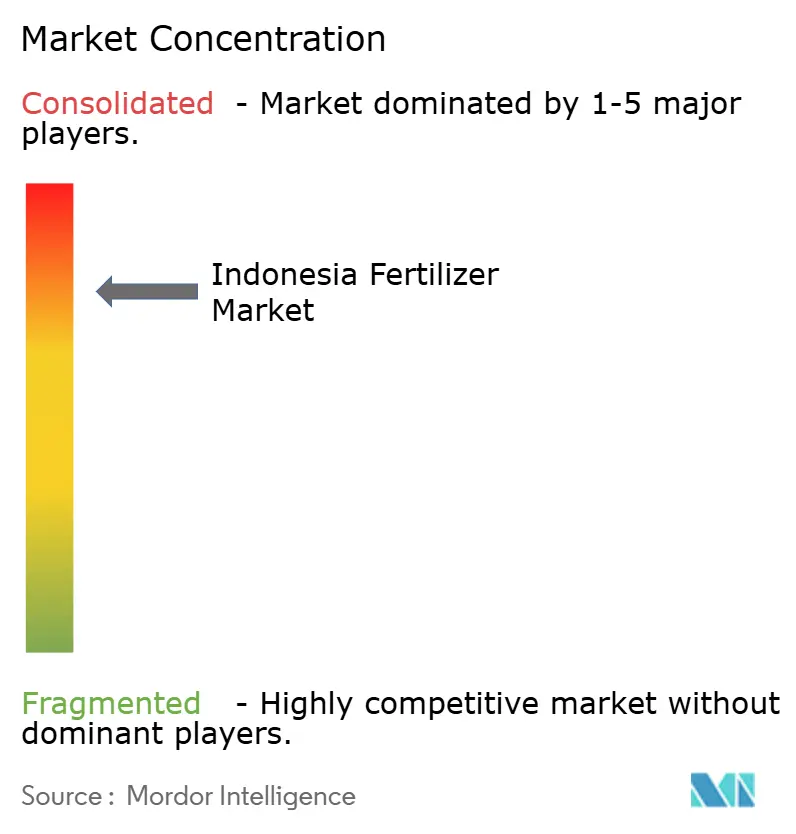
| Market Concentration | High |
Major Players
*Disclaimer: Major Players sorted in no particular order Image © Mordor Intelligence. Reuse requires attribution under CC BY 4.0. |
|
Indonesia Fertilizer Market Analysis by Mordor Intelligence
The Indonesia fertilizer market size stands at USD 9 billion in 2025 and is forecast to reach USD 11.1 billion by 2030, expanding at a 4.2% CAGR. Strong public funding for input subsidies and the replanting of aging oil-palm estates forms the backbone of demand across the Indonesia fertilizer market. A government allocation of 9.5 million metric tons of subsidized product under the Highest Retail Price scheme stabilizes consumption even when natural-gas prices spike, compressing producer margins. New NPK blending projects worth more than USD 1 billion enhance domestic value addition and keep the Indonesia fertilizer market on track to serve regional export demand. Competitive dynamics reflect extreme market concentration, with the top 5 companies, including PT Pupuk Kalimantan Timur (PKT), PT Petrokimia Gresik, Wilmar International Limited, PT Saraswanti Anugerah Makmur Tbk, and Agrifert Marketing Pte Ltd (Kuok Group), maintaining significant positions through integrated palm oil operations. This concentration creates both operational efficiency and strategic vulnerability, as supply disruptions from major producers can significantly impact national food security.
Key Report Takeaways
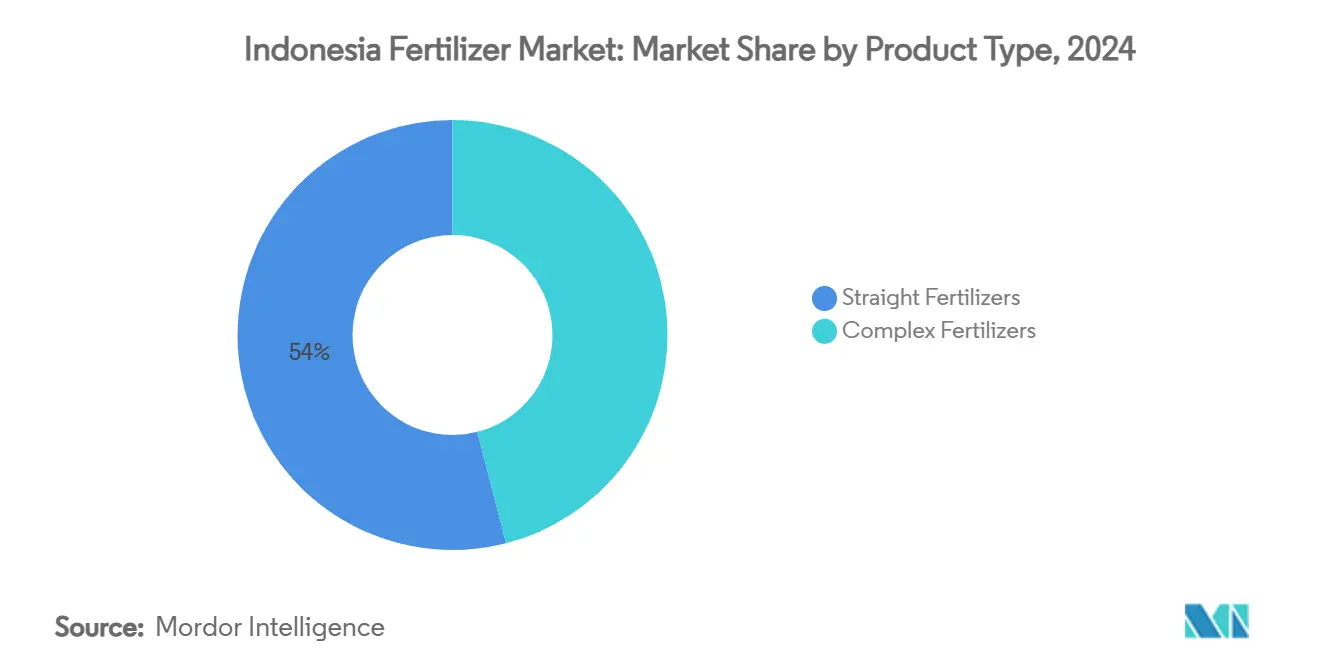
- By product type, straight fertilizers captured 54% of the Indonesia fertilizer market share in 2024. Micronutrient fertilizers are projected to expand at an 8.1% CAGR through 2030, making them the fastest-growing product category.
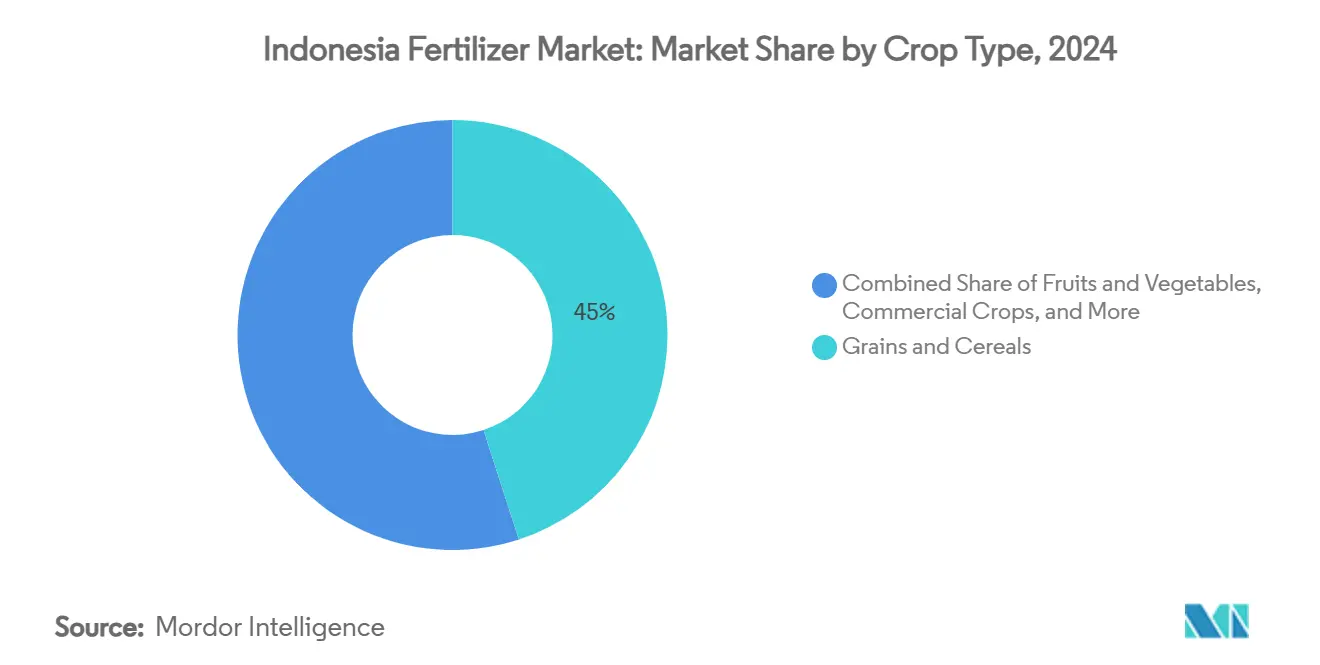
- By crop type, grains and cereals commanded 45% of the Indonesia fertilizer market share in 2024, and the fruits and vegetables are forecast to register the quickest growth at a 6.5% CAGR to 2030.
Indonesia Fertilizer Market Trends and Insights
Drivers Impact Analysis
| Driver | (~) % Impact on CAGR Forecast | Geographic Relevance | Impact Timeline |
|---|---|---|---|
| Government fertilizer subsidy (HET) expansion | +1.2% | Java, Sumatra, and Sulawesi | Medium term (2–4 years) |
| Rice and corn self-sufficiency programs | +0.8% | Java, Sumatra, and Kalimantan | Long term (≥ 4 years) |
| New NPK blending plants under Pupuk Indonesia | +0.6% | Java and Sumatra | Medium term (2–4 years) |
| Palm-oil plantation replanting cycle | +0.5% | Sumatra, Kalimantan, and Papua | Long term (≥ 4 years) |
| Growth in export-oriented horticulture needs specialty nutrients | +0.4% | Java, Sumatra, and Eastern regions | Medium term (2–4 years) |
| Early adoption of drone-based precision fertilization in Java | +0.3% | Java (early) then nationwide | Long term (≥ 4 years) |
| Source: Mordor Intelligence | |||
Government Fertilizer Subsidy (HET) Expansion
As per the Indonesian ministry, the 2025 budget earmarked 9.5 million metric tons of subsidized fertilizer, 4.6 million metric tons of urea, 4.2 million metric tons of NPK, and 500,000 metric tons of organic keeping prices at IDR 2,250/kg (USD 0.14) for urea and IDR 2,300/kg (USD 0.15) for NPK, levels far below commercial quotations[1].Source: BSIP Serealia Public Relations, “2024 Fertilizer Quota Rises to 9.55 Million Tons,” Ministry of Agriculture, serealia.bsip.pertanian.go.id This guaranteed volume underpins the Indonesia fertilizer market even as fiscal outlays approach USD 3.3 billion, roughly 2.8% of GDP. By linking deliveries to the e-RDKK farmer database, authorities minimize leakages and channel nutrients to priority crops. Suppliers also gain visibility on quarterly offtake, allowing smoother production scheduling and working-capital planning.
Rice And Corn Self-Sufficiency Programs
President Prabowo targets rice self-sufficiency by 2026 and corn self-sufficiency within three years, spurring wider adoption of balanced NPK over single-nutrient products across new cultivation zones in Sulawesi and Kalimantan. Higher planting density and double-cropping schedules lift per-hectare nutrient requirements, offsetting future efficiency gains from precision farming. Seed packages issued under the Kartini Tani program include fertilizer recommendations, nudging farmers toward integrated soil fertility management. Private distributors report that demand for zinc-enriched NPK has tripled in the eastern islands since mid-2024.
New NPK Blending Plants Under Pupuk Indonesia
Pupuk Indonesia is commissioning 2 million metric tons per year of extra NPK blending capacity, lifting national nameplate output to 14 million metric tons and cutting reliance on imports for complex formulations[2].Source: Sinta Ambarwati, “Pupuk Indonesia Reveals 2024 Production Capacity Reaches 14 Million Tons,” Antara News, antaranews.com. The new lines incorporate in-line coating systems that tailor micronutrient content by micro-region, an innovation that improves crop response and reduces wastage. Local sourcing of phosphate rock from Kalimantan further enhances the cost profile and shields the Indonesia fertilizer market from global freight volatility. Early offtake agreements indicate that 15% of incremental output could reach neighboring Association of Southeast Asian Nations (ASEAN) states by 2027.
Palm-Oil Plantation Replanting Cycle
Indonesian government funding for the People’s Oil Palm Rejuvenation program doubled to IDR 60 million (USD 3,750) per hectare, locking in predictable fertilizer demand during the three-year establishment phase of 180,000 hectares annually [3]Source: BSIP Serealia Public Relations, “Starting 1 January 2025, Subsidized Fertilizers Ready for Distribution,” Ministry of Agriculture, serealia.bsip.pertanian.go.id. Trials by PT Petrokimia Gresik show that chloride-free K-Mag blends boost early frond growth by 12% relative to muriate of potash, creating headroom for premium pricing. Estate managers are shifting from annual bulk purchases to trimester call-off contracts that stagger deliveries and smooth warehouse loads. Banks now bundle fertilizer credit lines into replanting loans, reinforcing consumption visibility through 2030.
Restraints Impact Analysis
| Restraint | (~) % Impact on CAGR Forecast | Geographic Relevance | Impact Timeline |
|---|---|---|---|
| Subsidy budget cuts creating supply gaps | −0.9% | Nationwide, outer islands worst hit | Short term (≤ 2 years) |
| Natural-gas price volatility raising urea costs | −0.7% | Nationwide production hubs | Medium term (2–4 years) |
| Proliferation of counterfeit fertilizers in informal channels | −0.4% | Rural Sumatra and Kalimantan | Medium term (2–4 years) |
| Environmental pressure on peatland nutrient runoff | −0.3% | Sumatra, Kalimantan peat zones | Long term (≥ 4 years) |
| Source: Mordor Intelligence | |||
Natural-Gas Price Volatility Raising Urea Costs
Regasified LNG now trades at USD 16.77 per MMBtu versus USD 6 under the previous subsidy, adding USD 50–70 to the cost of every metric ton of urea and squeezing margins for domestic manufacturers. Producers seek long-term gas contracts indexed to Brent-minus formulas to stabilize input costs. Several plants are evaluating carbon-capture linked blue ammonia pathways to unlock concessional finance and hedge against fossil fuel volatility.
Environmental Pressure on Peatland Nutrient Runoff
Heightened scrutiny of nutrient runoff and carbon emissions in peat ecosystems could impose stricter application caps, restraining demand growth in plantation-heavy provinces. Draft guidelines envisage mandating 30% organic matter incorporation and banning ammonium-based fertilizers during peak rainfall months. Plantation companies are piloting slow-release pellets and biochar blends that cut leaching losses by up to 40%, potentially absorbing some of the policy shock.
Segment Analysis
By Product Type: Nitrogenous grades hold the largest share
Straight fertilizers led with 54% of the Indonesia fertilizer market share in 2024, a position anchored by urea’s 60% slice of nitrogen volume and by the government’s HET-backed allocation of 4.6 million metric tons for the 2025 season. Abundant local ammonia feedstock keeps urea costs low, while wide dealer networks push product into remote rice and corn belts that consume the bulk of nitrogen inputs under the swasembada pangan plan. Calcium ammonium nitrate and ammonium sulfate fill soil-specific niches, and in-country ammonia synthesis largely feeds domestic demand, reinforcing leadership for nitrogenous grades within the Indonesia fertilizer market size.
Micronutrient fertilizers post the quickest climb, advancing at an 8.1% CAGR to 2030 as precision farming spreads from Java to Sumatra and supports export-oriented horticulture. Complex NPK sales also rise steadily because 2 million metric tons of new blending capacity lifts national nameplate output to 14 million metric tons, curbing reliance on imports and tailoring micronutrient coatings by micro-region. Phosphatic and potash grades remain exposed to freight swings because Indonesia imports almost all DAP, MAP, and MOP, while secondary nutrients gain traction in acidic soils across Kalimantan and Sumatra that limit long-term plantation yields.
Note: Segment shares of all individual segments available upon report purchase


By Crop Type: Grains and cereals dominate demand
Grains and cereals absorbed 45% of total nutrients in 2024, led by rice fields that alone consumed 40% of the Indonesia fertilizer market size across Java, Sumatra, and Sulawesi. Government goals of rice self-sufficiency by 2026 and a 48% year-on-year jump in corn harvests during Q1-2025 keep per-hectare application rates high at 250–300 kg, far above regional norms. Subsidies mute price sensitivity and lock in steady offtake, ensuring that grains remain the volume anchor for the Indonesia fertilizer market share.
Fruits and vegetables represent the fastest-growing use case, set to expand at a 6.5% CAGR through 2030 as premium export contracts justify 400–500 kg nutrient regimes and drive disproportionate impact on total value. Palm-oil estates continue to add steady tonnage through the People’s Oil Palm Rejuvenation program, which funds IDR 60 million (USD 3,750) per hectare of young plantings and keeps potassium and phosphorus pulls firm. Pulses and oilseeds record moderate gains, while turf and ornamental demand remains a niche tied to urban landscaping budgets in Jakarta and Surabaya.
Note: Segment shares of all individual segments available upon report purchase
Geography Analysis
Java consumed a significant portion of total nutrients in 2024, making it the single largest provincial cluster within the Indonesia fertilizer market. Dense irrigation networks, paved rural roads, and proximity to Surabaya and Jakarta ports compress freight spreads to only 5 percent above plant-gate quotations. The island’s double-rice seasons and rising vegetable exports further lock in steady urea and micronutrient pulls. Precision drone services emerge first here because mobile connectivity and farmer education levels are highest, accelerating the shift toward variable-rate blends.
Sumatra accounts for a major share of national offtake, powered by oil-palm estates that favor potassium-rich mixes and rice zones scattered across river plains. Fertilizer barging on the Musi and Siak rivers lowers logistics bills, but inland last-mile costs still push retail tags up by 15% over Java benchmarks. Potash cargoes land at Belawan and Dumai, then move by trucking convoys aligned with plantation replanting calendars, creating visible quarterly spikes in the Indonesia fertilizer market. Sulawesi’s share continues to rise on the back of hybrid corn adoption, while central cocoa groves switch to sulfate-based inputs that correct soil acidity.
Eastern Indonesia, including Kalimantan, Papua, Maluku, and Nusa Tenggara, represents the smallest yet fastest growing pool, adding 6–8% annually from a low base. Kalimantan’s transmigration farms and new oil-palm concessions generate predictable bulk orders, although peatland nutrient caps may temper long-run volumes. Papua’s upcoming USD 1 billion fertilizer complex at Fakfak will cut delivery lead times by 40 days once operational and expand coastal distribution to smallholder cassava and sago plots. Remote islands still face weather disruptions that inflate retail quotes by up to 25%, pushing authorities to test sea-tanker subsidy corridors to harmonize prices across the Indonesia fertilizer market.
Competitive Landscape
Indonesia’s fertilizer market shows a distinct high market concentration profile where the top five producers account for 84% of national volume and set the tone for pricing discipline and supply reliability. Indonesia's fertilizer market is oligopolistic, with the top five producers, PT Pupuk Kalimantan Timur (PKT), PT Petrokimia Gresik, Wilmar International Limited, Agrifert Marketing Pte Ltd (Kuok Group), and PT Saraswanti Anugerah Makmur Tbk, holding the largest share, while players focused on potash and diammonium phosphate cargos concede share to local blenders when global freight spikes widen landed-cost differentials.
Competition increasingly revolves around technology adoption rather than headline capacity alone. Pupuk Indonesia has partnered with Toyo Engineering and Itochu to build the GAIA (Green Ammonia Initiative) in Aceh, a hybrid electrolyzer and natural-gas setup that could shave 450,000 metric tons of carbon emissions each year once fully scaled. Yara International’s local subsidiary pursues a premium-service model in which agronomists conduct on-farm soil sampling and prescribe customized blends that command up to 18% pricing uplift over commodity grades. ICL Group concentrates on water-soluble and chelated micronutrients for greenhouse peppers and export-oriented mango orchards in West Java.
Mergers and listings are poised to reshape the field over the next five years. Pupuk Kaltim has initiated documentation for an initial public offering that would mark the first partial privatization inside the state fertilizer family and raise capital for a proposed USD 800 million brownfield expansion. Mergers and listings could strengthen loyalty and shield leading players from low-cost imports in the long term.
Indonesia Fertilizer Industry Leaders
-
PT Pupuk Kalimantan Timur (PKT)
-
PT Petrokimia Gresik
-
Wilmar International Limited
-
PT Saraswanti Anugerah Makmur Tbk
-
Agrifert Marketing Pte Ltd (Kuok Group)
- *Disclaimer: Major Players sorted in no particular order

Recent Industry Developments
- February 2025: Pupuk Kaltim stated its readiness for an initial public offering tied to state-owned enterprise restructuring, signaling new avenues for capital formation within the Indonesia fertilizer market.
- August 2024: Wilmar International posted a core net profit of USD 606.3 million for the first half, aided by an integrated fertilizer-to-biodiesel combination.


Indonesia Fertilizer Market Report Scope
Fertilizers are natural or artificial substances containing chemical elements that improve the growth and productivity of plants. Fertilizers enhance the soil's natural fertility or replace the chemical elements taken from the soil by previous crops. The Indonesia fertilizer market is segmented by type Complex, Straight (nitrogenous, phosphatic, potash, secondary nutrient, and micronutrients), crop type (grains and cereals, pulses and oilseeds, commercial crops, fruits and vegetables, and Turf and Ornamental crops). The report offers a market estimation and forecasts of the market size in value (USD ) and volume (metric ton) for all the mentioned segments.
By Product Type
| Complex Fertilizers | ||
| Straight Fertilizers | Nitrogenous Fertilizers | Urea |
| Calcium Ammonium Nitrate (CAN) | ||
| Ammonia | ||
| Ammonium Nitrate | ||
| Ammonium Sulfate | ||
| Other Nitrogenous Fertilizers | ||
| Phosphatic Fertilizers | Mono-ammonium Phosphate (MAP) | |
| Di-ammonium Phosphate (DAP) | ||
| Triple Super-phosphate (TSP) | ||
| Other Phosphatic Fertilizers | ||
| Potash Fertilizers | Muriate of Potash (MOP) | |
| Other Potash Fertilizers | ||
| Secondary Nutrient Fertilizers | ||
| Micronutrients | ||
By Crop Type
| Grains and Cereals |
| Pulses and Oil Seeds |
| Commercial Crops |
| Fruits and Vegetables |
| Turf and Ornamental Crops |
| By Product Type | Complex Fertilizers | ||
| Straight Fertilizers | Nitrogenous Fertilizers | Urea | |
| Calcium Ammonium Nitrate (CAN) | |||
| Ammonia | |||
| Ammonium Nitrate | |||
| Ammonium Sulfate | |||
| Other Nitrogenous Fertilizers | |||
| Phosphatic Fertilizers | Mono-ammonium Phosphate (MAP) | ||
| Di-ammonium Phosphate (DAP) | |||
| Triple Super-phosphate (TSP) | |||
| Other Phosphatic Fertilizers | |||
| Potash Fertilizers | Muriate of Potash (MOP) | ||
| Other Potash Fertilizers | |||
| Secondary Nutrient Fertilizers | |||
| Micronutrients | |||
| By Crop Type | Grains and Cereals | ||
| Pulses and Oil Seeds | |||
| Commercial Crops | |||
| Fruits and Vegetables | |||
| Turf and Ornamental Crops | |||


Key Questions Answered in the Report
What is the current value of the Indonesia fertilizer market?
The Indonesia fertilizer market size stands at USD 9 billion in 2025 and is forecast to reach USD 11.1 billion by 2030.
How concentrated is Indonesia’s fertilizer supply base?
The top five producers control 84% of national sales, including PT Pupuk Kalimantan Timur (PKT), which maintains the largest share, followed by Sister firm PT Petrokimia Gresik, Wilmar International Limited, Agrifert Marketing Pte Ltd (Kuok Group), and PT Saraswanti Anugerah Makmur Tbk.
What role do subsidies play in fertilizer demand?
Government subsidies cover 9.5 million metric tons a year, anchor baseline consumption, and keep farmer purchase prices well below global averages.
How are gas prices affecting local fertilizer producers?
A jump to USD 16.77 per MMBtu for regasified LNG has added up to USD 50-70 to each ton of urea, squeezing margins unless offset by green-ammonia investments.
Page last updated on:


