Market Overview
| Study Period | 2020 - 2031 |
|---|---|
| Forecast Data Period | 2026 - 2031 |
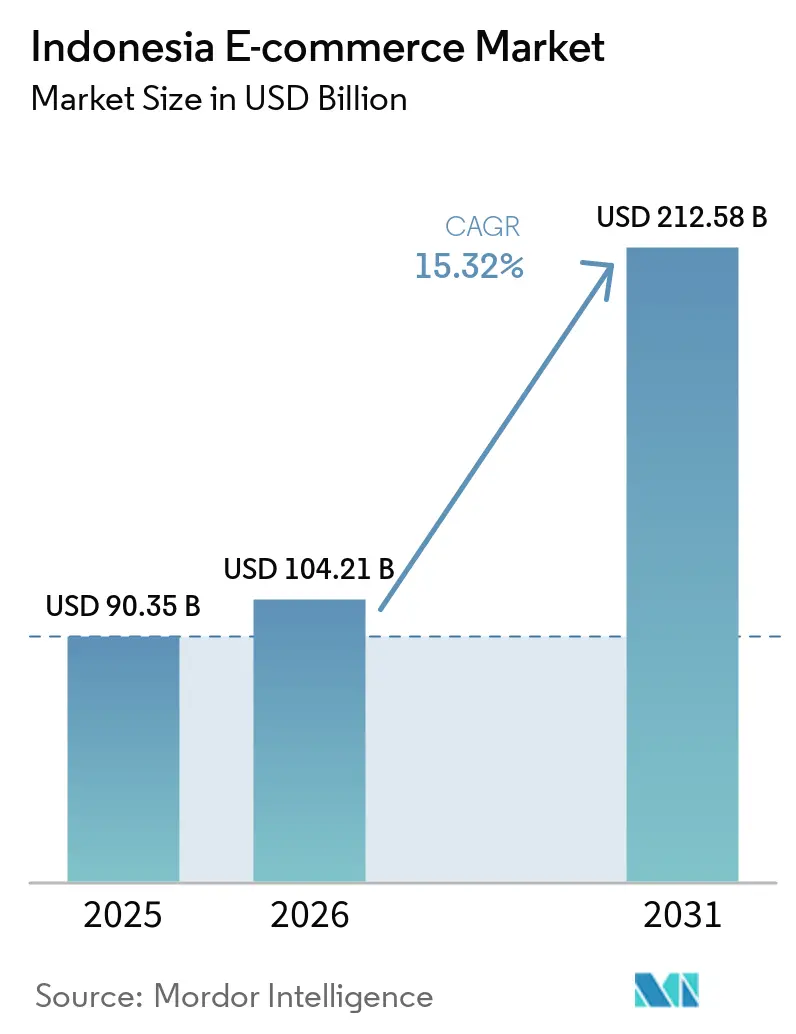
| Base Year Market Size (2025) | USD 90.35 Billion |
| Market Size (2026) | USD 104.21 Billion |
| Market Size (2031) | USD 212.58 Billion |
| Growth Rate (2026 - 2031) | 15.32% CAGR |
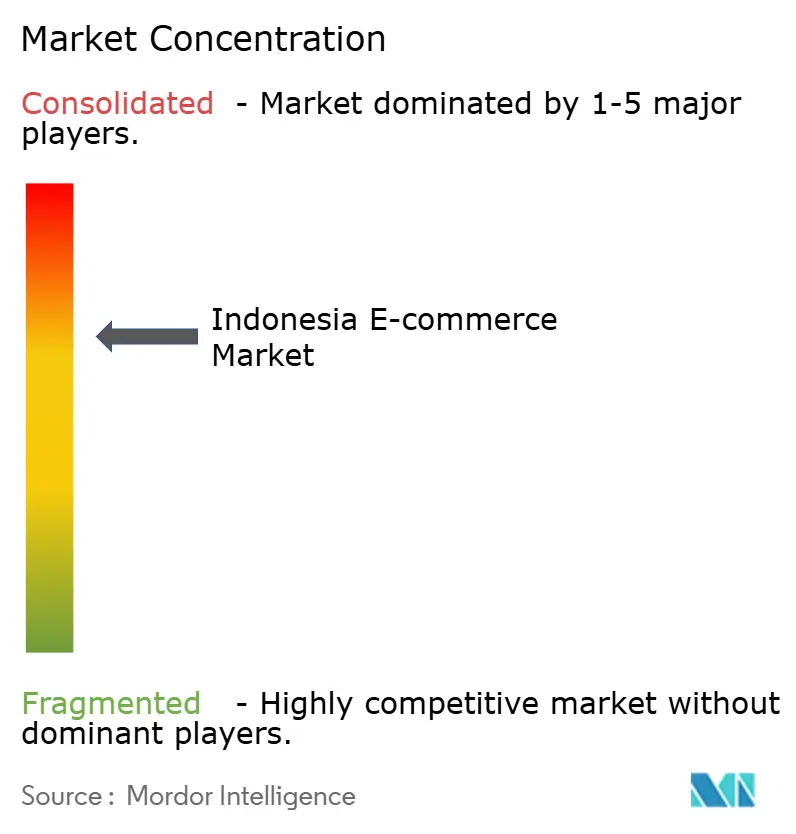
| Market Concentration | Medium |
Major Players *Disclaimer: Major Players sorted in no particular order Image © Mordor Intelligence. Reuse requires attribution under CC BY 4.0. | |
Indonesia E-commerce Market Analysis by Mordor Intelligence
The Indonesia e-commerce market size is expected to grow from USD 90.35 billion in 2025 to USD 104.21 billion in 2026 and is forecast to reach USD 212.58 billion by 2031 at 15.32% CAGR over 2026-2031. Smartphones, social commerce and fintech-enabled payments are raising transaction frequency and average order values, while government programmes accelerate the onboarding of micro-, small- and medium-enterprises. Consolidation among leading platforms is reshaping price competition and fulfillment standards. Live-stream shopping, quick-commerce grocery and cross-border offerings are widening revenue pools, yet data-localisation rules and Jakarta’s traffic restrictions elevate operating costs. Investors continue to fund logistics micro-hubs, embedded finance and cold-chain capacity to capture emerging white-space opportunities across outer islands.
Key Report Takeaways
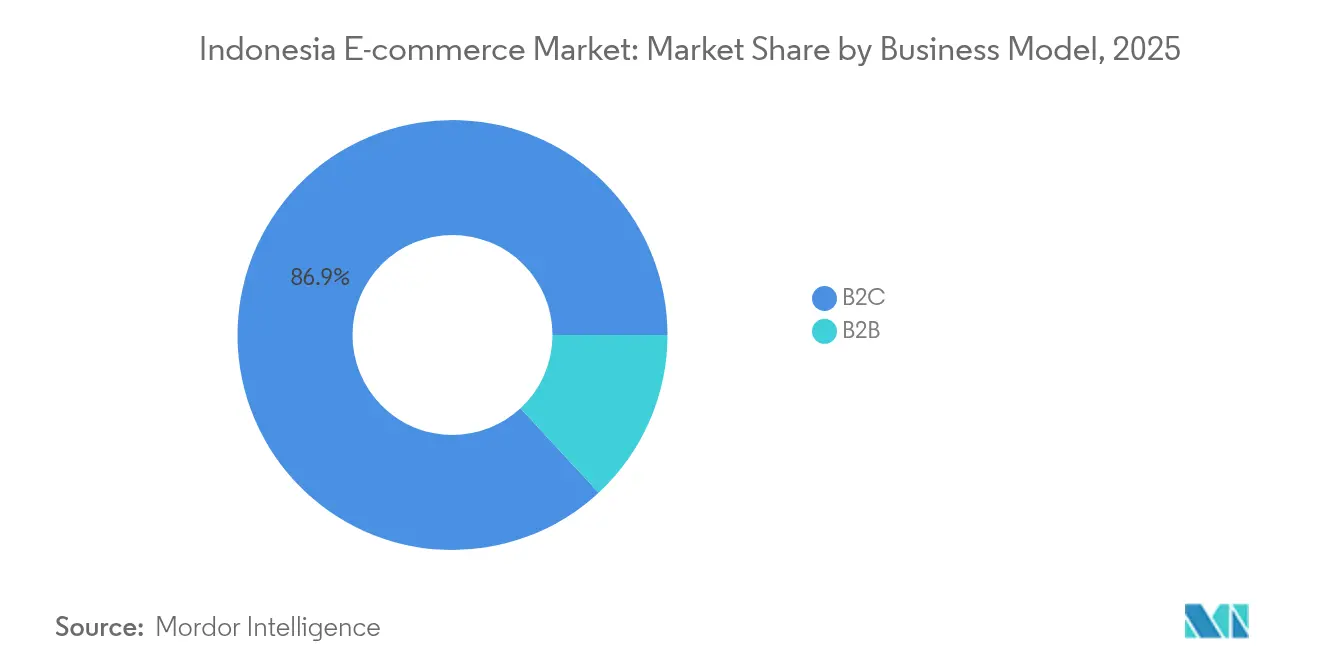
- By business model, B2C commanded 86.90% of Indonesia e-commerce market share in 2025; B2B is projected to expand at a 18.74% CAGR to 2031.
- By device type, smartphones captured 69.40% of Indonesia e-commerce market size in 2025 and are growing at an 18.38% CAGR.
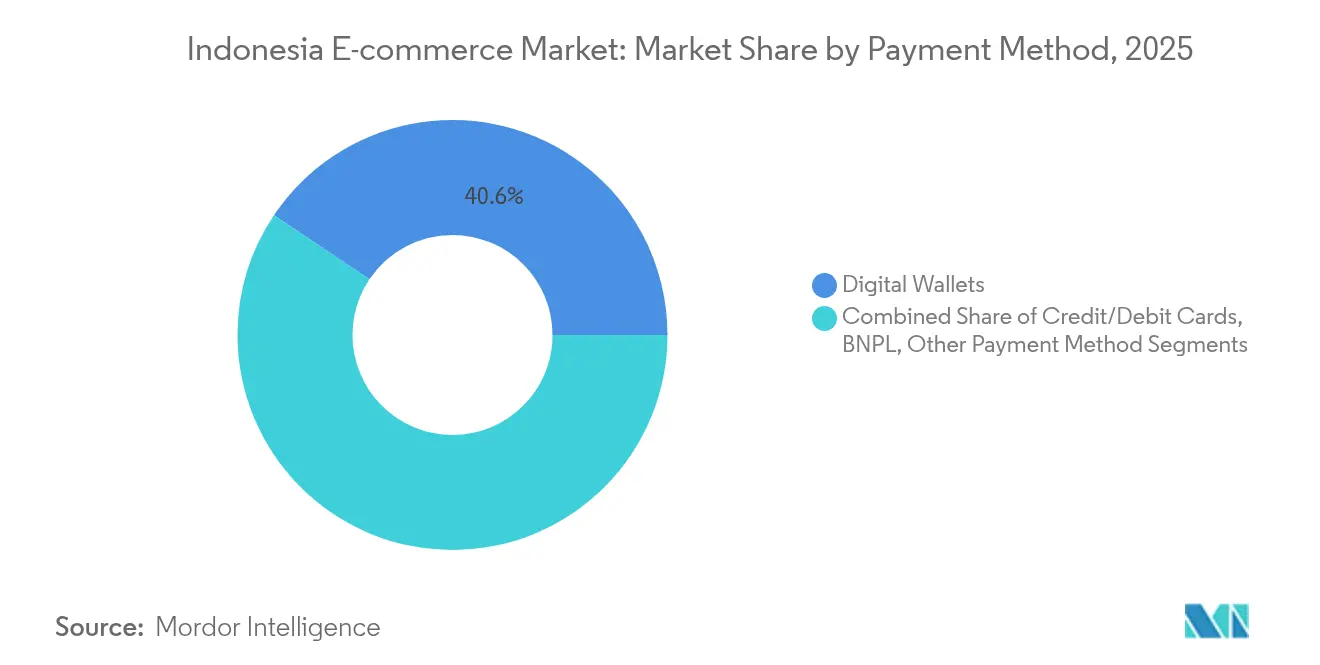
- By payment method, digital wallets led with 40.60% revenue share in 2025, while BNPL is advancing at a 27.10% CAGR through 2031.
- By B2C product category, consumer electronics held 24.60% of Indonesia e-commerce market size in 2025; food and beverages is the fastest-growing sub-sector at a 21.55% CAGR.
Note: Market size and forecast figures in this report are generated using Mordor Intelligence’s proprietary estimation framework, updated with the latest available data and insights as of 2026.
Indonesia E-commerce Market Trends and Insights
Drivers Impact Analysis*
| Driver | (~) % Impact on CAGR Forecast | Geographic Relevance | Impact Timeline |
|---|---|---|---|
| Surge in Live-stream Shopping Adoption on Mobile Apps | +3.2% | National, with higher impact in urban centers | Short term (≤ 2 years) |
| Rapid Digitisation of Tier-2/3 Cities via Logistics Micro-Hubs | +2.8% | Tier-2/3 cities across Indonesia | Medium term (2-4 years) |
| Fintech-Led Checkout ('PayLater') Boosting Average Order Value | +2.5% | National, with concentration in Java and Sumatra | Short term (≤ 2 years) |
| Government's 'Making Indonesia 4.0' SME On-Boarding Programmes | +1.9% | National, with emphasis on underdeveloped regions | Medium term (2-4 years) |
| Rising Cross-border Seller Participation via Singapore & China Gateways | +1.7% | National, with concentration in major urban centers | Medium term (2-4 years) |
| Social-Commerce Integration with WhatsApp & Instagram APIs | +1.4% | National, with higher adoption in urban areas | Short term (≤ 2 years) |
| Source: Mordor Intelligence | |||


Surge in Live-stream Shopping Adoption on Mobile Apps
Sixty percent of online buyers already purchase through live sessions, driving video commerce to 20% of online GMV in 2025 from less than 5% in 2022. Conversion rates average triple those of catalogue-based listings, reinforcing its role in customer acquisition and retention.[1]DHL Express Indonesia, “Growing Livestream Commerce in Indonesia,” dhl.com TikTok Shop leverages 22 million local active users and embedded payments to turn entertainment scrolls into impulse purchases, particularly among Gen Z who value peer validation. Brands pivot marketing budgets to creator partnerships and on-platform flash deals, while logistics players integrate real-time inventory feeds to support promised delivery windows. The format’s immediacy reduces return rates by showcasing product authenticity in real time.
Rapid Digitisation of Tier-2/3 Cities via Logistics Micro-Hubs
Tier-2 and tier-3 locations are expected to contribute 50% of the Indonesia e-commerce market by 2025, up from roughly 40% in 2021.[2]Michael Willy Roosevelt, “Logistics Transformation in Indonesia for the E-Commerce Market Industry,” Malaysian Journal of Industrial Technology, mjitechnology.com Operators such as JNE Express and TIKI deploy container-scale hubs closer to consumers, trimming last-mile distances and enabling next-day delivery beyond Java. Government infrastructure spending of IDR 400 trillion (USD 25.8 billion) accelerates road, port and air-cargo upgrades that underpin this model. Quick-commerce grocers benefit from shorter cold-chain routes, supporting the 22.4% CAGR in food and beverages. For sellers, the micro-hub network cuts shipping costs 12-18%, unlocking demand from newly banked households in provincial capitals.
Fintech-Led Checkout (‘PayLater’) Boosting Average Order Value
BNPL outpaces the Indonesia e-commerce market by ten percentage points, with an IDR 35.14 trillion (USD 2.27 billion) loan book and improving NPL ratios that fell to 3.21% in November 2024. One-third of Gen Z and millennials use PayLater at checkout, lifting average order values 30-50% across fashion and electronics. Platforms integrate proprietary scoring engines to approve instant credit, expanding addressable demand among the underbanked. Lenders partner with marketplaces to embed instalment promotions during mega-sale events, further raising cart sizes. As regulators tighten disclosure norms, transparent fee structures are expected to sustain consumer trust and portfolio quality.
Government’s ‘Making Indonesia 4.0’ SME On-Boarding Programmes
Nineteen million MSMEs already sell online under the initiative, driving QR payment adoption among 90% of 20.9 million merchants. Training through the Digital Entrepreneurship Academy raises product photography standards, automated inventory management and omni-channel marketing skills. Credit quotas earmarked at 30% of total bank lending channel fresh working capital into upgrading storefronts and logistics. The programmes reduce rural-urban digital divides, making social-commerce APIs accessible to informal traders. As MSMEs accumulate transaction histories, lenders deploy alternative data to underwrite affordable short-cycle loans, reinforcing the formalisation loop.
Restraints Impact Analysis*
| Restraint | (~) % Impact on CAGR Forecast | Geographic Relevance | Impact Timeline |
|---|---|---|---|
| Fulfilment Cost Inflation from Jakarta Traffic Restrictions | -1.8% | Jakarta metropolitan area, with ripple effects nationwide | Medium term (2-4 years) |
| Persistent Cash-on-Delivery Risk Elevating Return Rates | -1.2% | National, with higher impact in tier-2/3 cities | Short term (≤ 2 years) |
| Data-Localisation Rules Raising Cloud-Hosting Expense | -0.9% | National | Medium term (2-4 years) |
| Talent Shortage in Last-Mile Cold-Chain Logistics | -0.7% | National, with acute impact in eastern Indonesia | Long term (≥ 4 years) |
| Source: Mordor Intelligence | |||
Fulfilment Cost Inflation from Jakarta Traffic Restrictions
Odd-even licence rules and restricted freight hours add 30-45 minutes per journey and push last-mile costs up 20%. Time-sensitive categories such as ready-to-eat meals suffer deteriorating on-time performance, harming customer satisfaction metrics. To mitigate, major platforms lease peripheral warehouses, deploy electric motorbikes exempt from restrictions and pilot bicycle couriers for dense districts. These tactics require capital outlays that squeeze smaller sellers’ margins and may slow assortment expansion into perishables. Regulators plan phased freight corridors, yet near-term congestion remains a drag on delivery economics.
Persistent Cash-on-Delivery Risk Elevating Return Rates
COD still accounts for 10% of national transactions and shows return rates 2.5-3 times prepaid orders. High reversal costs erode profitability and distort inventory forecasts. The practice endures where banking penetration lags and trust in product authenticity remains low. Platforms respond with seller verification badges, in-app price guarantees and conditional COD fees to encourage digital payments. Wallet and PayLater incentives are gradually shifting behaviour, but full phase-out will require coordinated financial inclusion initiatives and improved dispute-resolution transparency.
*Our forecasts treat driver/restraint impacts as directional, not additive. The impact forecasts reflect baseline growth, mix effects, and variable interactions.
Segment Analysis
By Business Model: B2B Platforms Outpace Consumer Growth
The B2C segment led the Indonesia e-commerce market with an 86.90% share in 2025. Its scale is anchored in 215 million internet users but its growth moderates as urban penetration nears saturation. In contrast, the B2B vertical is forecast to compound at 18.74% annually, riding procurement digitalisation across 64 million MSMEs. Indonesia e-commerce market size for B2B transactions is expected to double between 2025 and 2030, propelled by tailored catalogues, deferred-payment terms and API links to enterprise resource planning. Platforms such as Ralali bundle bulk-discount engines and delivery scheduling, lifting switching costs for corporate buyers. Government procurement platforms and wholesaler digitalisation further catalyse adoption. Robust logistics corridors outside Java shorten restock cycles, making online sourcing economically superior to traditional wholesale trips.
Competitive intensity in B2B remains moderate, with fewer scaled players compared to B2C. Margins benefit from larger basket values and lower marketing spend per rupiah transacted. However, the service mandate is higher, demanding credit assessment tools and after-sales support. As marketplace data capture widens, embedded financing is likely to tip the economics decisively in favour of digital channels.


By Device Type: Mobile Commerce Anchors Transaction Growth
Smartphones accounted for 69.40% of Indonesia e-commerce market share in 2025 and will retain leadership, expanding at 18.38% CAGR on the back of 5G roll-outs and 94% smartphone penetration expected by 2030. App developers prioritise low-bandwidth design, single-page checkout and reward gamification to keep session durations high. Indonesia e-commerce market size derived from mobile orders is projected to surpass USD 155.6 billion by the end of the decade. Desktop remains relevant for high-ticket business procurement and complex travel bookings, yet its share inches down annually.
Second-screen behaviours see shoppers comparing prices on mobile while completing payment on laptop for large orders. Voice-assistant and smart-TV commerce are embryonic but gain visibility as broadband penetration widens. Feature-phone users in rural zones still rely on agent-assisted orders, underscoring the need for multi-channel customer service.
By Payment Method: BNPL Redefines Checkout Economics
Digital wallets processed 40.60% of transactions in 2025, cementing their status as the default tender. Indonesia e-commerce industry anticipates wallet dominance to persist, helped by improved QR interoperability. BNPL, however, is the standout disruptor, growing 27.10% per year and expected to capture 58% of Southeast Asia’s PayLater spend by 2025. Indonesia e-commerce market size for BNPL-funded sales is on track to exceed USD 46.8 billion in 2031. PayLater deepens customer lifetime value through instalment-specific promotions and loyalty tiers.
In Indonesia payments, the card payments segment hold roughly 32% share for premium segments, while bank transfers retain niche popularity thanks to perceived security and rebate programmes. Payment diversification obliges merchants to integrate multi-rail gateways and dynamic risk scoring to minimise fraud losses.
By B2C Product Category: Groceries Lead Incremental Growth
Consumer electronics maintained 24.60% share of Indonesia e-commerce market size in 2025, with smartphones and wearables driving volume. High average unit values mask lengthening replacement cycles, prompting platforms to bundle insurance and trade-in options. The food and beverages category, meanwhile, is the growth engine, expanding at 21.55% CAGR aided by quick-commerce and improved cold-chain. Indonesia e-commerce market share for online grocery reached 13% in early 2025 and is forecast to climb steadily as busy urban consumers favour scheduled delivery subscriptions.
Leveraging micro-fulfillment and AI-driven demand forecasting, sellers minimise spoilage and stockouts. Promotions tied to national shopping festivals convert trial users into weekly purchasers. Regulatory moves to streamline halal certification online will further unlock assortment depth in meat and dairy items.
Geography Analysis
Indonesia e-commerce market leadership within Southeast Asia rests on its 270 million population and rising connectivity, with internet penetration touching 79.5% in January 2024. Java still accounts for the majority of orders, yet its dominance eases as logistics corridors link Sumatra, Kalimantan and Sulawesi to new distribution nodes. Tier-2 and tier-3 cities are on track to generate half of national digital GMV by 2025, demonstrating the payoff from infrastructure outlays and provincial digital-skills programmes.
Cross-border trade is another geographic dimension. Indonesian shoppers engage heavily with sellers routed through Singapore and China, pushing cross-border GMV toward USD 120 billion by 2025. Fashion commands 61.7% of imported baskets, followed by electronics, driven by perceived value and assortment unavailable domestically. Shipping cost and customs clearance delays still hold demand back, prompting marketplaces to trial bonded-warehouse models near Batam and free-trade zones.
Eastern Indonesia remains under-penetrated but strategically important. Government smart-city pilots and incentives for data-centre builds seek to equalise service levels. Marketplace campaigns in Papua and Maluku include vernacular language interfaces and local seller recruitment to nurture ecosystem resilience. As undersea cable projects materialise, latency reductions will bolster live-stream and quick-commerce applicability in these frontier markets.
Competitive Landscape
Shopee, TikTok-Tokopedia and Lazada collectively hold more than 80% of Indonesia e-commerce market share, underpinning a moderately concentrated structure. Shopee leverages proprietary logistics and region-wide seller base to maintain 48% share, while TikTok-Tokopedia harnesses 110 million monthly users and live-shopping DNA following its USD 1.5 billion merger. Lazada differentiates through Alibaba’s cross-border sourcing network and enterprise seller tools.
Platform rivalry is intensifying around fulfillment speed and shopper engagement. Shopee’s USD 120 million micro-fulfillment roll-out into secondary cities targets 40% faster delivery times, whereas TikTok-Tokopedia pairs influencer discovery with one-click checkout to lift session conversion. Sustainability emerges as a branding axis, illustrated by Lazada mandating eco-friendly packaging with 50% cost subsidies to sellers.
Niche contenders pursue vertical depth. Ralali scales B2B procurement, Sirclo enables brand.com storefronts and Astro commands urban quick-commerce groceries. Meanwhile, Bukalapak’s retreat from physical goods to a digital-only model underscores margin pressures outside the top-tier trio. As data-localisation rules raise infrastructure hurdles, well-capitalised incumbents consolidate negotiating power with cloud vendors, widening the gap for new entrants.
Indonesia E-commerce Industry Leaders
Pt Bukalapak.com Tbk
Blibli (pt Global Digital Niaga Tbk)
PT GOTO Gojek Tokopedia Tbk
Sea Ltd (PT Shopee International Indonesia)
Lazada (Alibaba Group Holding Limited)
- *Disclaimer: Major Players sorted in no particular order

Recent Industry Developments
- April 2025: TikTok–Tokopedia integration concluded; the combined entity aims to capture social shoppers by embedding livestream checkout into Tokopedia’s catalogue.
- March 2025: Unilever invested USD 50 million to enhance direct-to-consumer and B2B portals.
- February 2025: Shopee deployed 200 micro-fulfillment centres across provincial cities after a USD 120 million outlay.
- October 2024: Government expanded the Digital Entrepreneurship Academy to train 500,000 MSMEs by 2025.


Indonesia E-commerce Market Report Scope
The Indonesian e commerce industry is based on the GMV generated by B2B and B2C ecommerce across the country. The analysis is based on the market insights captured through secondary research and the primary. The market also covers the major factors impacting the Indonesia ecommerce market growth in terms of drivers and restraints.
The study also tracks important market metrics, underlying growth influencers, and significant industry vendors, providing support for market estimates and growth rates in Indonesia throughout the anticipated period. Indonesia ecommerce market is segmented by B2C ECommerce (beauty and personal care, consumer electronics, fashion and apparel, food and beverage, furniture and home, and other B2C applications (toys, DIY, media, etc.))) and B2B ecommerce. The Indonesia e-commerce market size and forecasts are provided in terms of value in USD for all the above-mentioned segments.
By Business Model
| B2C |
| B2B |
By Device Type
| Smartphone / Mobile |
| Desktop and Laptop |
| Other Device Types |
By Payment Method
| Credit / Debit Cards |
| Digital Wallets |
| BNPL |
| Other Payment Method |
By B2C Product Category
| Beauty and Personal Care |
| Consumer Electronics |
| Fashion and Apparel |
| Food and Beverages |
| Furniture and Home |
| Toys, DIY and Media |
| Other Product Categories |
| By Business Model | B2C |
| B2B | |
| By Device Type | Smartphone / Mobile |
| Desktop and Laptop | |
| Other Device Types | |
| By Payment Method | Credit / Debit Cards |
| Digital Wallets | |
| BNPL | |
| Other Payment Method | |
| By B2C Product Category | Beauty and Personal Care |
| Consumer Electronics | |
| Fashion and Apparel | |
| Food and Beverages | |
| Furniture and Home | |
| Toys, DIY and Media | |
| Other Product Categories |


Key Questions Answered in the Report
What is the projected size of the Indonesia e-commerce market in 2031?
The market is expected to reach USD 212.58 billion by 2031, growing at a 15.32% CAGR.
Which segment is growing faster, B2C or B2B?
B2B is forecast to expand at 18.74% CAGR through 2031, outpacing the B2C segment that currently dominates volume.
How significant is mobile commerce in Indonesia?
Smartphones accounted for 69.40% of transactions in 2025 and will remain the primary channel, growing at 18.38% CAGR.
What role does BNPL play in online payments?
BNPL is the fastest-growing payment method, advancing at 27.10% CAGR and lifting average order values by up to 50%.
Which product category shows the highest growth momentum?
Food and beverages lead with a 21.55% CAGR, supported by quick-commerce models and expanding cold-chain logistics.
How concentrated is market leadership among platforms?
The top three platforms control more than 80% share, indicating a moderately concentrated competitive landscape.
Page last updated on:


