
Indonesia Customs Brokerage Market Size and Share
Market Overview
| Study Period | 2020 - 2031 |
|---|---|
| Forecast Data Period | 2026 - 2031 |
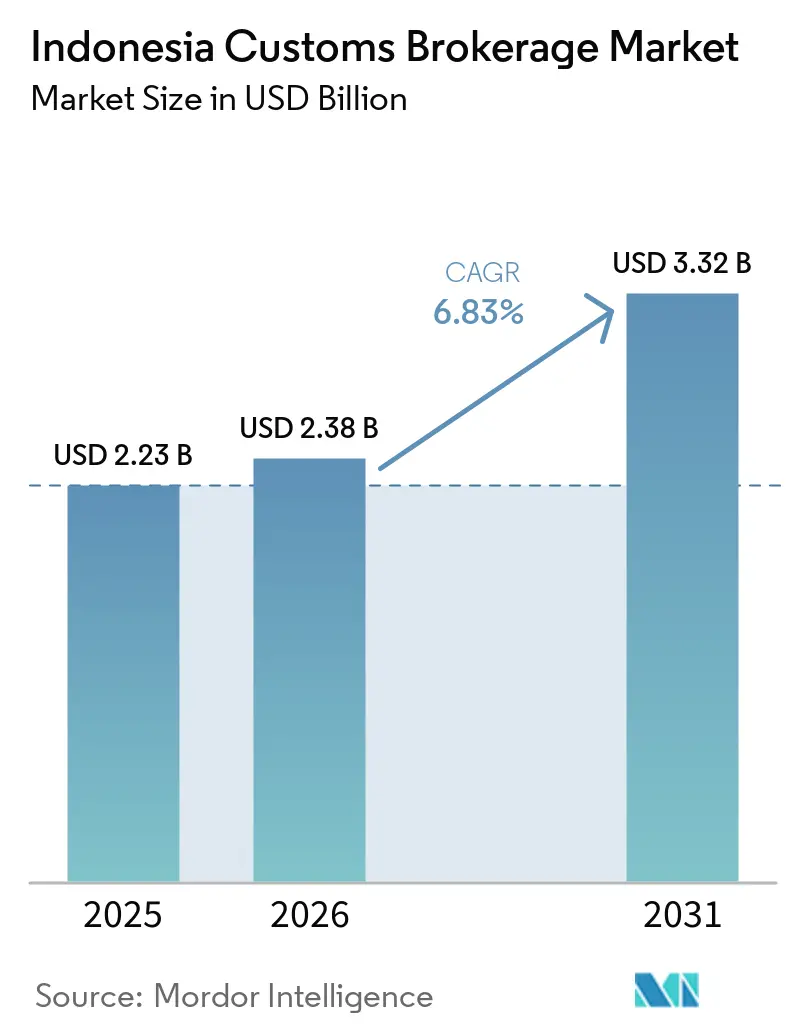
| Base Year Market Size (2025) | USD 2.23 Billion |
| Market Size (2026) | USD 2.38 Billion |
| Market Size (2031) | USD 3.32 Billion |
| Growth Rate (2026 - 2031) | 6.83 % |
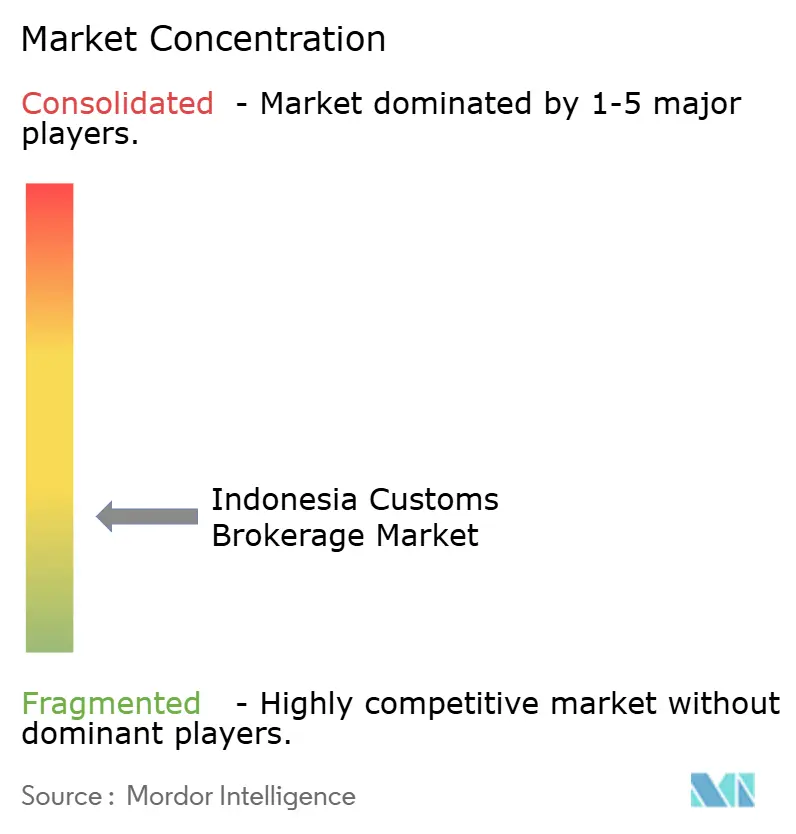
| Market Concentration | Low |
Major Players *Disclaimer: Major Players sorted in no particular order Image © Mordor Intelligence. Reuse requires attribution under CC BY 4.0. | |
Indonesia Customs Brokerage Market Analysis by Mordor Intelligence
The Indonesia customs brokerage market size was valued at USD 2.23 billion in 2025 and is estimated to grow from USD 2.38 billion in 2026 to reach USD 3.32 billion by 2031, at a CAGR of 6.83% during the forecast period (2026-2031).
Indonesia’s archipelagic geography and its role as Southeast Asia’s largest economy sustained demand for licensed customs brokerage services. Imports reached USD 137.24 billion in the first half of 2026, up 18.69% from the prior-year period, while exports reached USD 140.81 billion, up 4.13%. The growth in cargo volumes compressed clearance windows at Tanjung Priok and favored brokers with real-time compliance capabilities.[1]“Kinerja Ekspor Menguat, Surplus Nonmigas Tetap Kokoh pada Semester I 2026,” Ministry of Trade Republic of Indonesia, kemendag.go.id The Indonesia customs brokerage market also faced a more demanding regulatory environment as CEISA 4.0 became mandatory nationally in July 2026. Port development at Patimban and Kuala Tanjung began to shift clearance activity beyond Java, while brokers outside the island remained relatively thinly distributed.
Key Report Takeaways
- By mode of transport, ocean/sea held 58.67% of the Indonesia customs brokerage market share in 2025, while air freight recorded the highest projected CAGR at 8.67% through 2031.
- By broker type, freight forwarder/3PL-integrated brokers held 68.74% of the Indonesia customs brokerage market share in 2025 and recorded the highest projected CAGR at 7.98% through 2031.
- By importer size, large enterprises held 62.98% of the Indonesia customs brokerage market size in 2025, while SMEs and micro-shippers recorded the highest projected CAGR at 8.67% through 2031.
- By digital adoption, traditional brokerages held 76.24% of the Indonesia customs brokerage market size in 2025, while digital-first and API-based brokerages recorded the highest projected CAGR at 15.34% through 2031.
- By end-use industry, retail and e-commerce held 23.61% of the Indonesia customs brokerage market size in 2025, while pharmaceuticals and life sciences recorded the highest projected CAGR at 10.87% through 2031.
- By region, Java (Jakarta and BOD) held 56.89% of the Indonesia customs brokerage market size in 2025, while Sumatra recorded the highest projected CAGR at 11.34% through 2031.
Note: Market size and forecast figures in this report are generated using Mordor Intelligence’s proprietary estimation framework, updated with the latest available data and insights as of January 2026.
Indonesia Customs Brokerage Market Trends and Insights
Drivers Impact Analysis*
| Driver | (~) % Impact on CAGR Forecast | Geographic Relevance | Impact Timeline |
|---|---|---|---|
| International Trade Growth Increasing Customs Brokerage Demand | +1.8% | Global, highest concentration in Java (Tanjung Priok) | Medium term (2-4 years) |
| Cross-Border E-Commerce Expansion Boosting Clearance Volumes | +1.5% | Java, Sumatra, spillover to Bali and Kalimantan | Short term (≤ 2 years) |
| Customs Digitalization Improving Brokerage Processing Efficiency | +1.0% | National, with early gains in Tanjung Priok and Soekarno-Hatta | Medium term (2-4 years) |
| Port and Airport Throughput Expanding Clearance Requirements | +0.7% | Java, North Sumatra (Belawan, Kuala Tanjung), West Java (Patimban) | Medium term (2-4 years) |
| Regulatory Complexity Increasing Demand for Brokerage Expertise | +0.6% | National, with concentrated compliance demand in Jakarta clearance hubs | Short term (≤ 2 years) |
| Fragmented Island Networks Increasing Exception Management Requirements | +0.4% | Kalimantan, Sulawesi, Papua Region and Maluku Islands | Long term (≥ 4 years) |
| Source: Mordor Intelligence | |||
International Trade Growth Increasing Customs Brokerage Demand
Indonesia’s cumulative imports from January through July 2026 reached USD 163.33 billion, up 19.94% from the same period in 2025.[2]“Keputusan Direktur Jenderal Bea dan Cukai Nomor KEP-163/BC/2026,” Directorate General of Customs and Excise, perpajakan.ddtc.co.id Capital goods imports increased 17.38% year-over-year, while raw material imports rose 32.33% in July 2026. This import mix increased demand for broker capabilities in bonded zones and bonded logistics centers. These facilities use duty-suspension arrangements that require licensed brokerage management. Indonesia participated in at least 12 active bilateral and multilateral trade agreements, including RCEP, which added origin-verification work for imports and exports. The Indonesia customs brokerage market favored providers that combined operational clearance work with trade-agreement compliance knowledge.
Cross-Border E-Commerce Expansion Boosting Clearance Volumes
Indonesia’s cross-border e-commerce rules tightened during 2025 and 2026. Ministry of Finance Regulation PMK 4/2025 took effect in March 2025, extending customs and tax obligations to foreign electronic commerce platforms. The regulation required Indonesian-registered representation and itemized import reporting. Minister of Trade Regulation No. 19 of 2026 retained a USD 100 per-unit FOB floor for foreign-origin finished goods and added documentation requirements. These measures brought more cross-border transactions into formal customs processes rather than reducing the need for licensed clearance. Brokers with de minimis classification, LARTAS verification, and platform coordination capabilities were better placed to serve this volume.
Customs Digitalization Improving Brokerage Processing Efficiency
The government applied CEISA 4.0 across import, export, bonded zone, free trade zone, and cargo shipment services from July 2026.[3]“INSW Cuts Export-Import Process, SSm Export Already Applies at 41 Ports and 21 Airports,” Indonesia National Single Window, voi.id PMK No. 86 of 2025 also created a Logistics System Development Sub-Directorate within the National Single Window Institution. The sub-directorate focused on digital infrastructure supported by data. The Single Submission Export service operated at 41 ports and 21 airports by mid-2026 and reached 100% use at commodity quarantine checkpoints. The platform reduced the value of basic electronic filing as a differentiator. The Indonesia customs brokerage market instead placed greater value on pre-arrival classification, duty optimization, and post-entry audit support.
Port and Airport Throughput Expanding Clearance Requirements
Tanjung Priok handled 8.30 million TEUs in 2025. IPC Terminal Petikemas recorded 1.817 million TEUs in the first half of 2026, up 7.9% from the first half of 2025. Belawan added 531,200 TEUs through May 2026, up 5% year-over-year. 1 Patimban began container operations in January 2026 under a 37-year concession involving PT Samudera Pelabuhan Indonesia, Africa Global Logistics, and Toyota Tsusho Corporation. The expanding port network increased the value of brokers with a presence at new gateways or reliable local sub-agent relationships. This created opportunities outside a single Tanjung Priok-centered operating model.
Restraints Impact Analysis*
| Restraint | (~) % Impact on CAGR Forecast | Geographic Relevance | Impact Timeline |
|---|---|---|---|
| Changing Customs Regulations Increasing Compliance Management Complexity | -1.0% | National, with peak impact at Tanjung Priok and Soekarno-Hatta | Short term (≤ 2 years) |
| Port Congestion and Costs Pressuring Brokerage Efficiency | -0.6% | Java (Tanjung Priok, Tanjung Perak), North Sumatra (Belawan) | Short term (≤ 2 years) |
| Connectivity Gaps Limiting Brokerage Operations Outside Java | -0.5% | Kalimantan, Papua Region and Maluku Islands, Nusa Tenggara | Long term (≥ 4 years) |
| Specialist Shortages Constraining Complex Cargo Clearance Capacity | -0.4% | National, concentrated in secondary ports outside Greater Jakarta | Medium term (2-4 years) |
| Source: Mordor Intelligence | |||
Changing Customs Regulations Increasing Compliance Management Complexity
Indonesia issued 5 substantive customs and trade regulations in the 18 months through mid-2026. Each change required brokers to revise documentation procedures, system configurations, and training cycles. Permendag 16/2025 was amended by Permendag 37/2025 in November 2025 and Permendag 18/2026 in June 2026. These changes affected Import Approval requirements, Surveyor Report scopes, and late-filing penalties. Permenkes 5/2026 also directed pharmaceutical and medical-device imports through INSW-integrated pathways with a 90-day transition period. The combined changes created a costly multi-system recertification burden for smaller PPJK operators without dedicated compliance teams.
Port Congestion and Costs Pressuring Brokerage Efficiency
Higher throughput at Tanjung Priok created congestion pressure and longer dwelling times during periods of strong demand. Jakarta’s port authority prepared measures that included Yard Occupancy Ratio adjustments and container repositioning to Patimban. Jakarta and Surabaya ports used appointment-based customs clearance systems in 2026. Cargo without a pre-booked slot queued 7 to 10 days before terminal entry. This delay weakened the clearance commitments made to high-value importers. Predictive slot management and pre-arrival CEISA 4.0 submissions partly reduced the disruption. Their cost narrowed margins for firms that did not have sufficient clearance volume.
*Our forecasts treat driver/restraint impacts as directional, not additive. The impact forecasts reflect baseline growth, mix effects, and variable interactions.
Segment Analysis
By Mode of Transport: Ocean Dominance Sustained as Air Freight Accelerates
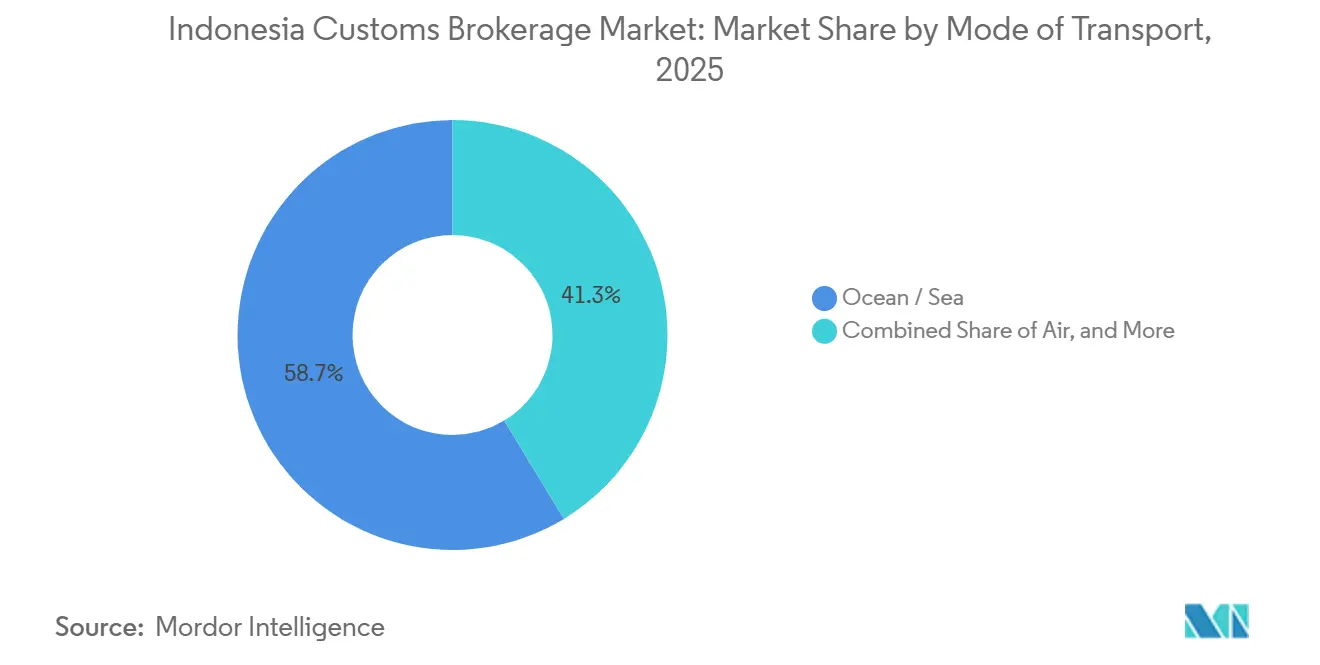
Ocean/sea clearances held 58.67% of the Indonesia customs brokerage market share in 2025. The segment relied on container shipping for bulk and manufactured goods moving across the archipelago. Tanjung Priok remained the largest source of clearance activity for this mode. Its container throughput grew 7.9% in the first half of 2026 compared with the first half of 2025. Ocean brokerage continued to require coordination across ports, shipping lines, bonded facilities, and import permits. The scale of sea-based imports favored brokers with established port operations and documentation teams.
Air freight recorded a projected CAGR of 8.67% through 2031. Pharmaceutical cold-chain requirements and electronics lead-time pressure supported the mode’s faster expansion. PT Gapura Angkasa obtained CEIV Pharma certification in May 2026, showing investment in controlled-temperature cargo infrastructure at Soekarno-Hatta International Airport. Pharmaceutical imports also moved through INSW-integrated pathways under Permenkes 5/2026. This added a documentary checkpoint at air cargo terminals. Brokers with pre-clearance capabilities could offer a faster, specialized service for these shipments.



By Broker Type: Integrated Providers Lead, Yet Pure Brokers Hold Niche Defensibility
Freight forwarders and 3PL-integrated brokers accounted for 68.74% of the Indonesia customs brokerage market size in 2025. The same segment recorded the highest projected CAGR at 7.98% through 2031. Large importers combined sea freight procurement, customs clearance, inland transport, and bonded-zone management under single-provider contracts. This arrangement reduced the number of operational contacts for customers. Providers with warehouse networks and integrated systems were well placed to win these bundled contracts. Standalone PPJK agents faced a narrower pool of work where they lacked related logistics assets.
Pure customs brokers remained relevant in complex categories that required specialized expertise. Pharmaceutical import approvals, LARTAS-restricted commodities, and project cargo often involved multiple agency sign-offs. These activities supported premium fees that integrated firms did not always standardize in bundled contracts. CEISA 4.0 removed early digital filing as a meaningful point of difference once the system became mandatory.[4]“Tanjung Priok Port Posts Container Steady Growth in 2025 to 8.30 Million TEUs,” PT Pelabuhan Indonesia, theshippinggazette.com Proprietary HS classification libraries and automated LARTAS alerts still helped reduce errors. Procurement teams increasingly consider Red-channel examination outcomes and post-clearance audit results when assessing broker performance.
By Importer Size: Large Enterprises Anchor Revenue as SME Tier Accelerates
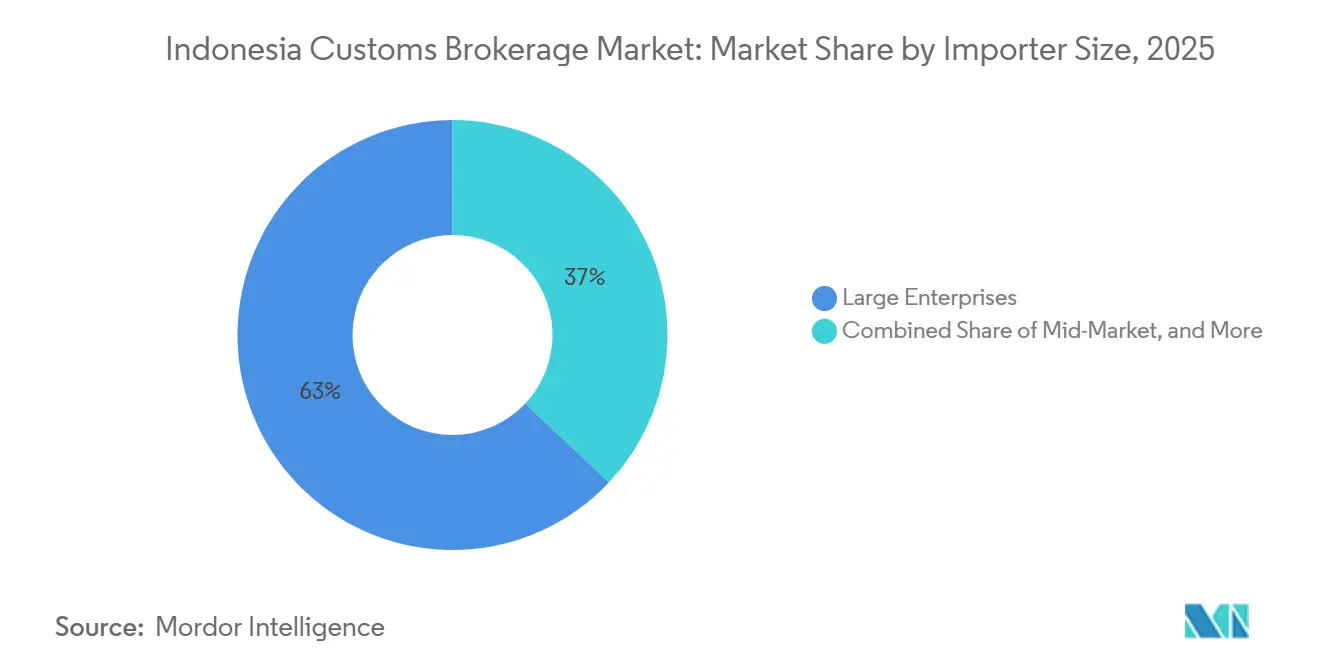
Large enterprises held 62.98% of the Indonesia customs brokerage market share in 2025. Their import activity covered automotive, electronics, and consumer goods supply chains. Their demand remained stable because these companies managed large and recurring import programs. However, major importers periodically rebid brokerage contracts against their in-house compliance alternatives. This process limited pricing power even when cargo volumes rose. Mid-market importers formed a contested customer group for dedicated brokers and integrated logistics providers.
SMEs and micro-shippers recorded a projected CAGR of 8.67% through 2031. Cross-border e-commerce expansion and stricter licensing under Permendag 19/2026 supported this growth. Regulatory formalization increased the need for advisory services even as it added costs for small importers. LogiLink connected with INSW and CEISA 4.0 to aggregate smaller-shipment clearance volume. Such platforms became an important route to customers for licensed brokers. Brokers without application programming interface connections to SME-facing platforms had less access to the fastest-growing importer group.
By Digital Adoption: Traditional Brokerages Retain Scale but Cede Growth to API-Based Operators
Traditional brokerages held 76.24% of Indonesia customs brokerage market share in 2025. Long-standing enterprise relationships and physical document handling supported that position. Complex port clearances still required capabilities that were difficult to replicate through a platform alone. Bonded-zone facility investments also created a capital-intensive advantage for established operators. PT Puninar Logistics operates a bonded storage in Cakung, while Maersk Logistics Indonesia received approval for a PLB facility in Semarang. These assets supported the continuing scale of traditional brokerage firms.
Digital-first and API-based brokerages recorded a projected CAGR of 15.34% through 2031. This was the strongest growth rate across the segmentation types. SME formalization, CEISA 4.0 adoption, and e-commerce release-speed requirements supported their expansion. Digital systems automated PIB and PEB declaration drafting from commercial documents for CEISA 4.0 filing. Automation reduced document preparation time from hours to minutes. Classification error rates remained important because customs monitoring continued through Red-channel and post-clearance audit outcomes.
By End-Use Industry: E-Commerce Leads by Share, Pharma Drives the Growth Equation
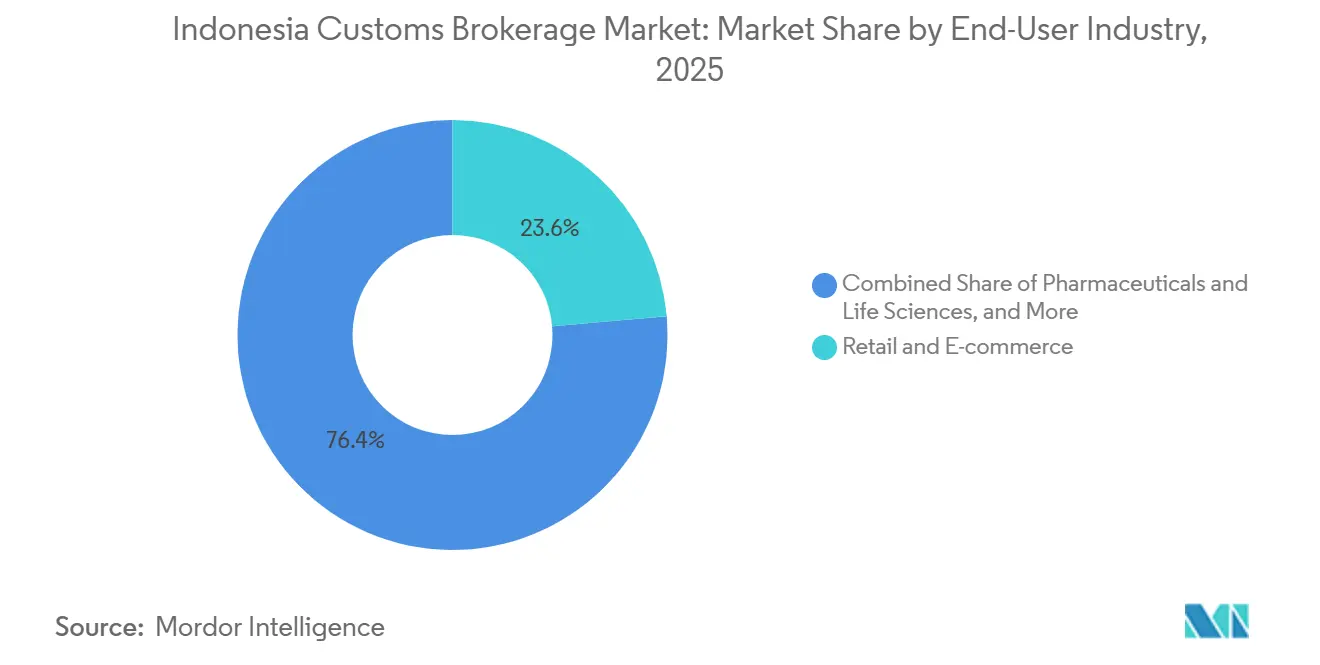
Retail and e-commerce accounted for 23.61% of the Indonesia customs brokerage market size in 2025. Marketplace flows of fast-moving consumer goods and apparel supported this position. Automotive and EV formed the second-largest end-use cluster. Indonesia attracted production commitments from 7 EV manufacturers, with component imports requiring specialized HS classification and LARTAS management. Electronics and semiconductors, aerospace and defense, and chemicals and industrial goods made up the remaining volume mix. Chemical clearances required precursor permits alongside BAPETEN and BPOM approvals.
Pharmaceuticals and life sciences recorded a projected CAGR of 10.87% through 2031. The segment’s Indonesia customs brokerage market size benefited from rising healthcare logistics activity and high compliance needs. BPOM marketing authorization, CDOB 2025 documentation, and the Permenkes 5/2026 requirement created a specialist clearance process. Each pharmaceutical import transaction required careful documentation and agency coordination. DSV expanded nationwide delivery of medical devices to more than 2,000 community health centers in May 2026 for the Ministry of Health, Republic of Indonesia. The work illustrated the scale of institutional healthcare contracts available to brokers with cold-chain compliance capabilities.
Geography Analysis
Java held 56.89% of Indonesia customs brokerage market share in 2025. Jakarta, the Bogor-Depok-Tangerang-Bekasi corridor, and Surabaya formed the center of the country’s import economy. Tanjung Priok handled 8.30 million TEUs in 2025. PTP Nonpetikemas throughput rose 17.85% year-over-year through July 2026. Presidential Regulation No. 41 of 2026 and Government Regulation PP No. 24 of 2026 added compliance work for goods moving through Tanjung Priok and Soekarno-Hatta. Patimban started container operations in July 2026 and expanded brokerage demand within Java. It did not materially reduce Tanjung Priok’s leading role.
Sumatra recorded the highest projected regional CAGR at 11.34% through 2031. Investment at Belawan and Kuala Tanjung, commodity processing in North Sumatra and Riau, and cross-Malacca trade flows supported the region. Belawan handled 531,200 TEUs through May 2026, up 5% year-over-year. The Belawan-Kuala Tanjung corridor handled 347,001 TEUs in the first half of 2026. PT Samudera Indonesia opened a weekly direct service between Kuala Tanjung, Singapore, and Penang in May 2026. The new connection reduced multi-leg transit for Sumatran exporters and importers. Palembang, Pekanbaru, and Jambi remained emerging areas where sub-agent networks could extend brokerage coverage.
Kalimantan, Sulawesi, Bali and Nusa Tenggara, and the Papua Region and Maluku Islands remained underserved. Licensed broker density and bonded-zone infrastructure were limited across these locations. The Kalimantan-Malaysia corridor around Entikong-Pontianak carried dutiable truck and rail freight. Limited licensed-broker availability meant some shipments moved through informal clearance channels. Makassar New Port was the key eastern Indonesian clearance hub, although its documentation volume remained below what its physical capacity could support. Specialist labor for LARTAS-restricted fisheries and mining cargo was concentrated in Java. Tourism-related imports in Bali and the nickel downstream chain in Nusa Tenggara added demand, but network expansion depended on future connectivity improvements.
Competitive Landscape
The Indonesia customs brokerage market is fragmented. Global integrated forwarders combined customs brokerage with domestic distribution and bonded-zone management. DSV completed its local DB Schenker integration in May 2026, enlarging its client roster and operational footprint. The integration brought air freight, ocean freight, and contract logistics under a unified local structure. It increased pressure on mid-tier specialists operating in a single mode. DHL Group, DSV, and Kuehne+Nagel competed through broad multimodal service capabilities. CEVA Logistics, Expeditors International, NX Group, and Yusen Logistics emphasized sector-specific compliance depth.
NX Group merged PT NX Lemo Indonesia Logistik and PT Nippon Express Indonesia in March 2026. The combined entity offered unified air and ocean clearance from one legal entity. This simplified account management for corporate importers that had worked with 2 separate NX operations. Kuehne+Nagel differentiated through energy project logistics and local-content documentation for Indonesia’s energy projects. Regional providers, including PT Samudera Indonesia and PT Puninar Logistics, held advantages in Java-based bonded zones. Licensed PPJK agents formed a long tail of smaller firms concentrated at Tanjung Priok. Their limited compliance resources created a competitive gap as rules and systems changed more frequently.
Opportunities centered on pharmaceutical cold-chain brokerage at secondary airports, SME digital aggregation, and Kalimantan-Malaysia land freight clearance. Logistics technology companies integrated CEISA 4.0 filing with INSW permit verification in a single service. This separated document preparation from higher-value advisory work. DSV invested more than USD 50 million in cold-chain logistics across Vietnam, Indonesia, and Thailand, with regional capacity reaching full operation by Q3 2026. That investment supported its position in temperature-controlled healthcare logistics. PMK 86/2025 strengthened the National Single Window Institution and favored operators that had already integrated with INSW systems.
Indonesia Customs Brokerage Industry Leaders
DHL Group
DSV A/S
PT Samudera Indonesia Tbk
PT Puninar Logistics
PT Kamadjaja Logistics
- *Disclaimer: Major Players sorted in no particular order

Recent Industry Developments
- August 2026: Maersk Logistics Indonesia obtained Bonded Logistics Center approval from the Customs and Excise Regional Office of Central Java and Yogyakarta in Semarang, enabling duty-suspended storage and management of import raw materials and export-ready apparel and footwear.
- June 2026: PT Samudera Indonesia and Toyota Tsusho Corporation signed a Memorandum of Understanding in Jakarta to jointly develop and operate an integrated distribution center combining transportation and warehousing services, bonded-zone facilities, and supply chain optimization solutions.
- June 2026: CEVA Logistics signed a 3-year global Memorandum of Understanding with BYD Group to expand automotive logistics cooperation across 6 continents, including customs coordination, warehousing, and delivery management.
- December 2025: DHL Express Indonesia opened its Surabaya processing center, expanding East Java logistics capacity for manufacturers and exporters.


Indonesia Customs Brokerage Market Report Scope
| Ocean / Sea |
| Air (Express and General Cargo) |
| Cross-Border Land (Truck and Rail) |
| Pure Customs Broker |
| Freight Forwarder / 3PL-Integrated Brokers |
| Large Enterprises |
| Mid-Market |
| SMEs / Micro-shippers |
| Traditional Brokerages |
| Digital-first / API-based Brokerages |
| Retail and E-commerce |
| Automotive and EV |
| Electronics and Semiconductors |
| Pharmaceuticals and Life Sciences |
| Aerospace and Defense |
| Chemicals and Industrial Goods |
| Java (Jakarta and BOD) |
| Sumatra |
| Kalimantan |
| Sulawesi |
| Bali and Nusa Tenggara |
| Papua Region and Maluku Islands |
| By Mode of Transport | Ocean / Sea |
| Air (Express and General Cargo) | |
| Cross-Border Land (Truck and Rail) | |
| By Broker Type | Pure Customs Broker |
| Freight Forwarder / 3PL-Integrated Brokers | |
| By Importer Size | Large Enterprises |
| Mid-Market | |
| SMEs / Micro-shippers | |
| By Digital Adoption | Traditional Brokerages |
| Digital-first / API-based Brokerages | |
| By End-Use Industry | Retail and E-commerce |
| Automotive and EV | |
| Electronics and Semiconductors | |
| Pharmaceuticals and Life Sciences | |
| Aerospace and Defense | |
| Chemicals and Industrial Goods | |
| By Region | Java (Jakarta and BOD) |
| Sumatra | |
| Kalimantan | |
| Sulawesi | |
| Bali and Nusa Tenggara | |
| Papua Region and Maluku Islands |


Key Questions Answered in the Report
What was the Indonesia customs brokerage market size in 2026?
The Indonesia customs brokerage market size stood at USD 2.38 billion in 2026 and is projected to reach USD 3.32 billion by 2031 at a 6.83% CAGR.
Which transport mode led customs brokerage revenue in Indonesia?
Ocean/sea held 58.67% of revenue in 2025, supported by the concentration of container traffic at Tanjung Priok.
Which broker model had the largest revenue share?
Freight forwarder and 3PL-integrated brokers held 68.74% of revenue in 2025, reflecting demand for bundled logistics and clearance services.
Why are digital customs brokerages growing faster?
Digital-first and API-based Brokerages recorded a projected CAGR of 15.34% through 2031, supported by SME formalization and CEISA 4.0 adoption.
Which end-use sector is growing fastest for customs brokerage?
Pharmaceuticals and life sciences recorded a projected CAGR of 10.87% through 2031 because import clearance involves specialist documentation and approvals.
Which Indonesian region is growing fastest for brokerage services?
Sumatra recorded a projected CAGR of 11.34% through 2031, supported by port investment and expanding cross-Malacca trade flows.
Page last updated on:


 Your data is secure and never sold or shared.


